Abstract
The human auditory system has an exceptional ability to separate competing sounds, but the neural mechanisms that underlie this ability are not understood. Responses of inferior colliculus (IC) neurons to “mistuned” complex tones were measured to investigate possible neural mechanisms for spectral segregation. A mistuned tone is a harmonic complex tone in which the frequency of one component has been changed; that component may be heard as a separate sound source, suggesting that the mistuned tone engages the same mechanisms that contribute to the segregation of natural sounds. In this study, the harmonic tone consisted of eight harmonics of 250 Hz; in the mistuned tone, the frequency of the fourth harmonic was increased by 12% (120 Hz). The mistuned tone elicited a stereotypical discharge pattern, consisting of peaks separated by about 8 ms and a response envelope modulated with a period of 100 ms, which bore little resemblance to the discharge pattern elicited by the harmonic tone or to the stimulus waveform. Similar discharge patterns were elicited from many neurons with a range of characteristic frequencies, especially from neurons that exhibited short-latency sustained responses to pure tones. In contrast, transient and long-latency neurons usually did not exhibit the stereotypical discharge pattern. The discharge pattern was generally stable when the stimulus level or component phase was varied; the major effect of these manipulations was to shift the phase of the response envelope. Simulation of IC responses with a computational model suggested that off-frequency inhibition could produce discharge patterns with these characteristics.
INTRODUCTION
The human auditory system has an exceptional ability to separate competing sounds that overlap in frequency and in time (Yost 1991). Two processes underlie this ability; first, spectral components belonging to each sound are isolated or “segregated,” and second, the components associated with each source are grouped (Darwin and Carlyon 1995). The results reported here have relevance for the first process, spectral segregation. One powerful acoustic cue that can be used for spectral segregation is harmonicity. Sounds whose spectra consist of integer multiples—harmonics—of a common fundamental frequency tend to be grouped; that is, they are fused and perceived as having a low pitch that arises from a single source (Bregman 1990; Hartmann et al. 1990; Yost 1991). Spectral components that deviate from one harmonic series tend to be segregated from that series and perceived as separate sound sources. The neural processing that uses acoustic cues such as harmonicity to segregate spectral components is poorly understood.
A simple stimulus for studying spectral segregation based on harmonicity is a complex tone in which one component in a harmonic series is shifted in frequency, or “mistuned” (Hartmann 1988). A component mistuned by 1-2% or more can be heard as a second sound source, perceived simultaneously with the original harmonic tone but having a different pitch (Hartmann et al. 1990; Moore et al. 1986). Smaller amounts of mistuning that do not lead to the perception of a second tone may still be detectable (Lee and Green 1994; Moore et al. 1985). The mistuned tone appears to engage the same neural mechanisms that underlie the processing of simultaneous competing sounds in more natural listening situations. Sinex et al. (2002b) described the responses of inferior colliculus (IC) neurons to mistuned tones. They varied stimulus parameters including the amount of mistuning and the harmonic number that was mistuned, and found that these stimulus manipulations could produce dramatic changes in the temporal discharge patterns of IC neurons. In contrast, comparable stimulus changes produced only modest quantitative changes in the discharge patterns ofauditory nerve fibers (Sinex et al. 2003a). They concluded that a significant transformation in the processing of complex sounds occurred between the auditory nerve and the IC, and that information related to the presence of multiple sound sources might be conveyed by the temporal discharge patterns of IC neurons.
This study extends the findings of Sinex et al. (2002b), who focused on the representation of many different mistuned tones. In the present study, the representation of one particular tone was examined in detail, with the goal of determining how the same stimulus was processed by different neurons. Although the amount of mistuning was not systematically varied, effects of changing additional stimulus parameters including level and component phases were examined. Observations of responses to stimuli synthesized with different component phases and presented at different levels provided a control against the possibility that the distinctive temporally patterned responses observed previously were a fortuitous consequence of the use of sine-phase multicomponent tones. Effects of component phase may also provide evidence about mechanisms that underlie the representation of mistuned tones. Hypotheses about those potential mechanisms were tested by presenting the same stimuli to a simple computational model that simulated the responses of brain stem and IC neurons. The model explored the consequences of combining the responses of simulated peripheral and brain stem neurons in various ways, with the goal of identifying integrative strategies capable of generating discharge patterns like those typically exhibited by IC neurons. Portions of these results were presented as abstracts (Sinex 2004; Sinex and Li 2004; Sinex et al. 2003a).
METHODS
Animal preparation
Responses were obtained from single neurons in the IC of the chinchilla. The procedures were similar to those described previously (Sinex et al. 2002b), although several significant changes were made. Different anesthetics and different recording electrodes were used. In addition, complex tones were synthesized with individual components in different phase relations, component amplitudes were normalized to be equal at the eardrum, and different earphones were used. None of these changes produced results that were inconsistent with those of Sinex et al. (2002b). All procedures were approved by the Institutional Animal Care and Use Committee at Arizona State University.
Animals were anesthetized by injection of a mixture of 36 mg/kg ketamine and 4 mg/kg xylazine. Supplemental injections of ketamine or ketamine-xylazine were given as required to maintain a surgical level of anesthesia. Animals were placed in a stereotaxic instrument (David Kopf Instruments) in a sound-attenuating booth (Acoustic Systems, Austin TX). The skull was opened and a portion of nonauditory cerebral cortex directly above the IC on the right side was aspirated to expose the dorsal surface of the IC. Recording electrodes were placed above the IC at predetermined stereotaxic coordinates referenced to visual landmarks (Nuding et al. 1999), then advanced from outside the sound booth with a hydraulic microdrive (Trent-Wells, Coulterville, CA). The electrode trajectory passed through the central nucleus of the IC, in a parasagittal plane.
In early experiments, tungsten electrodes insulated with Parylene C were used. In those experiments, the locations of selected recording sites were marked with electrolytic lesions made by passing 5 μA of current through the electrode tip for 10 s, and their locations within the IC were confirmed histologically, using standard methods. In later experiments, recordings were obtained with carbon-fiber electrodes (Kation Scientific, Minneapolis, MN). These electrodes were directed toward the same stereotaxic coordinates as in earlier experiments, but recording sites were not marked or confirmed histologically. Most neurons recorded with either electrode type exhibited secure, short-latency responses to tone bursts, and had sharp tuning with characteristic frequencies (CFs) that increased with increasing depth. These properties are consistent with those reported in previous investigations of the central nucleus of the IC (Langner and Schreiner 1988; Merzenich and Reid 1974; Nuding et al. 1999). Based on these physiological properties and the histological observations, it is likely, but not certain, that the data presented here were obtained from neurons in the central nucleus.
Stimuli
The stimuli were complex tones consisting of eight sinusoidal components. Tones were 500 ms long, presented once per second at levels between 10 and 70 dB SPL per component. The amplitudes of individual components were adjusted during synthesis so that they would have equal SPL at the eardrum. The overall SPL was always 9 dB higher than the level of each individual component. In the harmonic tones, the components were the first eight harmonics of a 250-Hz fundamental. In the mistuned tones, the frequency of component 4 was increased by 12%, from 1.000 to 1.120 kHz. In the previous study (Sinex et al. 2002b), this stimulus often elicited responses with a distinctive modulated temporal pattern that was useful as a standard against which changes across stimulus conditions and neurons could be evaluated. That pattern is described in more detail below and is referred to in this report as the “stereotypical pattern.”
The starting phase relation between individual components in the complex tones was also varied. In the “sine” condition, each individual component in the complex tone started in sine phase. In the “cosine” condition, each individual component started in cosine phase. In the “random” conditions, each component had a different, randomly chosen starting phase. As many as three different sets of randomly chosen phases were used. Varying component starting phase changes the waveform and amplitude envelope of the stimulus; however, in informal listening tests there were no audible differences between stimuli synthesized with different starting phases. Using a restricted set of possible starting phases allowed responses to a common stimulus to be compared across neurons. Using more than one set of phases, and more than one randomization, reduced the possibility that the observed responses reflected some idiosyncratic property of one set of phases.
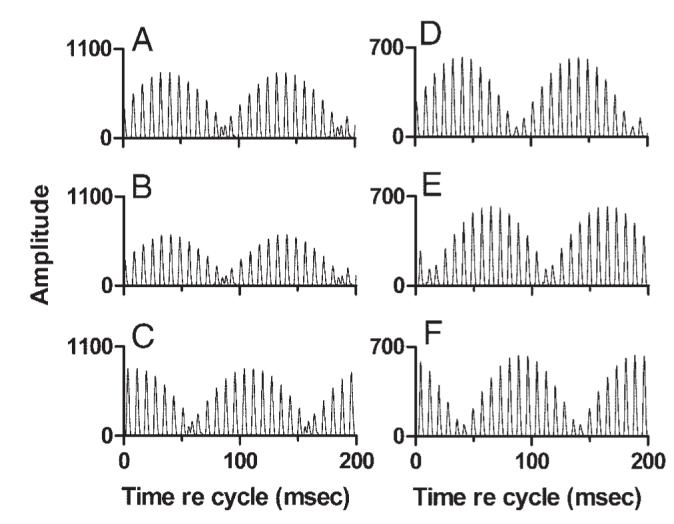
The waveforms of the harmonic tones were perfectly periodic, with a flat envelope and a period of 4 ms (Fig. 1, A-C). Mistuning changed the envelope and also the fine structure of each waveform (Fig. 1, D-F). With 12% mistuning of component 4, the frequencies of the eight spectral components were integer multiples of 10 Hz, which became the actual fundamental frequency of the mistuned tone. The waveforms exhibited shallow modulation with a period of 100 ms, the reciprocal of 10 Hz. Mistuning did not change the 4-ms spacing of waveform peaks, although the amplitudes of successive peaks were no longer identicalas they were in the harmonic tones (Fig. 1, A-C). Mistuning did not change the overall level of the tone.
FIG. 1.
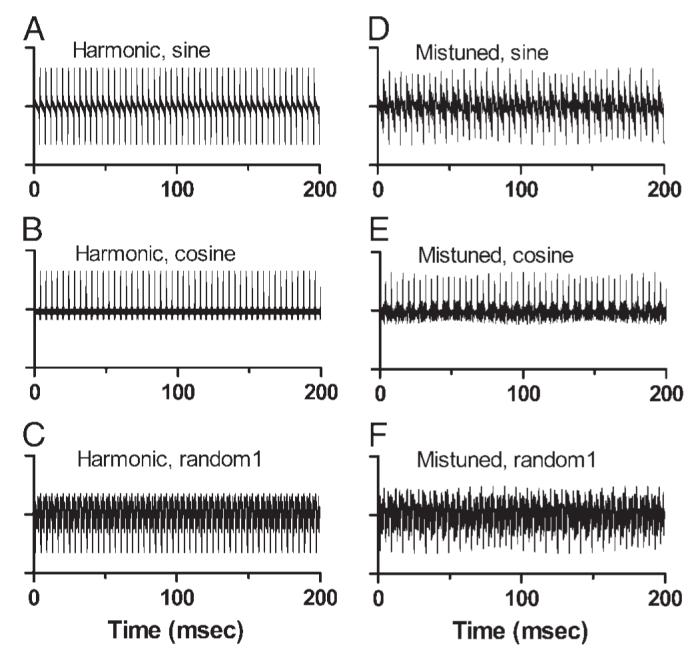
Stimulus waveforms. A-C: 200-ms segments of the waveforms of harmonic tones synthesized with sine, cosine, or random component phase. D-F: waveforms of mistuned tones with the same component phases. For these plots, waveforms were synthesized with equal component amplitudes.
Data collection and analysis
Stimulus generation, stimulus presentation, and data collection were controlled by computer. Waveforms were digitally synthesized, passed through digital-analog converters, programmable attenuators, and antialiasing filters (all from TDT, Alachua, FL), then delivered to a closed acoustic system incorporating ER2A insert earphones and an ER7 probe-tube microphone (Etymotic Research, Elk Grove Village, IL). The acoustic system was calibrated for each experiment. Tones were nearly always delivered monaurally to the contralateral ear. Binaural presentation was used as a last resort if neurons were unresponsive to monaural stimuli; one example of binaural responses is included in the Results below.
When a neuron was isolated, estimates of CF and (if necessary) binaural sensitivity were obtained manually. After this initial characterization of the neuron, a detailed frequency-response map was obtained with an automated procedure that presented tones at multiple frequencies and levels (Nuding et al. 1999). These data were used to make a more precise estimate of CF and threshold at CF. In most cases the frequency-response map was remeasured in the presence of a fixed-level CF tone. The fixed tone elicited a consistent response that made it possible to estimate the frequency-SPL regions that provided inhibitory input to the neuron.
Responses to 500-ms tone bursts at CF were also obtained and used to classify each neuron according to the shape of its peristimulus time (PST) histogram and first-spike latency (Nuding et al. 1999). From the PST histogram obtained at 20≇30 dB above threshold, the ratio of discharge rate in the first 100 ms to the rate during the final 400 ms was calculated. Sustained units responded throughout the CF tone, although the PST histogram often exhibited a peak at tone onset. First-spike latencies were usually <20 ms, and the ratio of the onset discharge rate to the steady-state discharge rate typically ranged between 1 and 5. Pauser units exhibited a short-latency transient response and a second sustained response, separated by a silent interval lasting several milliseconds; for pauser units, first-spike latencies were usually <20 ms, but the ratio of discharge rates was often <1. Some sustained neurons exhibited pauser responses at higher SPLs, so the distinction between these categories should be considered somewhat arbitrary.
Transient units exhibited spikes just after stimulus onset but were silent or nearly silent afterward. First-spike latencies were usually <20 ms, and discharge-rate ratios varied from 5 to infinite. Long-latency units exhibited sustained or transient discharge patterns, but their first-spike latencies were >30 ms. These units also tended to respond with lower discharge rates, and the possibility that at least some of these were located outside the central nucleus cannot be ruled out. Neurons could be assigned to the transient and long-latency categories with more confidence than was the case for the other categories.
The data presented below are representative of the responses of 101 IC neurons. Of these, 95 neurons were studied with at least one pair of complex tones (a harmonic tone and a mistuned tone that was equivalent in every respect except for the frequency of the mistuned component). Forty-eight of those units were classified as “sustained,” 18 units as pauser, 11 as transient, and 18 as long-latency.
Spikes were displayed as PST or cycle histograms with 1-ms bins. Cycle histograms were constructed from spikes occurring between 100 and 500 ms after tone onset, with a 5-ms correction for response latency. A correction was made to include as many spikes as possible in the analysis. A constant correction was used, rather than a unique correction for each neuron, so that time shifts illustrated in the figures below can always be attributed to properties of the stimuli or the neurons,rather than to the latency corrections. The length of the cycle histograms, 200 ms, included two cycles of the fundamental period of the mistuned tone. For some analyses, the discrete Fourier transforms (DFTs) of cycle histograms were calculated; for this calculation, the histograms were regenerated with 256 bins per 200 ms.
Complex tones were presented in a quasi-random order intended to counterbalance harmonic and mistuned conditions, and the various phase conditions, as well as cover a range of SPLs. Typically, each complex tone was presented 100 times.
Computational model
The model incorporated three sequentially ordered stages of processing, which loosely correspond to the cochlear, brain stem, and midbrain levels of the auditory pathway. The model simplified or omitted many details of brain stem processing and it did not attempt to simulate membrane conductances, membrane voltages, or spike discharges, as has been done in more sophisticated biophysical models (Borisyuk et al. 2002; Cai et al. 1998a,b; Hewitt and Meddis 1994; Nelson and Carney 2004). Gammatone filters (Patterson et al. 1992), as implemented by Slaney (1994), were used to simulate the frequency selectivity of Stage 1 channels. Stage 2 channels represent neurons in nuclei of the lower auditory brain stem, including those that provide either excitatory or inhibitory input to the IC (Burger and Pollak 2001; Li and Kelly 1992; Oliver and Shneiderman 1991). Stage 2 channels derived their frequency selectivity directly from a single Stage 1 input; no lateral interactions between Stage 2 channels were simulated. However, the output of each Stage 2 channel was low-pass filtered at 400 Hz to extract the response envelope produced by a restricted frequency region of the stimulus. Stage 3 explicitly represented the IC. The key features of Stage 3 were that each channel received input from Stage 2 channels with different CFs, and that excitatory and also inhibitory inputs were combined. The Stage 2 inputs were weighted and summed; the CFs, weights, and number of these inputs are the parameters that were varied in this study. The summed response was low-pass filtered at 200 Hz, to simulate the decreased ability of IC neurons to follow AM, compared with neurons in the lower brain stem (Krishna and Semple 2000; Langner and Schreiner 1988; Rees and Møller 1983). Thus for a Stage 3 channel that received input from “N” Stage 2 frequency bands, the response at Stage 3 (before half-wave rectification and low-pass filtering) was
where R3(t) is the response of one Stage 3 channel at time t, R2n(t) is the response of the nth Stage 2 channel, and Wn is the weight, positive or negative, assigned to that channel. The summation was carried over N Stage 2 channels.
At each stage of the model, the output of a channel was an analog waveform; spikes or spike trains were not generated. Temporal details of these output waveforms can be compared with the temporal discharge patterns of actual neurons.
RESULTS
Responses of neurons with different pure-tone temporal discharge patterns
The stereotypical discharge pattern described by Sinex et al. (2002b) was observed in response to mistuned tones in many, but not all, IC neurons. The pattern was most likely to occur, and to be most distinctive, in neurons with CFs within a broad range between about 0.25 and 3 kHz that exhibited short-latency sustained or pauser responses to pure tones.
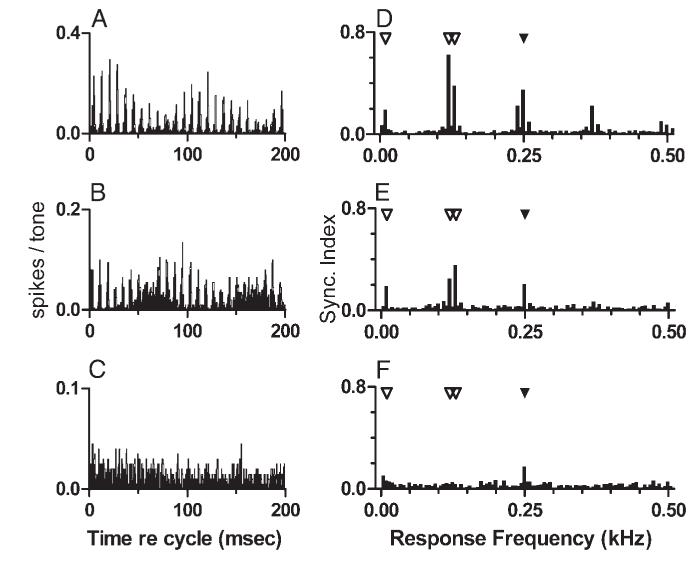
Responses of one representative sustained neuron to simple and complex tones are shown in Fig. 2. The neuron’s sustained response to CF tones included two to three synchronized spikes at response onset, accounting for the peak in the PST histogram in Fig. 2A; later spikes occurred with more variable latencies. Except for the onset peak, the PST histogram exhibited no stimulus-related temporal pattern. The response to the harmonic complex tone (Fig. 2B) was similar, except that the discharge rate was lower. As was the case for the pure-tone stimulus, no obvious temporal pattern could be seen during the sustained response. However, synchrony indices (SIs; Johnson 1980) obtained by Fourier analysis revealed that weak but statistically significant discharge synchrony did occur at 250 Hz (SI = 0.19, α < 0.01, Rayleigh statistic; Rhode 1976). The periodicity of the response most likely reflected the envelope frequency of the harmonic tone. In contrast, the mistuned tone elicited a larger sustained response with a distinctive modulated temporal pattern, which was clearly different from the response to the harmonic tone (Fig. 2C). After the onset response, the discharge pattern was characterized by peaks separated by about 8 ms, and slow modulation with a period of 100 ms. This is the pattern described in detail in the preliminary report (Sinex et al. 2002b) and referred to in the Methods as the “stereotypical pattern” against which changes associated with stimulus parameters or characteristics of neurons will be evaluated. As noted previously, this discharge pattern bore no simple relation to the stimulus waveform, in which peaks occurred every 4 ms. Although the waveforms of mistuned stimuli were modulated with the same 100-ms period, the depth of modulation was much greater in this response than it was in the stimulus. Fourier analysis of this discharge pattern indicated that the response included large components synchronized to several frequencies of interest. In this example, the SIs were 0.19 at 10 Hz, 0.63 at 120 Hz, 0.38 at 130 Hz, and 0.39 at 250 Hz; each value was statistically significant (α < 0.01, Rayleigh statistic). The pronounced 10-Hz modulation most likely reflected beating between the two larger response components at 120 and 130 Hz (the term “beating” as used here refers to an interaction between phase-locked responses, not beating between acoustic stimulus components). The origin of response components at those particular frequencies is discussed in the following text and in Sinex et al. (2002b). By contrast, in the response to the harmonic tone, the SIs at the same four frequencies were lower, and as noted only the component at 250 Hz reached statistical significance.
FIG. 2.
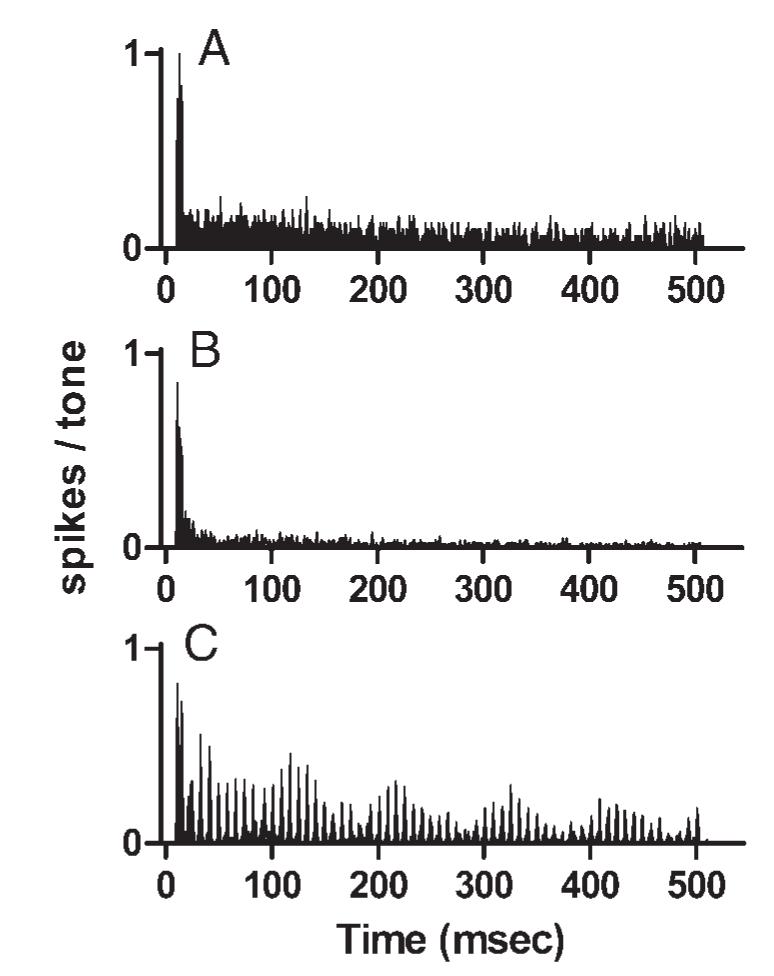
Discharge patterns of a representative sustained neuron. A: peristimulus time (PST) histogram of the responses to a 0.87-kHz, 60-dB SPL pure tone. Ordinate for this and other response histograms is the number of spikes in each 1-ms bin after normalization for the number of stimulus presentations. Steady-state response of approximately 0.1 spikes/tone in this example is equivalent to an average discharge rate of 100 spikes/s. Neuron 0312-15, characteristic frequencie (CF) = 0.87 kHz, threshold at CF = 30 dB SPL. B: PST histogram of the responses of the same neuron to the harmonic complex tone with f0 = 0.25 kHz, 8 components, sine phase, 60 dB SPL per component. C: PST histogram of the responses of the same neuron to the mistuned tone. All stimulus parameters were the same as in B, except component 4 was mistuned by 12%.
Neurons with other discharge patterns in response to CF tones could exhibit different discharge patterns in response to complex tones. Figure 3 presents comparable data from a neuron that had similar frequency selectivity but exhibited a pauser discharge pattern in response to CF tones (Fig. 3A). The harmonic complex tone elicited a sustained but only weakly patterned response (Fig. 3B), similar to the previous example. As in Fig. 2, the only component in the synchronized response of the harmonic tone that reached statistical significance was at 250 Hz (SI = 0.16, α < 0.01). Unlike the sustained neuron, there was only a small peak at the onset of the response to the harmonic tone. The duration of the pause was reduced, relative to the response to the CF tone. In response to the mistuned tone, the temporal discharge pattern of this pauser neuron exhibited some of the same features, although the pattern was less apparent than that for the sustained neuron shown in Fig. 2. As in the data shown in Fig. 2, statistically significant response components occurred at 10, 120, 130, and 250 Hz; however, the SIs were lower: 0.19, 0.25, 0.35, and 0.22, respectively.
FIG. 3.
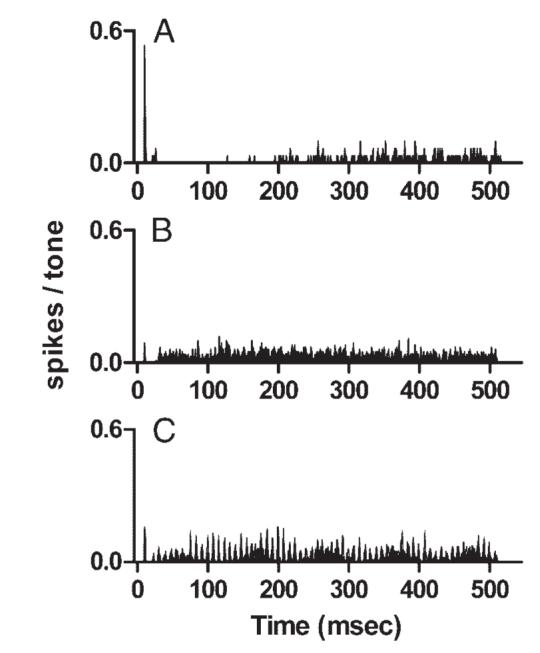
Discharge patterns of a representative pauser neuron. A: PST histogram of the responses to a 0.90-kHz, 60-dB SPL pure tone. Neuron 0312-5, CF = 0.90 kHz, threshold at CF = 20 dB SPL. B: PST histogram of the responses of the same neuron to the harmonictone described in Fig. 2B. C: PST histogram of the responses of the same neuron to the mistuned tone described in Fig. 2C.
Figure 4 presents comparable data obtained from a neuron with a slightly higher CF that exhibited transient responses to CF tones. In contrast to the previous examples, the transient neuron exhibited unpatterned responses that were similar for all three tones. Discharge rates for the complex tones were also lower than rates for CF tones at the same level, possibly because the additional components increased the inhibitory input to the neuron. This neuron did not exhibit statistically significant synchrony at any of the previously mentioned response frequencies for either complex tone.
FIG. 4.
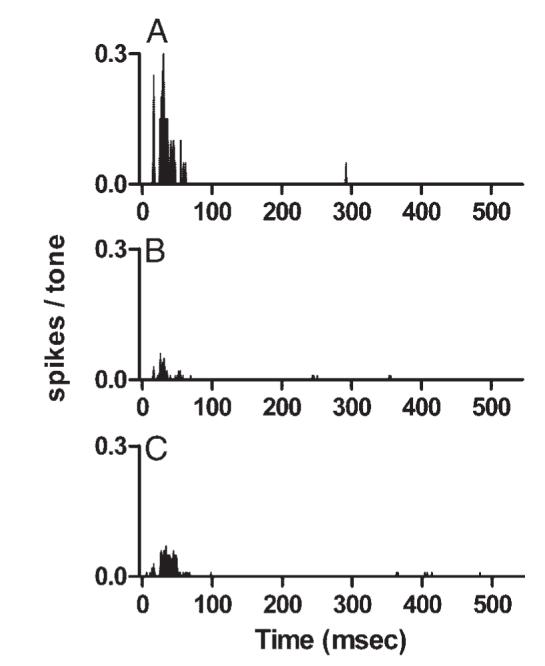
Discharge patterns of a representative transient neuron. A: PST histogram of the responses to a 0.70-kHz, 60-dB SPL pure tone. Neuron 0304-1, CF = 1.30 kHz, threshold at CF = 30 dB SPL. B: PST histogram of the responses of the same neuron to the harmonic tone described in Fig. 2B. C: PST histogram of the responses of the same neuronto the mistuned tone described in Fig. 2C.
Details of the temporal discharge patterns in response to the mistuned tone are more easily seen in Fig. 5, which displays a subset of the data shown in Figs. 2 and 3 as cycle histograms (Fig. 5, A-C) and response spectra (Fig. 5, D-F). The 200-ms histograms included two cycles of the slow modulation that was prominent in the stereotypical discharge pattern. A “response envelope” that included two maxima separated by 100 ms and fine structure consisting of peaks about every 8 ms can easily be seen in the response of the sustained neuron (Fig. 5A). The response of the pauser neuron included the same features, but the slow response modulation was much less deep in that case (Fig. 5B). The phase of the 10-Hz response envelope was also different; this characteristic of the temporal discharge patterns is discussed in more detail below. The overall discharge rate of the pauser neuron was also lower. Response components synchronized to 10, 120, and 130 Hz described previously can be seen in Fig. 5, D and E. For comparison, the cycle histogram and response spectrum obtained from the sustained neuron’s response to the harmonic tone are also shown (Fig. 5, C and F). As described above, discharge synchrony was observed only at 250 Hz in response to this stimulus.
FIG. 5.
Responses to mistuned and harmonic tones, replotted as cycle histograms and as response spectra. Note that the ordinate scale varies. A: responses of the sustained neuron to the mistuned tone. Same data that were shown as a PST histogram in Fig. 2C are replotted. B: responses of the pauser neuron to the mistuned tone. Data shown as a PST histogram in Fig. 3C are replotted. C: responses of the sustained neuron to the harmonic tone. Data shown in Fig. 2A are replotted. D: response spectrum, computed from the cycle histogram shown in A. Filled symbol at 250 Hz identifies f0 for the original harmonic tone. Open symbols identify the frequencies not present in the stimulus at which large components were observed in the responses to the mistuned tone. E: same as D, computed from the histogram in B. F: same as D, computed from the histogram in C.
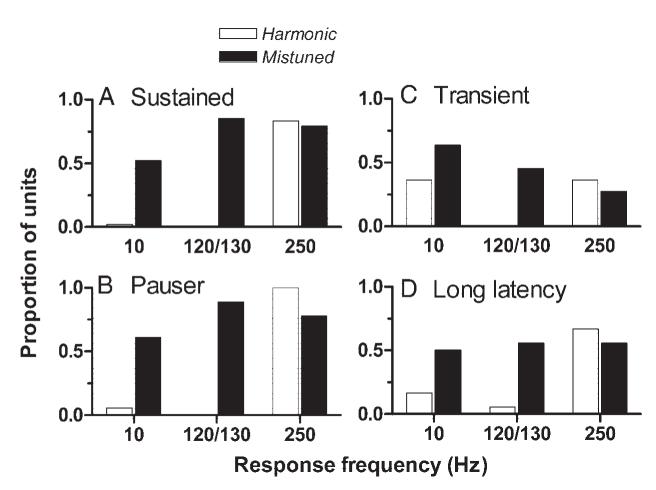
As noted, neurons that exhibited the stereotypical discharge pattern generally did so because their responses included components at 130, 120, and/or 10 Hz. To quantify the strength and prevalence of the stereotypical pattern, SIs for those frequencies were calculated for 480 cycle histograms obtained with harmonic tones and for a matched set of 480 cycle histograms obtained with mistuned tones. The proportion of neurons of different types that exhibited statistically significant synchronization at those frequencies and at 250 Hz is shown in Fig. 6. Two general trends can be identified in the figure. The first trend is a difference in synchronized responses across stimulus types. For harmonic tones, discharge synchrony was usually restricted to a single frequency: the fundamental frequency, 250 Hz. For mistuned tones, synchrony to 250 Hz continued to be observed, but synchrony to additional frequencies emerged. As noted, these frequencies were 10, or 120, and/or 130 Hz. The second trend is across categories of neurons. Synchrony was consistently observed in sustained and pauser neurons (the left column); for example, significant synchrony at 120 or 130 Hz was observed in 85 and 89% of all sustained and pauser neurons, respectively. In contrast, synchrony to those frequencies was less prevalent in transient and long-latency neurons. Neurons in these categories, and especially transient neurons, were also less likely to exhibit synchrony at 250 Hz. This was true whether the stimulus was a harmonic or a mistuned tone.
FIG. 6.
Patterns of discharge synchrony for harmonic and mistuned tones. A: each bar shows the proportion of neurons for which statistically significant discharge synchrony was observed at various frequencies. Proportions are shown separately for responses at 10, 120 or 130, and 250 Hz. A neuron was counted if it exhibited statistically significant synchrony at the indicated frequency for at least one stimulus condition. Filled bars: pattern across 48 sustained neurons in response to mistuned tones. Open bars: pattern across the same neurons in response to harmonic tones. B: same as A, from 18 pauser neurons. C: same as A, from 11 transient neurons. D: same as A, from 18 long-latency neurons.
Responses of neurons with different characteristic frequencies
Temporal discharge patterns that resembled the stereotypical pattern were observed in neurons with a range of CFs. Each panel in Fig. 7 presents the cycle histogram of responses from a different neuron to the same mistuned tone. The first 5 neurons (Fig. 7, A-E) were recorded from one animal and their CFs covered a range of 3.4 octaves, from 0.25 to 2.7 kHz. A variant of the stereotypical pattern was observed in each example. Consistent features of the response included the presence of peaks separated by 8 ms and a response envelope modulated with a period of 100 ms. The figure emphasizes the similarity of the discharge patterns across a broad range of CFs. The responses of neurons with CFs falling within a narrow range, sampled from different animals, would also be similar to one another. That is, there was no systematic dependency of the discharge pattern on CF.
FIG. 7.
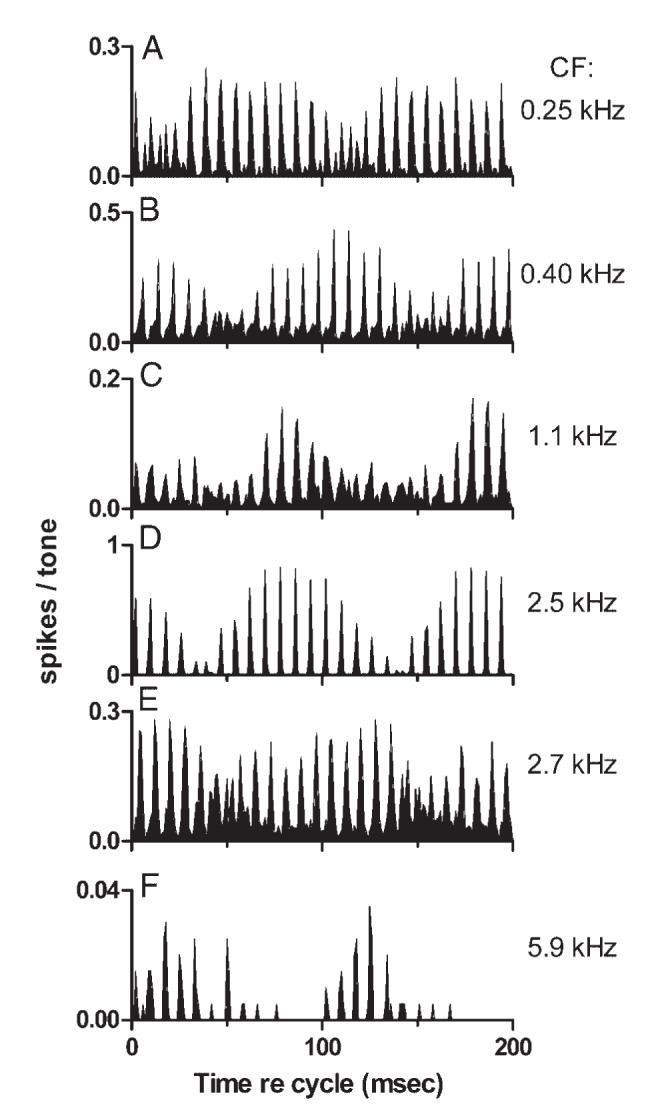
Cycle histograms of responses to sine-phase mistuned tones from neurons with different CFs. First 5 examples were recorded in the same animal. A: neuron 0418-5, sustained, CF = 0.25 kHz, stimulus level = 60 dB SPL per component. B: neuron 0418-1, pauser, CF = 0.40 kHz, stimulus level = 50 dB SPL per component. C: neuron 0418-9, sustained, CF = 1.10 kHz, stimulus level = 50 dB SPL per component. D: neuron 0418-12, transient, CF = 2.50 kHz, stimulus level = 50 dB SPL per component. E: neuron 0418-3, sustained, CF = 2.70 kHz, stimulus level = 60 dB SPL per component. F: neuron 0412-17 (from a different animal), transient, CF = 5.9 kHz, stimulus level = 60 dB SPL per component.
The features that most obviously varied across CF were the depth and shape of the response envelope. For example, the response envelope of the neuron in Fig. 7D was almost sinusoidal and its modulation depth approached 100%. For other neurons, e.g., Fig. 7, A and E, the envelope was less sinusoidal but the 100-ms periodicity was still apparent. Although the discharge patterns were similar across neurons, the position of the modulated response appeared to shift in time; that is, the phase of the response envelope varied across CF. This can be seen clearly inthe first two panels. In Fig. 7A, the largest discharge rate peaks occurred approximately between 40 and 90 ms of each 100-ms cycle. In Fig. 7B, the response envelope reached a minimum during that interval and the largest peaks occurred between about 80-130 ms; the two response envelopes were nearly one-half cycle out of phase with one another.
The stereotypical discharge pattern differed across neurons in one other way. In some responses, the response fine structure at envelope minima differed from the fine structure at the envelope maximum. In Fig. 7, this can be seen most clearly in the discharge pattern of the neuron with the lowest CF, 0.25 kHz (Fig. 7A). At envelope maxima, peaks in the PST histogram were separated by about 8 ms, as noted. At the envelope valley, the spacing of histogram peaks changed to 4 ms. The 4-ms spacing obviously corresponds to the period of f0, 1/250 Hz. For this low-CF neuron, that spacing could arise directly as a phase-locked response to the fundamental component of the stimulus. Similar patterns were observed in other higher-CF neurons not illustrated in this figure; in those cases, 4-ms periodicity would more likely arise from beating between adjacent tuned harmonics of the stimulus.
Figure 7F presents the responses of one additional neuron to the mistuned tone. This response is noteworthy because of the neuron’s high CF, 5.9 kHz. Although the discharge rate was extremely low, the stereotypical pattern was un-mistakable. Neurons with CFs >5.9 kHz were not studied, so it is not possible to say whether this CF represents the upper limit of the range over which the stereotypical pattern can be observed.
Effect of stimulus SPL
In general, in neurons that exhibited the stereotypical pattern, the pattern was preserved with changes in stimulus level. Exceptions occurred at levels near threshold, where responses typically exhibited no pattern, or no pattern that could be detected in the absence of large numbers of spikes. Examples are shown in Fig. 8, which presents cycle histograms obtained from one representative neuron at levels from 20 to 60 dB SPL per component. The cycle histograms were similar but not identical. The previously mentioned change in periodicity at the minimum of the response envelope can also be seen, especially at 40 dB SPL. However, the most obvious change was a shift in the phase of the response envelope, similar to the shifts observed across CFs in Fig. 7. The envelope shift could occur with little change in the underlying temporal discharge pattern, as illustrated in Fig. 9, for which the data shown in Fig. 8, B and E were reanalyzed and plotted on the same axes. For the reanalysis, the beginning of the analysis window for the histogram plotted as a dashed line was delayed by 35.2 ms. A cycle length of 100 ms was also used, in part to accommodate the change in analysis window and in part to allow the fine structure of the histogram to be seen more clearly in Fig. 9. The change in analysis times was derived from the difference in response envelope phase (REP) for the two cycle histograms. REP was defined as the phase of the 10-Hz component of the DFT of the cycle histogram. REP was calculated for each histogram, then the phase difference, 2.21 radians at 10 Hz, was converted into a delay in ms. The figure indicates that except for the time shift, the responses obtained at 30 and 60 dB SPL were quite similar, especially for the larger histogram peaks. Across all the levels shown in Fig. 8, the largest envelope time shift was 48 ms, approaching one-half of the modulation cycle (one-half cycle is the maximum possible shift if the direction is ignored). Shifts in REP of this magnitude were observed in many other units.
FIG. 8.
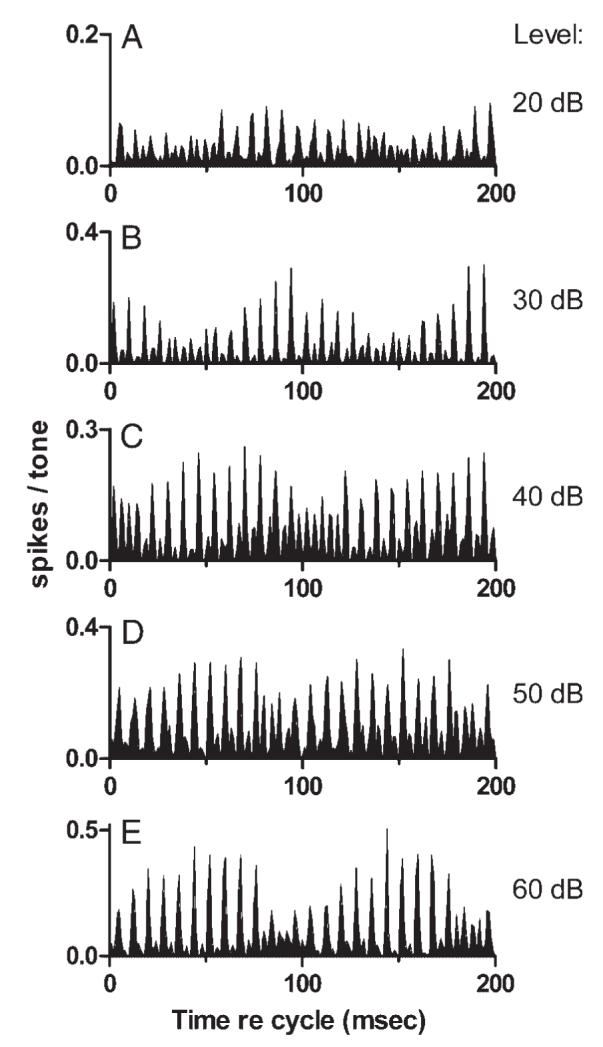
Cycle histograms of responses to sine-phase mistuned tones presented at different levels. Stimulus level increases in 10-dB steps from A (20 dB SPL per component) to E (60 dB SPL per component). Neuron 0410-12, sustained, CF = 2.3 kHz.
FIG. 9.
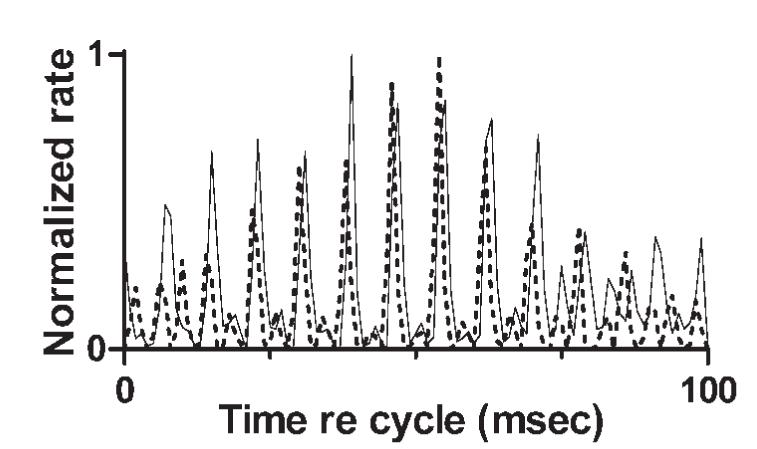
Time-shifted cycle histograms. Solid line: same data as in Fig. 8E, rebinned as a 100-ms cycle histogram. Dashed line: data from Fig. 8B, rebinned as a 100-ms cycle histogram for which the start of the analysis window was delayed by 35.2 ms. See Results Effect of stimulus SPL for complete details of the analysis.
Effects of component phase
In the previous study (Sinex et al. 2002b), each individual sine wave component in the complex tones was synthesized in sine phase. In the present study, the phases of individual components in the complex tones were varied, in part to determine whether the distinctive temporal pattern observed in many IC neurons occurred fortuitously as a result of the use of sine-phase stimuli. Responses of one neuron to mistuned tones synthesized with various component starting phases are shown in Fig. 10. The neuron exhibited the stereotypical temporal pattern for some but not all stimulus-phase conditions. Details of the discharge patterns varied with component phase, but the most obvious change was a shift in REP. The magnitude of the shift was comparable to the shifts seen across CF or across SPL in previous figures. The changes were large, but not obviously systematic or predictable, either within or across neurons. Varying the phases of stimulus components is likely to produce changes in the relative response latencies of neurons, but the changes cannot be larger than the period of the stimulus component(s) that elicit the responses, in the range 0.5 to 4 ms for the component frequencies used here. The way in which these small latency shifts could produce such large envelope changes is considered further in Output of the computational model compared with IC discharge patterns below.
FIG. 10.
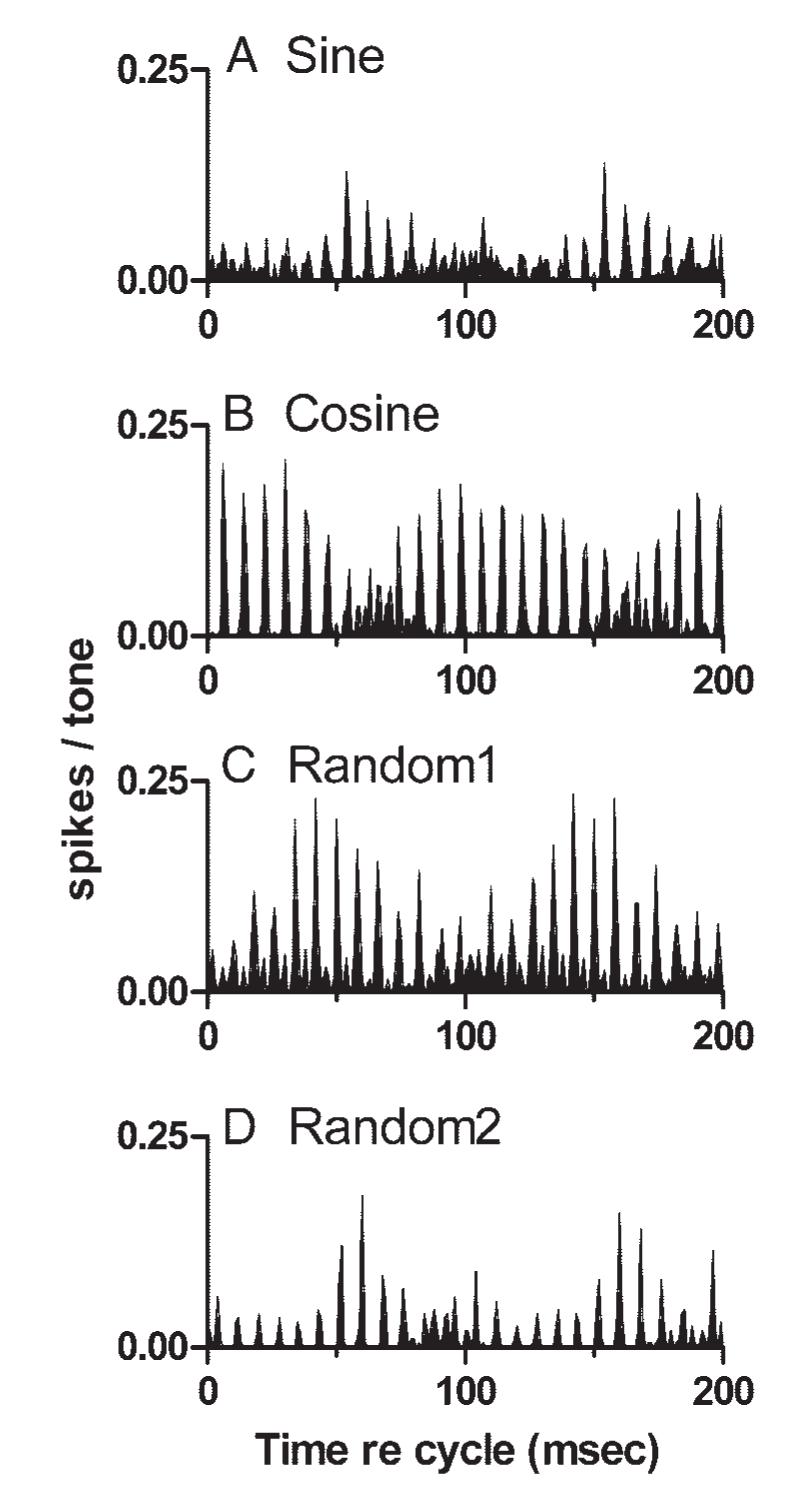
Effects of stimulus component phase on temporal discharge patterns. A: cycle histogram of responses to a sine-phase mistuned tone presented at 50 dB SPL per component. Neuron 0308-9, sustained, CF = 0.80 kHz. B: same as A, for the cosine phase stimulus. C: same as A, for one set of randomly chosen phases. D: same as A, for a different set of randomly chosen phases (designated Random2).
Changes in average discharge rate
The emphasis so far has been on changes in the temporal discharge pattern produced by mistuning. Mistuned tones also tended to evoke higher average discharge rates from IC neurons, compared with harmonic complex tones. An example of a large rate increase is shown in Fig. 11. The neuron’s response to pure tones at CF adapted over the first 100-200 ms of the 500-ms stimulus, and although a few sustained spikes did occur, the neuron met the definition for the transient category (Fig. 11A). The average response to a harmonic complex tone was larger, 41 spikes/s compared with 15 spikes/s for the CF tone, and discharge synchrony with the periodicity of f0 was apparent in the 4-ms spacing of peaks in the histogram (Fig. 11B). As in the response to the pure tone, adaptation occurred during the first 100-200 ms of the 500-ms tone. In contrast, the mistuned tone elicited a discharge rate of 95 spikes/s, an increase of more than a factor of 2 over the response to the harmonic tone and a factor of 6 over the response to a CF tone presented at the same SPL as the individual components of the complex tones (Fig. 11C). The rate increase was not simply a result of the higher overall SPL of the mistuned tone; the mistuned tone presented at 40 dB SPL per component, an overall level 1 dB below that of the pure tone that elicited the response in Fig. 11A, elicited a rate of 49 spikes/s (Fig. 11D). Another effect of mistuning wasthat the magnitude of the response to the mistuned tone showed no sign of adapting over time. In conjunction with the rate increases, clear examples of the stereotypical temporal pattern also emerged.
FIG. 11.
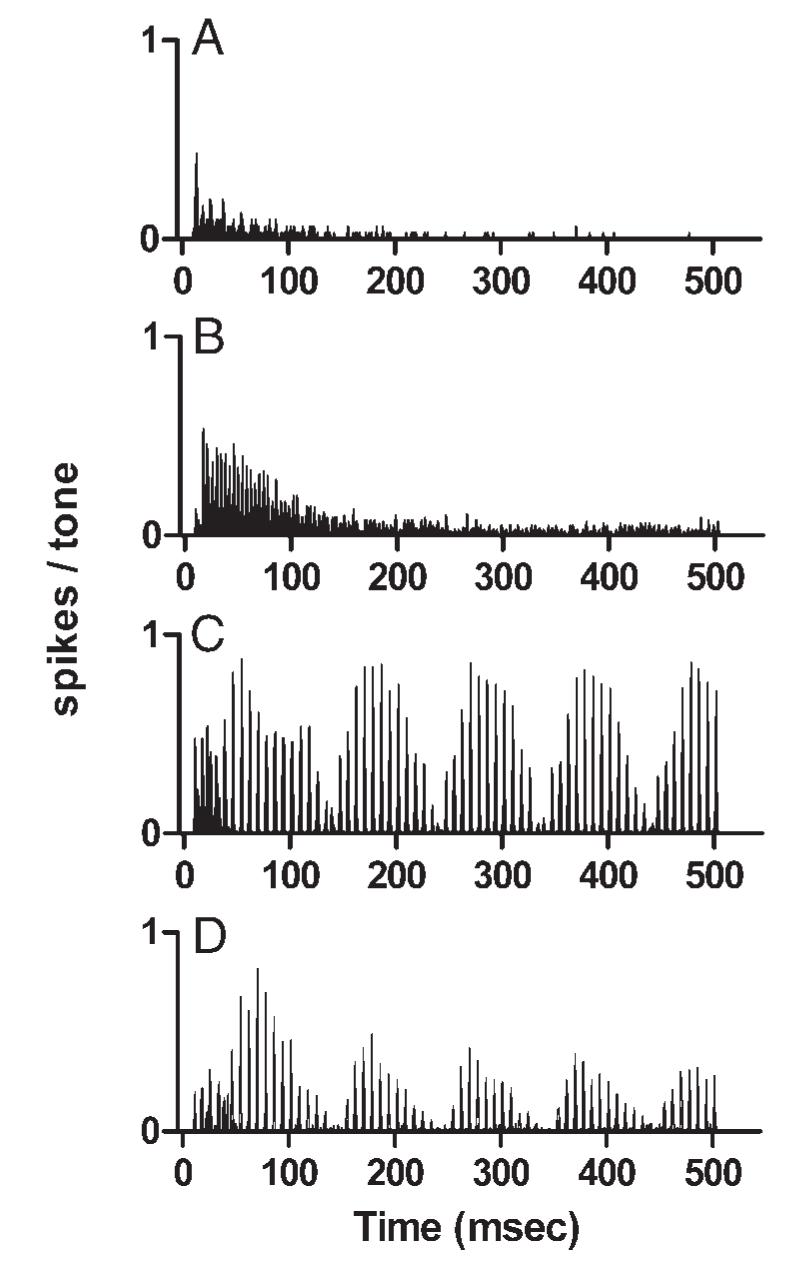
Effect of mistuning on discharge rate. A: PST histogram of the responses of a transient neuron to a 2.50-kHz, 50-dB SPL pure tone. Neuron 0418-12, CF = 2.50 kHz, threshold at CF = 20 dB SPL. B: PST histogram of the responses of the same neuron to the harmonic tone presented at 50 dB SPL per component. Peaks separated by 4 ms, indicating synchrony to 250 Hz, can be seen. C: PST histogram of the responses of the same neuron to the mistuned tone presented at 50 dB SPL per component. D: PST histogram of the responses of the same neuron to the mistuned tone presented at 40 dB SPL per component, an overall level of 49 dB SPL.
Component phase could also affect discharge rate, as could be seen in the individual examples in Fig. 10. More information is provided in Fig. 12. Sine- (Fig. 12A) and cosine-phase (Fig. 12B) stimuli elicited responses with essentially the same REP and fine structure, but for this particular neuron, the discharge rate for the cosine-phase stimulus was nearly twice as high. Figure 12C indicates that for this neuron, the highest discharge rates were elicited by mistuned tones with cosine phase or with one set of randomly chosen phases. Mistuned tones synthesized with a different set of randomly chosen phases elicited lower rates. For harmonic tones, a dependency of discharge rate on component starting phase was also observed, but in this case cosine-phase tones elicited the lowest rates (Fig. 12D). Phase-related differences in discharge rate were common, but the particular phase conditions that elicited higher rates varied across neurons with no discernable pattern. For example, in the responses of 25 neurons for which responses to three phase conditions were obtained at 60 dB SPL, sine-phase tones elicited the highest discharge rate from 11 neurons, cosine-phase tones elicited the highest discharge rate from five neurons, and random-phase tones elicited the highest discharge rate from nine neurons.
FIG. 12.
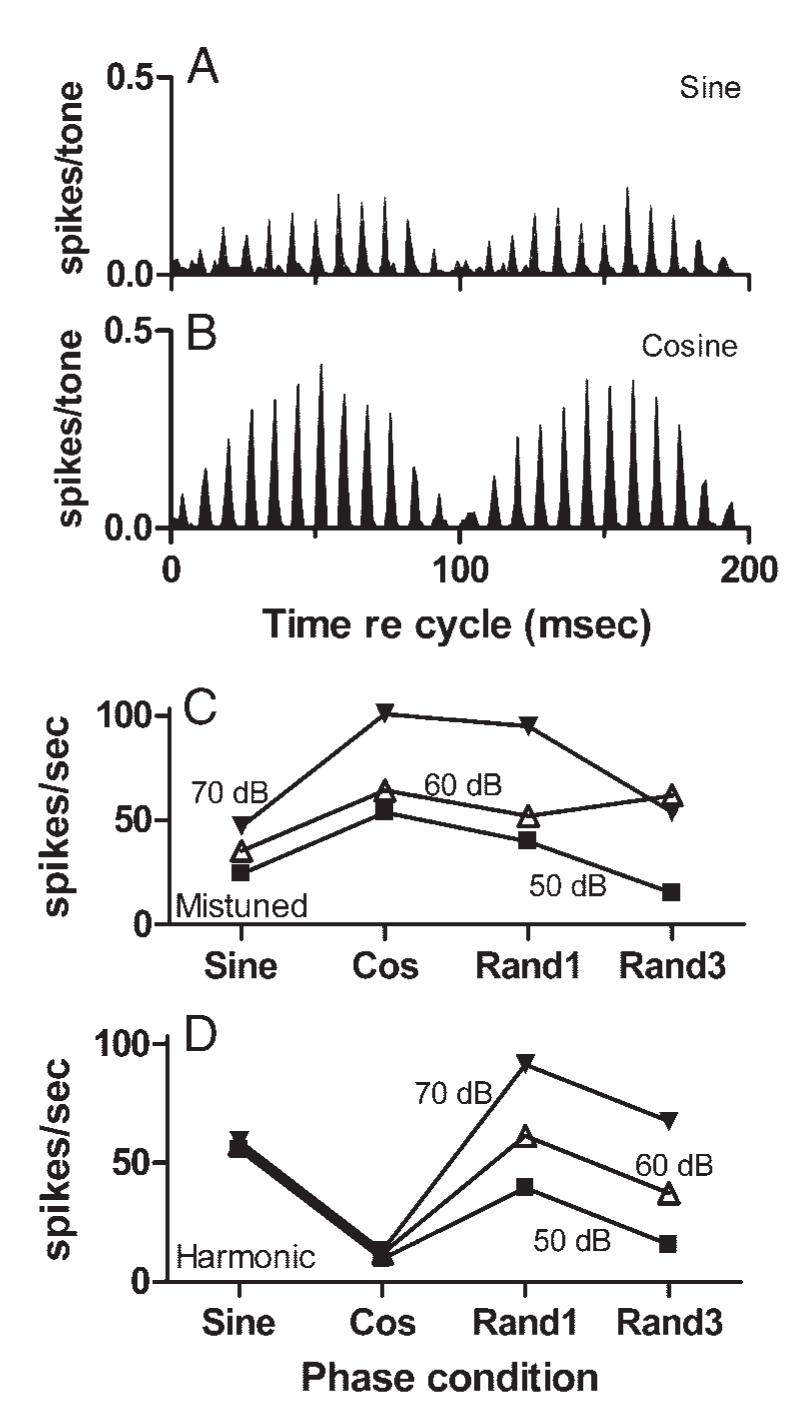
Effect of stimulus component phase on discharge rate. A: cycle histogram of responses to a sine-phase mistuned tone presented at 60 dB SPL per component. Neuron 0402-4, sustained, CF = 1.20 kHz, threshold at CF = 40 dB SPL. B: same as A for the cosine-phase mistuned tone. C: change in discharge rate with component phase for mistuned tones. Label “Rand1” refers to the set of randomly chosen phases that was used most often. “Rand3” refers to a set of randomly chosen phases different from that, and also different from Random2 mentioned in Fig. 10. D: same as C for harmonic tones.
Summaries of the effect of mistuning on average discharge rate are shown in Fig. 13. In the scatterplots, each point compares the discharge rate elicited from one neuron by a harmonic tone to the rate elicited by the corresponding mistuned tone, all other stimulus parameters being equal. Panels in the left column (Fig. 13, A-C) compare rates elicited by complex tones with various component phases, collapsed across SPL. Figure 13, D and E in the right column compares rates elicited by tones at constant SPL, collapsed across phase conditions. In every comparison, the trend was that mistuned tones generated more spikes than the matching harmonic tones. Figure 13F illustrates the mean change in rate as a result of mistuning for neurons sorted by PST type. For neurons except those with long latencies, mistuned tones exhibited slightly higher rates. Across all conditions, the mistuned tone elicited a higher discharge rate than the matched harmonic tone in 291 of 480 comparisons (61%). In 102 of 491 comparisons (21%), the rate increase was ≥10 spikes/s. Mistuning led to a rate decrease of ≥10 spikes/s in only 42 cases (9%). Although the increases produced by mistuning were small, they were statistically significant (Wilcoxon signed-rank test, n = 480 pairs, P < 0.0001).
FIG. 13.
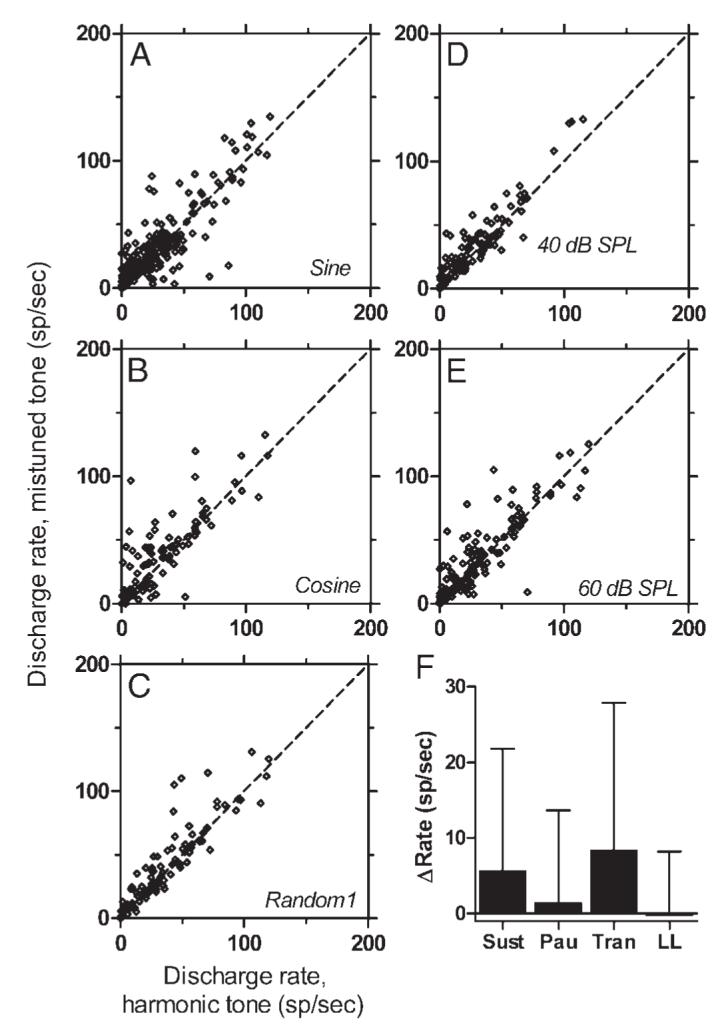
Summary of the effect of mistuning on average discharge rate. Each point compares the average discharge rate elicited by a harmonic tone to the rate elicited by a mistuned tone for which all other parameters matched those of the harmonic tone. Points falling above the diagonal (dashed line) indicate higher rates for the mistuned tone. A: comparison of 260 data sets obtained with sine-phase tones; SPL varied. B: comparison of 96 data sets obtained with cosine-phase tones; SPL varied. C: comparison of 97 data sets obtained with random-phase tones; SPL varied. D: comparison of 106 data sets obtained with tones presented at 40 dB SPL per component; component phase varied. E: comparison of 142 data sets obtained with tones presented at 60 dB SPL per component; component phase varied. F: mean change in rate as a result of mistuning for neurons sorted by PST type. Positive numbers indicate that rate increased as a result of mistuning, and the error bars are SDs. “Sust”: 257 data sets from 48 sustained neurons. “Pau”: 91 data sets from 17 pauser neurons. “Tran”: 31 data sets from 11 transient neurons. “LL“: 101 data sets from 18 long-latency neurons.
Binaural stimulation
As noted, tones were nearly always presented monaurally to the contralateral ear, but exceptions were made for neurons that responded poorly to monaural stimuli but vigorously to binaural tones. Binaural complex tones were presented to five neurons, and responses were obtained for a total of 24 phase and SPL conditions. Although only a few examples were collected, there was no indication in those data that responses elicited with binaural stimulus presentation differed in any significant way from responses to monaural contralateral tones. One representative binaural discharge pattern is presented in Fig. 14. Figure 14, A and C (top row) presents cycle histograms of the responses obtained with binaural stimulation. The temporal discharge pattern obtained in response to the harmonic tone exhibited particularly strong synchrony at 250 Hz; because of the neuron’s low CF, this pattern could reflect synchrony to the 250-Hz component in the stimulus or to the envelope. The response to the mistuned tone exhibited the features described previously for contralateral stimulation: the response envelope modulated with a 100-ms period, and fine structure consisting largely of peaks separated by 8 ms. As in some previous examples, this neuron also exhibited the temporal pattern associated with f0 during minima in the response envelope. Responses to monaural contralateral tones are illustrated in Fig. 14, B and D. These tones generated only a few spikes, and no temporal pattern could possibly be detected.
FIG. 14.
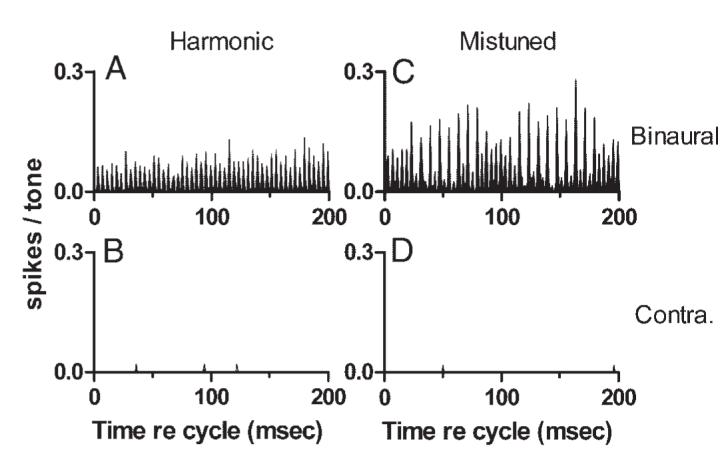
Examples of discharge patterns obtained with binaural stimulus presentation. Neuron 0411-11, pauser (for binaural tones), CF = 0.40 kHz, threshold at CF = 20 dB SPL (binaural). A: cycle histogram of responses to the sine-phase harmonic tone presented with an interaural time difference of 0.2 ms (contralateral ear leading), 60 dB SPL per component. B: same as A, for the mistuned tone. C: cycle histogram of responses to the sine-phase harmonic tone presented monaurally to the contralateral ear, 60 dB SPL per component. D: same as C for the mistuned tone.
Output of the computational model compared with IC discharge patterns
As noted, the same stimuli were presented to a computational model incorporating three sequential processing stages. Figure 15 illustrates the outputs of channels from all three stages of themodel in response to the sine-phase mistuned-tone stimulus. This simulation included channels with two CFs, 1.242 and 2.089 kHz. The higher CF closely matched the CF of the IC neuron whose discharge pattern is included in D of the figure. At Stage 1 (Fig. 15A), the output of each channel was simply a band-pass-filtered, half-wave-rectified version of the stimulus waveform. Neither channel was able to resolve individual components of the spectrum of the complex tone, resulting in a response with a modulated envelope whose frequency was determined by the spacing between the unresolved components. For the channel with the lower CF, the largest unresolved components were at 1.120 kHz (the mistuned component) and 1.250 kHz (the next-higher unmodified harmonic), and the response waveform had a beat or envelope frequency of 130 Hz. Response modulation with a period of 100 ms can also be seen, but that modulation was quite shallow. For the higher-CF channel, the unresolved components were at 1.750 and 2.000 kHz, resulting in an envelope frequency of 250 Hz. Each Stage 1 output also exhibited fine structure determined by the frequencies passed by the gammatone filter; individual cycles of the fine structure were too short to be visible in the figure. The modulation and fine structure observed in Stage 1 outputs generally reproduced the characteristics of auditory nerve fiber responses to similar mistuned tones reported by Sinex et al. (2003a).
FIG. 15.
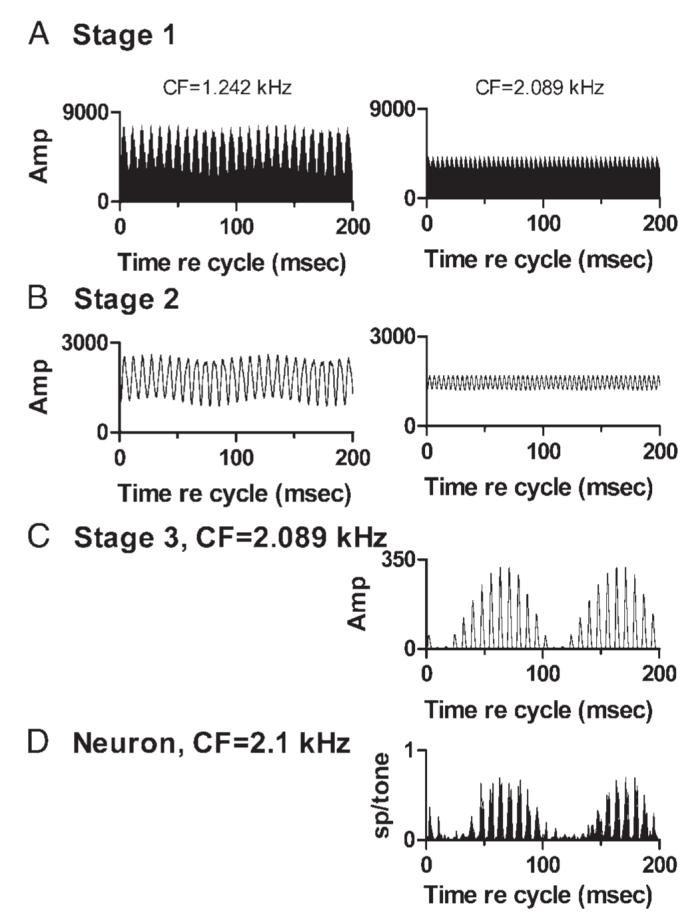
Model outputs at different CFs and processing stages, in response to the sine-phase mistuned tone stimulus. A: outputs of two Stage 1 channels with CFs of 1.242 and 2.089 kHz. These and other similar plots show a 200-ms segment of the channel’s output waveform. Amplitude scale is arbitrary; amplitudes can be compared within a stage but not across stages. B: outputs of two Stage 2 channels with the same CFs as the Stage 1 channels in B. C: output of a Stage 3 channel that received input from the Stage 2 channels shown in B. Higher CF input was excitatory; lower CF was inhibitory, with weight = -1.15. D: discharge pattern of a representative IC neuron to the mistuned tone. Response is shown as a 200-ms cycle histogram, for comparison to the 200-ms segments of the responses of model channels. Neuron 9908-1, CF = 2.1 kHz, which closely matched the CF of the channels in the right column of A-C.
At Stage 2 (Fig. 15B), additional low-pass filtering removed the fine structure but left the envelopes. As noted above, the envelope frequency was 130 Hz (plus the small 10-Hz componentalso seen in Stage 1) for the lower-CF channel, and 250 Hz for the higher-CF channel.
At Stage 3 (Fig. 15C), the outputs originating in the two separate Stage 2 channels were summed. For this example, the channel with CF = 2.089 kHz provided excitatory input and the channel with CF = 1.242 kHz provided inhibition. The weight of the inhibitory input was set to 1.15, a value chosen empirically to produce a waveform whose shape closely approximated the discharge pattern of the neuron shown in D. The match between the discharge pattern of the IC neuron and the output of model Stage 3 was quite good, even though none of the waveforms generated at Stages 1 or 2 bore much resemblance to the neuron’s response.
Stage 3 outputs that resembled the stereotypical discharge patterns of IC neurons to mistuned tones could be achieved with many different parameter sets. The examples shown in Fig. 16 were all produced by integrating across two channels, one of excitation and one of inhibition. In Fig. 16, A-C, the excitatory CF was held constant at 1.242 kHz. The waveform of Stage 2 output for that CF was dominated by a 130-Hz envelope, as was shown in Fig. 15B. The CF of the inhibitory channel was varied, as was the weight of the inhibitory input. Similar but not identical Stage 3 outputs could be generated with inhibitory inputs originating in different frequency regions and, in each case, the stereotypical modulated response was obtained. The similarity in Stage 3 outputs reflected the fact that the waveforms of these Stage 2 outputs were not strongly affected by the variation in inhibitory CF because in each case the response envelope was produced by beating between adjacent tuned harmonics. Although the particular harmonics varied with CF, the frequency difference was always 250 Hz, producing a response envelope modulated with 4-ms periodicity.
FIG. 16.
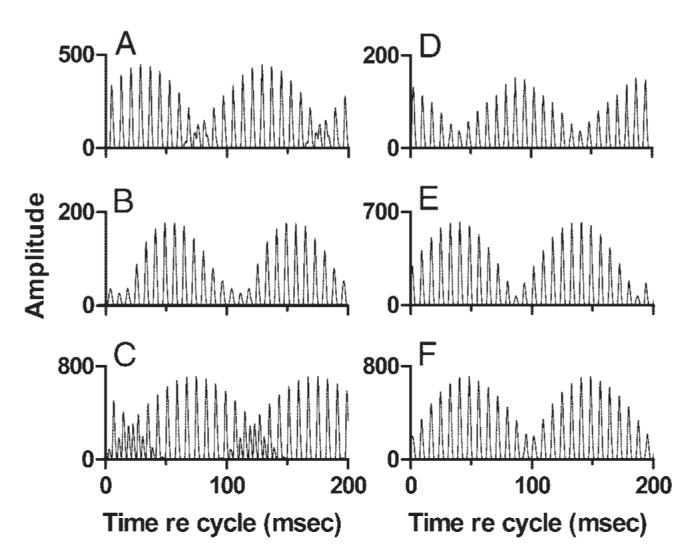
Effect of input frequency. Each panel shows the output of a Stage 3 channel receiving one excitatory and one inhibitory input. Stimulus: sine-phase mistuned tone. Left column: CF of the excitatory input was fixed at 1.242 kHz; CF of the inhibitory channel varied over a range of 1.2 octaves (oct), and included values greater than and less than the CF of the excitatory input. A: CF of the inhibitory Stage 2 channel = 0.677 kHz, weight = -3.1. B: CF of the inhibitory Stage 2 channel = 1.139 kHz, weight = -1.1. C: CF of the inhibitory Stage 2 channel = 1.611 kHz, weight = -2.0. Right column: CF of the inhibitory input was fixed at 1.139 kHz, and CF of the excitatory channel varied over a range of 1.6 oct, including CFs greater than and less than that of the inhibitory input. D: CF of the excitatory Stage 2 channel = 0.677 kHz, weight of the inhibitory channel = 0.6. E: CF of the excitatory Stage 2 channel = 1.477 kHz, weight of the inhibitory channel = -1.3. F: CF of the excitatory Stage 2 channel = 2.000 kHz, weight of the inhibitory channel = -1.3.
The major difference across the individual examples in Fig. 16 was that the waveform appeared to shift in time as the CF of the inhibitory input was changed. As noted in Effect of stimulus SPL above, shifts of this kind, referred to as shifts in REP, were observed in the responses of many IC neurons and attributed to slight shifts in the latencies of the inputs to the IC. In these modeling results, the latencies of Stage 1 outputs decreased with increases in CF, as is the case with real peripheral neurons, and a change in the latency of the response to one channel relative to the others could account for the observed shift in REP. A more direct demonstration of the effect of latency on REP is presented below.
One other difference across the examples in Fig. 16 was that the fine structure of the Stage 3 waveform could change during envelope minima. In Fig. 16C, the spacing between waveform peaks changed from about 8 ms around the maximum of the envelope, to about 4 ms at the envelope minimum. In Fig. 16, A and B, the periodicity did not change. Both of these patterns were observed in the responses of IC neurons (e.g., Fig. 7).
In the examples shown in Fig. 16, D-F, the CF of inhibition was fixed and the CF of excitation was varied; the weight of inhibition was also allowed to vary to achieve a match to the stereotypical pattern. As before, similar output waveforms could be obtained for each pair of input channels and, as before, the major effect of varying the excitatory CF was a shift in REP.
The effects of varying temporal stimulus parameters are examined in Fig. 17. The phases of individual components in the mistuned tone were varied for the simulations shown in Fig. 17, A-C. Parameters of the model were held constant across the three stimulus conditions in the figure. Varying the component phase had little effect on the fine structure of the Stage 3 response. Model responses to sine- and cosine-phase stimuli were similar, except for a small difference in overall amplitude. For the random-phase condition, a shift in REP of nearly half a modulation cycle was observed, analogous to the effects of component phase seen in the responses of IC neurons (Fig. 10).
FIG. 17.
Effects of varying temporal stimulus parameters. Right column: effect of stimulus componentphase. Each simulation was done with two Stage 2 inputs, an excitatory input at 1.834 kHz, and an inhibitory input with CF = 1.139 kHz, weight = -1.1. A: sine-phase stimulus. B: cosine-phase stimulus. C: random phase stimulus, phase set 1. Left column: effect of small time shifts on REP at Stage 3. Each simulation was done with two Stage 2 inputs, an excitatory input at 1.477 kHz, and an inhibitory input with CF = 1.139 kHz, weight = -1.3. Sine-phase stimulus. A: original simulation. B: Stage 3 output after a 1-ms delay was imposed at the output of the Stage 1 channel with CF = 1.477 kHz. All other stimulus and model parameters were the same as in A. C: same as B, with a 2-ms delay imposed at Stage 1.
It was suggested in Effects of component phase above that small shifts in the latencies of neurons in the periphery and/or lower brain stem could produce large shifts in REP while preserving the general shape and fine structure of the stereotypical IC discharge pattern. This hypothesis was tested in the model by fixing the CFs and weights of two input channels, then systematically delaying one Stage 1 output to simulate an increase in relative response latency. The result is shown in Fig. 17, D-F, where D shows the original simulation, done with an excitatory channel at 1.477 kHz receiving one inhibitory input at 1.139 kHz. The output of the lower-CF Stage 1 channel was delayed by 1 ms in Fig. 17E and 2 ms in Fig. 17F, to simulate an increase in relative latency. The envelope of the Stage 3 output waveform shifted systematically, by about 25 ms per 1-ms increase in Stage 1 latency. Introducing artificial delays at Stage 2 rather than Stage 1 produced identical results. As was hypothesized to be the case for IC neurons, a small, physiologically realistic change in the relative latency across input channels at anearly processing stage led to a large REP shift at Stage 3.
DISCUSSION
The previous study of IC responses (Sinex et al. 2002b) examined the representation of a wide range of mistuned tones. This study focused on the representation of one particular mistuned tone by neurons with different pure-tone response properties, to establish the prevalence of the so-called stereotypical discharge pattern. One clear finding was that the discharge patterns elicitedby that mistuned tone were similar across neurons and in the face of stimulus manipulations other than mistuning that produce little or no change in perception. For the particular mistuned tone used in this study, the stereotypical pattern was characterized by peaks in the PST histogram separated by about 8 ms, and a response envelope that was modulated with a period of 100 ms. The phase of that slow modulation varied, but other aspects of the temporal pattern were conserved across CF and across neurons that differed in their pure-tone response properties. Sinex et al. (2002b) suggested that this distinctive pattern was produced by responses with periodicities of 130 and 120 Hz. The 8-ms spacing of histogram peaks is directly attributable to those frequencies, and beating between those frequencies accounts for the slow, 10-Hz modulation.
As noted above and in Sinex et al. (2002b), a 130-Hz input could easily be produced by beating between responses synchronized to the mistuned fourth harmonic and the fifth harmonic in the stimulus used here. That is, a hypothetical neuron receiving two excitatory inputs, one synchronized to 1.120 kHz and another synchronized to 1.250 kHz, would be more likely to produce spikes when the two inputs were in phase, and less likely to produce spikes when the two inputs were out of phase, each phase relation occurring 130 times/s. In the same way, beating between any two exact harmonics would produce a response synchronized to f0, in this case 250 Hz. Second-order beats, between inputs locked to 130 and 250 Hz, would occur at 120 Hz. The computational model was used to evaluate hypotheses about the kind of mechanisms that could produce and integrate inputs at those two frequencies. These are considered further in Integrative mechanisms that produce the stereotypical discharge pattern below.
Responses across neurons
With modest variation, the stereotypical pattern was observed in neurons with different pure-tone discharge patterns and with CFs as low as 0.25 kHz and as high as 5.9 kHz. Neurons that responded to pure tones with sustained or pauser discharge patterns were most likely to exhibit the stereotypical discharge pattern. In general, sustained neurons exhibited the most highly modulated patterns. Exceptions were observed in neurons with long latencies, even if they responded in a sustained manner to other tones. Neurons with pauser discharge patterns generally exhibited a recognizable temporal pattern in response to mistuned tones. The responses of pauser neurons exhibited the 8-ms periodicity that was part of the stereotypical pattern, but they tended to exhibit less-prominent slow modulation than the responses of sustained neurons. Neurons that exhibited transient responses to pure tones generally responded poorly to complex tones, although there were exceptions (e.g., Fig. 11). In addition, the temporal discharge patterns of these neurons to mistuned tones included the 120- and 130-Hz components that distinguished them from responses to harmonic tones in fewer than half of the tested conditions (Fig. 6C). Sinex et al. (2002a) previously reported that transient neurons in the IC of the chinchilla responded poorly to sinusoidally amplitude modulated (SAM) tones. As noted above, the stereotypical pattern is interpreted to be a response that results from integration of inputs slowly modulated at two different frequencies. Responses to harmonic tones also appeared to reflect beating inputs; in that case, the beats occurred ata single frequency, equal to f0. The present results are consistent with the results of Sinex et al. (2002a), which suggest that harmonic and mistuned tones should not be effective stimuli for transient neurons.
Mistuned tones would not have evoked such similar discharge patterns from neurons with widely varying CFs if each neuron were processing only a restricted region of the spectrum, which is what the typical narrow excitatory tuning of IC neurons (and auditory neurons in general) implies. Sharply tuned neurons may receive broadband inhibition (LeBeau et al. 2001; Li et al. 2002) and, for many neurons in this study, pure tones an octave or more from CF were capable of inhibiting responses at CF. In addition, Li et al. (2002) reported that inhibition originating at frequencies remote from CF preserves the temporal pattern of the eliciting stimulus. Patterned inhibitory input appears to be critically important for producing the distinctive modulated discharge patterns observed in the present study, and the results presented here, showing similar discharge patterns evoked by the same complex stimulus across a range of CFs, may suggest an important functional role for that inhibition. This unusual result can be accounted for if it is assumed that individual IC neurons receive excitatory input that reflects two or more components of the complex tones, and patterned inhibitory input that reflects two or more components from a different part of the spectrum. This view is explained in greater detail in Integrative mechanisms that produce the stereotypical discharge pattern.
Shifts in response envelope phase
Similar discharge patterns could be elicited over at least a 40-dB range of levels, and by stimuli in which the phases of individual stimulus components were varied. In each case, the most obvious difference in discharge patterns was a shift in the phase of the modulated response envelope. Shifts of nearly one-half a modulation cycle, ≤50 ms in time, were common. These shifts accompanied stimulus changes that had little or no effect on the ability of listeners to identify the mistuned component as a separate sound. For example, Hartmann (2004) reported that, although the detectability of a mistuned component was a nonmonotonic function of level, performance was relatively consistent within the range of levels most often used in the present study. We interpret this to mean that envelope phase is not useful for conveying information about the stimulus. However, it may be useful as an indicator of the integrative mechanisms that produce the observed discharge patterns.
It is likely that large shifts in the response envelope originate in smaller latency or phase shifts in the responses of neurons that provide direct or indirect input to the IC. Support for this possibility was obtained from simulated responses, which confirmed that fixed time delays on the order of 1-2 ms added to one Stage 1 input produced much larger shifts in Stage 3 REP. For pure tones, the first-spike latency of many auditory neurons decreases with increases in SPL (auditory nerve: Heil and Irvine 1997; Liberman 1978; Siegel et al. 1982; cochlear nucleus: Kitzes et al. 1978; Winter and Palmer 1995; Young et al. 1988; IC: Nuding et al. 1999; Semple and Kitzes 1985). The latencies of later-occurring spikes are usually not discussed, and in the absence of sustained phase-locked discharges cannot be related to the stimulus as easily as the first spike can. The phases of auditory-nerve fiber discharges to CF tones are relatively stable with changes in level (Kiang 1965; Rose et al. 1967). However, for tones away from CF, systematic phase changes occur with level (Anderson et al. 1971) and, for brain stem neurons that do not exhibit pronounced phase-locking, it is at least plausible to assume that a shift in first-spike latency will be reflected in the timing of later spikes. Thus a given change in stimulus SPL can easily produce differential changes in the response latencies neurons providing input to a particular IC neuron; recruitment of new neurons into the responding population would also amount to a change in input phases. In either case, a shift in REP would occur. Similarly, a shift in stimulus phase would also shift the latencies of synchronized spikes; for example, a shift of one-half cycle at 1 kHz would be expected to produce latency shifts of, on the average, 0.5 ms. These latency changes, of a few milliseconds or less, could produce shifts on the order of 50 ms in the envelope of the response to the mistuned tone, if that envelope was produced by beating between phase-locked inputs as is suggested here. The effect on the IC response envelope would be essentially the same, whether the shifts arose from changes in the phases of stimulus components or changes in stimulus SPL, as was observed in the data.
Response fine structure
Most of the discussion has focused on the envelope of the responses of IC neurons to mistuned tones. This is because the existence of the response envelope and the way stimulus manipulations change the response envelope appear to provide clues to the integrative mechanisms that affect the representation of mistuned tones. However, as noted in the previous section, because the phase ofthis envelope was not preserved across neurons or stimulus manipulations, it may not be particularly useful for conveying information about the stimulus.
Harmonic and mistuned tones also elicited a stereotypical fine structure from IC neurons, which may be even more important for conveying information about harmonic structure that can be used for perceptual segregation. For harmonic tones, response fine structure, if there was any, was consistent; the periodicity matched the 250-Hz fundamental period of the complex tone as can be seen in Figs. 5C, 11B, and Fig 14A (although the latter is an example of a binaural response, it is representative of other neurons’ monaural responses to the same stimulus, and the periodicity is easier to see in the cycle histogram). For mistuned tones, the fine structure was dominated by the periodicity produced by interactions between the mistuned component and the next-higher harmonic, although response components at 250 Hz remained. For the tone used here, the stimulus components that accounted for the change in temporal pattern were at 1.120 and 1.250 kHz, resulting in an envelope with a frequency of 130 Hz. Response components at this difference frequency largely accounted for the discharge-rate peaks that occurred approximately every 8 ms. As noted above, this component and another at 120 Hz dominated the responses of IC neurons with CFs near the actual stimulus components that produced the beats. What is especially interesting is that the same components also dominated the responses of IC neurons with other CFs.
It is tempting to conclude that the appearance of additional components in the temporal discharge pattern somehow signals the presence of a stimulus component that is not part of the original harmonic series. Although mistuning led to new response components in a widely distributed population of neurons, it did not eliminate responses whose temporal pattern reflected the fundamental frequency of the original harmonic tone. Response components at 250 Hz persisted, as indicated by DFT analysis, and as noted in Figs. 7A, 8C, and Fig 14C, responses to mistuned tones could exhibit the fine structure associated with the mistuned tones during envelope maxima and the fine structure associated with the harmonic tone during envelope minima. That alternating pattern raises the possibility that information about two simultaneous sound sources could be conveyed by individual neurons by a form of multiplexing.
Integrative mechanisms that produce the stereotypical discharge pattern
As noted in several places above, the working assumption is that the stereotypical pattern produced by mistuning of the tone used in this study reflects the interaction between spike trains synchronized to beat frequencies produced by adjacent spectral components in the stimulus. The assumption is usually stated as if the interaction occurs locally at the level of the IC, but of course it could occur at any level (or at more than one level) between the auditory nerve and the IC. As part of this project, a computational model that incorporates this view of integrative processing was developed and used to evaluate these assumptions in a more quantitative way. For the mistuned tone used here, the most important beat frequencies are 130 Hz for model channels with CFs near the mistuned component and 250 Hz in all other CF regions. The output of the IC stage reflects the difference between the envelope frequencies present in the second stage. An additional key feature of the model is that IC neurons are assumed to receive inhibitory inputs from input neurons tuned to a broad range of frequencies. With suitable parameter values, the model successfully accounted for the temporal discharge patterns observed in IC neurons, for the mistuned tones used here, and for other mistuned stimuli used in the previous study (Sinex et al. 2002b). The success of the model suggests that the model’s components might have counterparts in the circuitry and integrative processing actually occurring in the lower brain stem and IC. The model makes predictions about that processing that can be tested directly in future experiments.
ACKNOWLEDGMENTS
The authors thank Dr. Russell Snyder for comments on a draft of the manuscript.
GRANTS
This work was supported by Institute on Deafness and Other Communication Disorders Grant DC-00341 to D. G. Sinex.
Footnotes
The costs of publication of this article were defrayed in part by the payment of page charges. The article must therefore be hereby marked “advertisement” in accordance with 18U.S.C. Section 1734 solely to indicate this fact.
REFERENCES
- Anderson DJ, Rose JE, Hind JE, Brugge JF. Temporal position of discharges in single auditory nerve fibers within the cycle of a sine-wave stimulus: frequency and intensity effects. J Acoust Soc Am. 1971;49:1131–1139. doi: 10.1121/1.1912474. [DOI] [PubMed] [Google Scholar]
- Borisyuk A, Semple MN, Rinzel J. Adaptation and inhibition underlie responses to time-varying interaural phase cues in a model of inferior colliculus neurons. J Neurophysiol. 2002;88:2134–2146. doi: 10.1152/jn.2002.88.4.2134. [DOI] [PubMed] [Google Scholar]
- Bregman AS. Auditory Scene Analysis. MIT Press; Cambridge, MA: 1990. [Google Scholar]
- Burger RM, Pollak GD. Reversible inactivation of the dorsal nucleus of the lateral lemniscus reveals its role in the processing of multiple sound sources in the inferior colliculus of bats. J Neurosci. 2001;21:4830–4843. doi: 10.1523/JNEUROSCI.21-13-04830.2001. [DOI] [PMC free article] [PubMed] [Google Scholar]
- Cai H, Carney LH, Colburn HS. A model for binaural response properties of inferior colliculus neurons. I. A model with interaural time difference-sensitive excitatory and inhibitory inputs. J Acoust Soc Am. 1998a;103:475–493. doi: 10.1121/1.421100. [DOI] [PubMed] [Google Scholar]
- Cai H, Carney LH, Colburn HS. A model for binaural response properties of inferior colliculus neurons. II. A model with interaural time difference-sensitive excitatory and inhibitory inputs and an adaptation mechanism. J Acoust Soc Am. 1998b;103:494–506. doi: 10.1121/1.421130. [DOI] [PubMed] [Google Scholar]
- Darwin CJ, Carlyon RP. Auditory grouping. In: Moore BC, editor. Hearing. Academic Press; San Diego, CA: 1995. pp. 387–424. [Google Scholar]
- Hartmann WM. Pitch perception and the segregation and integration of auditory entities. In: Edelman G, Gall W, Cowan W, editors. Auditory Function: Neurobiological Bases of Hearing. Wiley; New York: 1988. pp. 623–645. [Google Scholar]
- Hartmann WM. Detecting a Mistuned Harmonic. Michigan State Psychoacoustics Report 129. Michigan State University; East Lansing, MI: 2004. [Google Scholar]
- Hartmann WM, McAdams S, Smith BK. Hearing a mistuned harmonic in an otherwise periodic complex tone. J Acoust Soc Am. 1990;88:1712–724. doi: 10.1121/1.400246. [DOI] [PubMed] [Google Scholar]
- Heil P, Irvine DRF. First-spike timing of auditory-nerve fibers and comparison with auditory cortex. J Neurophysiol. 1997;78:2438–2454. doi: 10.1152/jn.1997.78.5.2438. [DOI] [PubMed] [Google Scholar]
- Hewitt MJ, Meddis R. A computer model of amplitude-modulation sensitivity of single units in the inferior colliculus. J Acoust Soc Am. 1994;95:2145–2159. doi: 10.1121/1.408676. [DOI] [PubMed] [Google Scholar]
- Johnson DH. The relationship between spike rate and synchrony in responses of auditory-nerve fibers to single tones. J Acoust Soc Am. 1980;68:1115–1122. doi: 10.1121/1.384982. [DOI] [PubMed] [Google Scholar]
- Kiang NYS. Discharge Patterns of Single Fibers in the Cat Auditory Nerve. MIT Press; Cambridge, MA: 1965. [Google Scholar]
- Kitzes LM, Gibson MM, Rose JE, Hind JE. Initial discharge latency and threshold considerations for some neurons in cochlear nuclear complex of the cat. J Neurophysiol. 1978;41:1165–1182. doi: 10.1152/jn.1978.41.5.1165. [DOI] [PubMed] [Google Scholar]
- Krishna BS, Semple MN. Auditory temporal processing: responses to sinusoidally amplitude-modulated tones in the inferior colliculus. J Neurophysiol. 2000;84:255–273. doi: 10.1152/jn.2000.84.1.255. [DOI] [PubMed] [Google Scholar]
- Langner G, Schreiner CE. Periodicity coding in the inferior colliculus of the cat. I. Neuronal mechanisms. J Neurophysiol. 1988;60:1799–1822. doi: 10.1152/jn.1988.60.6.1799. [DOI] [PubMed] [Google Scholar]
- LeBeau FE, Malmierca MS, Rees A. Iontophoresis in vivo demonstrates a key role for GABA(A) and glycinergic inhibition in shaping frequency response areas in the inferior colliculus of guinea pig. J Neurosci. 2001;21:7303–7312. doi: 10.1523/JNEUROSCI.21-18-07303.2001. [DOI] [PMC free article] [PubMed] [Google Scholar]
- Lee J, Green DM. Detection of a mistuned component in a harmonic complex. J Acoust Soc Am. 1994;96:716–725. doi: 10.1121/1.410310. [DOI] [PubMed] [Google Scholar]
- Li H, Henderson J, Sinex DG. Responses of inferior colliculus neurons to SAM tones located in inhibitory response area. Abstr Assoc Res Otolaryngol. 2002 doi: 10.1016/j.heares.2006.07.012. [DOI] [PMC free article] [PubMed] [Google Scholar]
- Li L, Kelly JB. Inhibitory influence of the dorsal nucleus of the lateral lemniscus on binaural responses in the rat’s inferior colliculus. J Neurosci. 1992;12:4530–4539. doi: 10.1523/JNEUROSCI.12-11-04530.1992. [DOI] [PMC free article] [PubMed] [Google Scholar]
- Liberman MC. Auditory nerve responses from cats raised in a low-noise chamber. J Acoust Soc Am. 1978;63:442–455. doi: 10.1121/1.381736. [DOI] [PubMed] [Google Scholar]
- Merzenich MM, Reid MD. Representation of the cochlea within the inferior colliculus of the cat. Brain Res. 1974;77:397–415. doi: 10.1016/0006-8993(74)90630-1. [DOI] [PubMed] [Google Scholar]
- Moore BC, Glasberg BR, Peters RW. Thresholds for hearing mistuned partials as separate tones in harmonic complexes. J Acoust Soc Am. 1986;80:479–483. doi: 10.1121/1.394043. [DOI] [PubMed] [Google Scholar]
- Moore BC, Peters RW, Glasberg BR. Thresholds for the detection of inharmonicity in complex tones. J Acoust Soc Am. 1985;77:1861–1867. doi: 10.1121/1.391937. [DOI] [PubMed] [Google Scholar]
- Nelson PC, Carney LH. A phenomenological model of peripheral and central neural responses to amplitude-modulated tones. J Acoust Soc Am. 2004;116:2173–2186. doi: 10.1121/1.1784442. [DOI] [PMC free article] [PubMed] [Google Scholar]
- Nuding SC, Chen G-D, Sinex DG. Monaural response properties of single neurons inthe chinchilla inferior colliculus. Hear Res. 1999;131:89–106. doi: 10.1016/s0378-5955(99)00023-4. [DOI] [PubMed] [Google Scholar]
- Oliver DL, Shneiderman A. The anatomy of the inferior colliculus: a cellular basis for integration of monaural and binaural information. In: Altschuler RA, Bobbin RP, Clopton BM, Hoffman DW, editors. Neurobiology of Hearing: The Central Auditory System. Raven Press; New York: 1991. pp. 195–222. [Google Scholar]
- Patterson RD, Holdsworth J, Allerhand M. Auditory models as preprocessors for speech recognition. In: Schouten MEH, editor. The Auditory Processing of Speech: From the Auditory Periphery to Words. de Gruyter; Berlin: 1992. pp. 67–83. [Google Scholar]
- Rees A, Møller AR. Responses of neurons in the inferior colliculus of the rat to AM and FM tones. Hear Res. 1983;10:301–330. doi: 10.1016/0378-5955(83)90095-3. [DOI] [PubMed] [Google Scholar]
- Rhode WS. Technical Report. University of Wisconsin, Dept. of Neurophysiology; Madison, WI: 1976. A Test for the Significance of the Mean Direction and the Concentration Parameter of a Circular Distribution. [Google Scholar]
- Rose JE, Brugge JF, Anderson DJ, Hind JE. Phase-locked response to low-frequency tones in single auditory nerve fibers of the squirrel monkey. J Neurophysiol. 1967;30:769–793. doi: 10.1152/jn.1967.30.4.769. [DOI] [PubMed] [Google Scholar]
- Semple MN, Kitzes LM. Single-unit responses in the inferior colliculus: different consequences of contralateral and ipsilateral auditory stimulation. J Neurophysiol. 1985;53:1467–1482. doi: 10.1152/jn.1985.53.6.1467. [DOI] [PubMed] [Google Scholar]
- Siegel JH, Kim DO, Molnar CE. Effects of altering organ of Corti on cochlear distortion products f2-f1 and 2f1-f2. J Neurophysiol. 1982;47:303–328. doi: 10.1152/jn.1982.47.2.303. [DOI] [PubMed] [Google Scholar]
- Sinex DG. Neural correlates of spectral segregation. J Acoust Soc Am. 2004;115:2573. [Google Scholar]
- Sinex DG, Guzik H, Li H, Henderson Sabes J. Responses of auditory nerve fibers to harmonic and mistuned complex tons. Hear Res. 2003;182:130–139. doi: 10.1016/s0378-5955(03)00189-8. [DOI] [PubMed] [Google Scholar]
- Sinex DG, Henderson J, Li H, Chen GD. Responses of chinchilla inferior colliculus neurons to amplitude-modulated tones with different envelopes. J Assoc Res Otolaryngol. 2002a;3:390–402. doi: 10.1007/s101620020026. [DOI] [PMC free article] [PubMed] [Google Scholar]
- Sinex DG, Li H. Effect of component phase on responses of inferior colliculus neurons to harmonic and mistuned complex tones. Abstr Assoc Res Otolaryngol. 2004 doi: 10.1016/s0378-5955(02)00366-0. [DOI] [PubMed] [Google Scholar]
- Sinex DG, Li H, Sabes JH. Modeling spectral integration that underlies IC responses to complex tones. Abstr Assoc Res Otolaryngol. 2003 [Google Scholar]
- Sinex DG, Sabes JH, Li H. Responses of inferior colliculus neurons to harmonic and mistuned complex tones. Hear Res. 2002b;168:150–162. doi: 10.1016/s0378-5955(02)00366-0. [DOI] [PubMed] [Google Scholar]
- Slaney M. Technical Report 45. Apple Computer; Cupertino, CA: 1994. Auditory Toolbox. [Google Scholar]
- Winter IM, Palmer AR. Level dependence of cochlear nucleus onset unit responses and facilitation by second tones or broadband noise. J Neurophysiol. 1995;73:141–159. doi: 10.1152/jn.1995.73.1.141. [DOI] [PubMed] [Google Scholar]
- Yost WA. Auditory image perception and analysis: the basis for hearing. Hear Res. 1991;56:8–18. doi: 10.1016/0378-5955(91)90148-3. [DOI] [PubMed] [Google Scholar]
- Young ED, Robert J-M, Shofner WP. Regularity and latency of units in ventral cochlear nucleus: implications for unit classification and generation of response properties. J Neurophysiol. 1988;60:1–29. doi: 10.1152/jn.1988.60.1.1. [DOI] [PubMed] [Google Scholar]


