

Abstract
Oxidative stress has been found to play a role in the pathogenesis of diabetic complications. The aim of this study was to define the oxidative burst of diabetic monocytes to characterize the phenotype associated with poor diabetic control. Superoxide (O2-) is the first molecule generated during the respiratory burst of phagocytes by NADPH oxidase, and its generation by monocytes from 26 controls and 34 diabetic subjects was evaluated in this study. Under resting states or stimulation by PMA or opsonized zymosan, diabetic monocytes produce significantly more O2- than nondiabetic cells. The increased O2- generation was found to be correlated with glycemic control (glycated hemoglobin) of patients. To clarify the effects of hyperglycemia on O2- generation, normal human monocytes were treated with receptor for advanced glycation endproducts (RAGE) ligands (AGE protein and S100B) or high glucose media before stimulation. RAGE ligands and high glucose concentration increased O2- generation from human mononuclear phagocytes. RAGE ligands, specifically and potently, increased O2- generation from mononuclear phagocytes, and high-glucose effects were associated with correspondingly increased osmotic pressure. Differentiated THP-1 cells, from a human monocytic cell line, were used as a model of human monocytes to study the effects of S100B, the RAGE ligand. It was confirmed that RAGE is involved in the priming of O2- generation by S100B. This study demonstrates that RAGE ligands can contribute significantly to the hyper-responsive phenotype of diabetic monocytes, which might be reversible by blocking the RAGE or controlling the presence of RAGE ligands by controlling hyperglycemia.
Keywords: monocytes/macrophages
INTRODUCTION
The higher susceptibility to and severity of infection observed in diabetics and the increased frequency of inflammatory diseases such as atherosclerosis and periodontitis suggest that there are changes in the immune system. Several functional alterations of diabetic mononuclear phagocytes have been reported. These include altered superoxide (O2-) production, defective chemotaxis, and phagocytosis [1]. There are some controversial findings regarding O2- generation by diabetic monocytes. Some studies [2-4] reported that O2- generation was elevated in diabetes, and another study found that it was decreased in Type 2 diabetes mellitus (DM) [5]. In this study, the oxidative burst from diabetic monocytes was evaluated thoroughly, and the effects of hyperglycemia were investigated.
Glucose processing uses a variety of diverse, metabolic pathways; hence, chronic hyperglycemia can induce multiple mechanisms leading to diabetic complications. Until lately, advanced glycation endproduct (AGE)-mediated events were believed to be of primary importance in the pathogenesis of diabetic complications such as retinopathy, nephropathy, neuropathy, and atherosclerosis [6]. AGE are products of nonenzymatic glycation of proteins, lipids, or nucleic acids, which accumulate significantly more in the blood and tissues of diabetics [7]. These glycated products induce cellular disorders through interactions with cell surface receptors, for example, receptors for AGE (RAGE). Initial studies about mononuclear phagocytes have shown that interaction of AGE with RAGE triggers a range of responses including chemotaxis [8], expression of proinflammatory cytokines (IL-1β and TNF-α) [7], platelet-derived growth factor [8], tissue factor [9], and insulin-like growth factor [10]. There are emerging evidences suggesting that another type of RAGE ligand, S100/Calgranulins, is also related to diabetes. S100/Calgranulins are inflammatory molecules having profound effects on various cells [11]. The level of S100B protein was increased in brain, white fat, and testes, and S100A1 protein level was increased in kidney and lung tissue of Type I diabetic animals [12]. Plasma levels of S100A12 were found to be unregulated in patients with Type 2 diabetes [13]. A study by Suzuki and Kato [14] further suggested that S100 protein release from white fat tissue is correlated with insulin regulation.
Production of O2- seems to occur within all aerobic cells, to an extent dependent on O2 concentration. In mitochondria, 1-3% of electrons form O2- [15]. When stimulated, phagocytes start to consume a vast amount of oxygen (10-20 times that of the resting state), which would be converted into various reactive oxygen species during a process called respiratory or oxidative burst [16], and oxidative burst, characterized by O2- generation, is one of the pathogen-killing functions of activated mononuclear phagocytes.
MATERIALS AND METHODS
Study population
For the O2- generation study, 34 diabetic patients and 26 systemically healthy individuals were recruited at the Clinical Research Center of Boston University Goldman School of Dental Medicine (MA). Institutional Review Board approval and signed consent from individuals were obtained prior to the study. Patients with DM were selected according to the criteria of the National Diabetes Data Group [17]. Demographic data for the diabetic patients, including type of diabetes, age, gender, race, and smoking status, were recorded (Table 1). The duration and metabolic control of diabetes were assessed by glycated hemoglobin (HbA1c), triglyceride, and total cholesterol levels (Table 2). Based on their glycemic, control values, diabetic patients were grouped further into three groups as shown in Table 2 [18].
TABLE 1.
Demographic Data of Nondiabetic, Healthy Controls and Diabetic Patients (mean±sem)
| Healthy controls | Diabetes mellitus patients | |||
|---|---|---|---|---|
| n | 26 | Type1: 11 | ||
| Type2: 23 | ||||
| Age (mean±sem) | 39 ± 10 | 52 ± 12 | ||
| Gender | Male | 17 | 21 | |
| Female | 9 | 13 | ||
| Ethnicity | White | 11 | 12 | |
| African-American | 8 | 13 | ||
| Hispanic | 6 | 9 | ||
| Smoking status | Smoker | 2 | 11 | |
| Former-smoker | 0 | 5 | ||
| Never-smoker | 24 | 18 | ||
There were no significant differences in the mean age among groups.
TABLE 2.
Metabolic Features of Diabetic Patients (mean±sem)
| Diabetes mellitus patients |
||||
|---|---|---|---|---|
| Total DM patients | Well-controlled DM HbA1C < 7.0% | Moderately controlled DM HbA1C 7.0-8.0% | Poorly controlled DM HbA1C > 8.0% | |
| n | 34 | 8 | 11 | 16 |
| Age | 52 ± 12 | 45.6 ± 5.0 | 54.4 ± 4.4 | 53.9 ± 2.8 |
| Duration of DM (months) | 150 ± 20 | 137.7 ± 41.5 | 134.6 ± 47.9 | 165.1 ± 22.3 |
| Triglyceride (mg/dl) | 103 ± 53 | 83.8 ± 10.6 | 74.8 ± 9.5 | 114.8 ± 11.8 |
| Total cholesterol (mg/dl) | 176 ± 27 | 172.2 ± 7.7 | 176 ± 16.3 | 177.8 ± 9.9 |
Diabetic patients were divided into three groups based on the glycemic control, as evaluated by HbA1C measurement. There were no significant differences in age, duration of DM, total serum cholesterol, and triglycerides among groups.
Reagents
Gey’s balanced salt solution (GBSS), penicillin-streptomycin (10,000 units/ml-10,000 μg/ml), FBS, and L-glutamine were purchased from Gibco Laboratories (Grand Island, NY). THP-1 cell line and culture medium RPMI 1640 were purchased from American Type Culture Collection (Manassas, VA). RAGE N-16 antibody, normal goat IgG, and secondary antibodies were purchased from Santa Cruz Biotechnology (CA). Cell lysis buffer (10×) and 3× sample buffer were purchased from Cell Signaling Technology (Beverly, MA). Bovine S100B protein was obtained from BD Transduction Laboratories (San Diego, CA). Bicinchoninic acid (BCA) protein assay reagent and SuperSignal West Pico chemiluminescent substrate were obtained from Pierce (Rockford, IL). All the other reagents, including Histopaque 1119, Histopaque 1077, BSA, PMA, 100 mM PMSF, protease inhibitor cocktail, and phosphatase inhibitor cocktail, were purchased from Sigma Chemical Co. (St. Louis, MO).
Preparation of the AGE protein [carboxymethyllysine (CML)-OVA]
CML is the major form of AGE [19]. CML-OVA was prepared from OVA as described previously [19]. Briefly, OVA (175 mg/ml) was incubated with 0.45 M sodium cyanoborohydride and 0.155 M glyoxylic acid in 0.2 M sodium phosphate, pH 7.8, at 37°C for 24 h. Control reaction (control OVA) lacking glyoxylic acid was incubated under exactly the same conditions. All samples were dialyzed exhaustively against PBS (pH 7.4). About 30% of lysine residues of CML-OVA were converted to Nε-carboxymethylysine, according to the trinitrobenzenesulfonic acid assay. LPS levels were less than 2.5 pg/ml, as determined by Limulus polymphemus E-Toxate kit (Sigma Chemical Co.).
Isolation and purification of peripheral blood monocytes
Heparinized (10 IU/ml) peripheral blood was layered on top of a Ficoll-Hypaque discontinuous gradient system. Mononuclear phagocytes were collected and separated further from the lymphocytes using an indirect magnetic cell-sorting system (Miltenyi Biotec Inc., Auburn, CA). The system uses a negative selection to isolate untouched monocytes from human PMBC. Nonmonocytes, i.e., T cells, NK cells, B cells, dendritic cells, and basophils, were magnetically labeled using a biotin-conjugated antibody cocktail (including antibodies specifically against CD3, CD7, CD16, CD19, CD56, CD123, glycophorin A, and 0.05% sodium azide). The labeled cells were mixed and bound to antibiotin microbeads (superparamagnetic particles). By using a MACS column with a coated, cell-friendly matrix placed in a permanent magnet, the MACS separator, the magnetic force retained the target cells labeled with microbeads. The unlabeled monocytes passed through the column. After passing through the column, mononuclear phagocytes were collected and washed twice with PBS. Staining of the cells with α-naphthyl acetate esterase demonstrated that the purity of the mononuclear phagocytes population reached up to 90-95%. No significant cell death was detected by trypan blue staining.
Human mononuclear phagocytes culture
After isolation, monocytes were cultured in RPMI-1640 medium, supplemented with 10% human AB serum, 100 units/ml, 100 μg/ml penicillin-streptomycin, 10 mM HEPES, and one of the following reagents: 5.5 mM D-glucose (low glucose concentration), 25.5 mM D-glucose (high glucose concentration), 5.5 mM D-glucose + 20 mM mannitol (osmotic control), 5.5 mM D-glucose + 20 mM L-glucose (osmotic control), 10 ng/ml IFN-γ (positive control, as a known priming agent for oxidative burst), 200 μg/ml CML-OVA (AGE protein), 200 μg/ml OVA (native OVA as a negative control for CMLOVA), or 1 μg/ml S100B. L-Glucose and mannitol served as hyperosmotic controls for high D-glucose. The difference between L-glucose and mannitol is that mannitol cannot be transported into the plasma membrane, but it will create extracellular hyperosmolarity in the cell culture. L-Glucose, however, can enter into the cells as D-glucose. Mononuclear phagocytes were seeded directly into a 96-well tissue-culture plate (5×10⁵/200 μl/well). Cells were cultured for 2-5 days, and medium was renewed daily.
THP-1 cell culture
THP-1 cells, a commonly used human monocytic leukemia cell line, were cultured in RPMI-1640 medium, supplemented with 10% FBS and 0.05 mM 2-ME. Passages 2-20 were used in this study. THP-1 cells were differentiated in RPMI-1640 medium with 10 ng/ml vitamin D3 for 48-72 h. To block the priming effects of S100B on O2- generation, THP-1 cells were treated with RAGE N-16 antibody (9 μg/ml) 1 h before adding S100B (1 μg/ml). Normal goat IgG, as the negative control, was used in parallel to RAGE antibody. After 2 days of culture, O2- production assay was performed.
O2- production assay
O2- was determined using the O2- dismutase (SOD)-inhibitable cytochrome C reduction assay [20]. O2- production was measured by covering the monocyte monolayer with ferricytochrome C solution (300 μg/ml, 200 μl/well) in GBSS (Invitrogen, Carlsbad, CA). PMA (20 nM), fMLP (1 μM), or human serum opsonized zymosan (OPZ; 2.5 mg/ml) was added to the reaction mixtures as stimulants to trigger respiratory burst. Cells covered with cytochrome C solution supplemented with 300 μg/ml SOD were used for blanking. Microplate was read at a wavelength of 550 nm by a Vmax microplate reader (Molecular Devices, Sunnyvale, CA). The amount of O2- produced per well was calculated by the formula: nmol O2-/well = (absorbance at 550 nm×100)/6.3, and adjusted by cell number or total protein content per well.
RT-PCR
Total RNA extraction was performed with the RNeasy mini kit (Qiagen, Valencia, CA) following the manufacturer’s instruction. As control reaction for intact RNA and cDNA, PCR for amplification of the β-actin (housekeeping gene) was performed for all tissue samples. cDNA derived from 100 ng total RNA using SuperScript III first-strand synthesis system (Invitrogen, Carlsbad, CA) was used as template in the following PCR, which was carried out in 0.2 ml tubes. The reaction mix (20 μl) contained 0.5 μL recombinant Taq polymerase (5 U/μl; Qiagen), 2 μl PCR buffer (10× concentrated) and 1× Q-solution (Qiagen), dNTP mix with 200 μM each, and 200 nM each primer (sense 5′-GATCCCCGTCCCACCTTCTCCTGTAGC-3′; antisense 5′-CACGCTCTCCTCTTCCTCCTGGTTTTCTG-3′). Amplification was performed in a thermal cycler (GeneAmp PCR System 9700, Applied Biosystems, Foster City, CA) for 35 cycles. Amplification was for 30 s at 94°C, 30 s at 69°C, and 1 min at 72°C. Initial denaturing was 3 min at 94°C, and final elongation was for 10 min at 72°C. All the PCR products have been sent for sequencing to confirm their identities.
Western blotting
Cells were lysed with cell lysis buffer (20 mM Tris-HCl, pH 7.5, 150 mM NaCl, 1 mM Na2EDTA, 1 mM EGTA, 1% Triton, 2.5 mM sodium pyrophosphate, 1 mM β-glycerophosphate, 1 mM Na3VO4, 1 μg/ml leupeptin, 1 mM PMSF, 1× phosphoserine phosphatase inhibitor, and 1× protease inhibitor cocktail). Cell lysates containing 60 μg total protein were mixed with SDS sample buffer (62.5 mM Tris-HCl, pH 6.8, 2% w/v SDS, 10% glycerol, 50 mM DTT, and 0.01% w/v bromophenol blue) and boiled in water for 5 min. Samples were loaded onto 10.0% (v/v) SDS-PAGE polyacrylamide gels. The separated proteins were transferred electrophoretically, immediately to a polyvinylidene difluoride membrane at 30 V for 12 h. After blocking in 5% dry milk in TBST (20 mM Tris-HCI, pH 7.5, 250 mM NaCl, 0.1% Tween 20), membranes were incubated overnight with RAGE N-16 antibody (v/v 1:200), with or without blocking peptide (1:40). Membranes were incubated sequentially with secondary antibody (1:10,000) for 1 h. The HRP activity was visualized by incubating the membranes for 5 min at room temperature in a luminol-ECL detection system (Pierce) followed by autoradiography.
Statistical analysis
Results are expressed as mean ± se. ANOVA was used, and multiple comparison procedures were used for group pairs. For multiple comparisons, Bonferroni’s correction was used. Comparison was controlling for overall Type I error. Difference in the means between groups was considered significant for a P value less than 0.05.
RESULTS
O2- generation from stimulated mononuclear phagocytes
O2- generation in response to different stimuli was first characterized in human mononuclear phagocytes from seven healthy subjects; fMLP (1 μM), PMA (200 nM), and OPZ (2.5 mg/ml) were used as stimulants. PMA was shown to induce O2- production gradually, and the maximal velocity (2.79±0.16 nmol/mg/min) was achieved at 3 min after stimulation (Fig. 1). During the first 10 min, the velocity remained steady. Compared with PMA, OPZ had a faster and shorter action, and maximal velocity (7.68±1.06 nmol/mg/min) was achieved within 1 min after stimulation and reduced soon after the peak. This kinetic curve of O2- generation reveals that O2- generation was a fast reaction, which usually happens within 10 min after stimulation in monocytes. The total amount of O2- produced from the first 10 min was thus chosen as the indicator of O2- production in this study. fMLP, a chemotatic peptide, is a weak stimulant compared with PMA and OPZ. Total protein was measured by BCA assay, and 1 mg total protein is approximately equivalent to 20 million monocytes. Isolation of monocytes was performed with antibody cocktail labeled with microbeads. Sodium azide was included in the antibody cocktail provided. It is known that sodium azide inhibits the catabolism of H2O2, thus decreasing the formation of 1O2 and OH-. A study by Sagone et al. [21] showed that sodium azide did not affect cytochrome C reduction, suggesting that it has no direct effects on O2- formation. Our preliminary experiments have also confirmed that O2- generation from monocytes isolated with the MACS system has no significant difference from that of monocytes isolated by methods based on adherence (data not shown). However, considering the potential effects of sodium azide on the cell metabolism, future studies should consider using azide-free antibodies. In the SOD-inhibitable cytochrome C reduction assay, real-time velocity of O2- generation every minute after stimulation was recorded. The duration of O2- generation from phagocytes reported in previous studies ranged from 1 min to 1 h, depending on the type of stimulant used. fMLP induced maximal oxidative burst within 1 min [22], and OPZ induced O2- generation up to 1 h [23]. However, the cytochrome C reduction assay performed in this study, as shown in Figure 1, demonstrated that maximum of O2- generation with OPZ was between 1 and 2 min and lasted up to 10 min, decaying rapidly thereafter. This confirms the observation of McPhail and Snyderman [22] that the O2- response is rapid, while contradicting the earlier work measuring O2- within 1 h. Our findings imply that the kinetics of O2- generation in monocytes is agonist-specific, and the dynamics of stimulated generation rather than the accumulation of O2- should be observed in this time-frame.
Fig. 1.
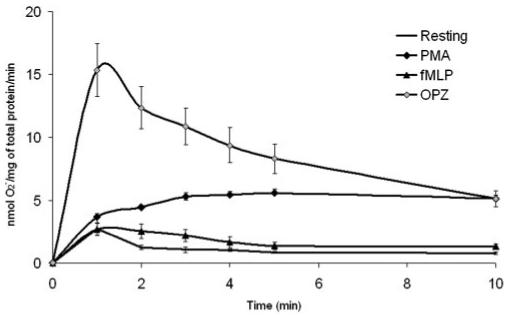
Characterization of O2- generation by stimulated, normal human mononuclear phagocytes. After isolation, mononuclear phagocytes from healthy controls (n=7) were stimulated with fMLP (1 μM), PMA (200 nM), or OPZ (2.5 mg/ml). O2- release was measured by the SOD-inhibitable cytochrome C reduction assay continuously up to 10 min. Cells treated with PBS alone were considered unstimulated. The rates of O2- production (nmol O2-/mg total protein/min) in response to different stimulations at each time-point are shown. All values represent the average ± se.
Increased O2- generation from diabetic monocytes compared with control cells
As shown in Figure 2, O2- generation from unstimulated mononuclear phagocytes was significantly higher in diabetic patients (13.66±2.36 nmol/mg protein) compared with controls (7.08±0.92 nmol/mg protein; P<0.01). When mononuclear phagocytes were stimulated with PMA, the production of O2- was increased in diabetic patients (41.7±5.54 nmol/mg protein) versus healthy subjects (25.02±2.28 nmol/mg protein; P<0.05). When OPZ was used as stimulant, the increase in O2- production was also significantly higher in diabetic patients (40.36±5.14 nmol/mg protein) compared with healthy subjects (25.98±2.5 nmol/mg protein; P<0.05). As Types 1 and 2 diabetic patients were enrolled in our studies, we also compared O2- generation between these two groups. We did not find any significant difference based on the type of diabetes (data not shown). The comparison between diabetic and control mononuclear phagocytes suggests that basal level of O2- generation and O2- generation in response to OPZ or PMA stimulation was elevated in diabetic cells regardless of the type of diabetes.
Fig. 2.

O2- production by normal and diabetic mononuclear phagocytes. After isolation from blood, mononuclear phagocytes from 26 nondiabetic controls and 34 diabetic patients were treated with PBS alone, PMA (200 nM), or OPZ (2.5 mg/ml). Accumulated O2- release at the first 10 min under different treatments is shown, and comparison was made between nondiabetic controls and diabetic monocytes. The amount of O2- production is adjusted by total protein content of each well (nmol O2-/mg total protein). All values represent the mean ± se (*, P<0.01, compared with nondiabetic control).
Increase of O2- generation in diabetes is related to hyperglycemia
To determine if glycemic control is related to the hyperresponsive phenotype of diabetic monocytes, O2- generation was compared between diabetics based on their glycemic control, as determined by HbA1c levels (Table 2). O2- generation, under the resting state, has a trend to increase in moderately (5.69±1.54 nmol/mg protein) and poorly controlled groups (3.93±1.37 nmol/mg protein) compared with the nondiabetic or well-controlled DM groups (2.06±0.89 nmol/mg protein; Fig. 3). Under stimulation by OPZ, moderately controlled (43.6±5.87 nmol/mg protein) and poorly controlled diabetics (51.42±3.88 nmol/mg protein) also produced significantly more O2- than the well-controlled diabetics (23.1±0.85 nmol/mg protein; P<0.01). However, there was no significant difference between moderately and poorly controlled DM groups. There was also no significant difference of O2- generation between smokers and nonsmokers.
Fig. 3.

Correlation of O2- production from diabetic mononuclear phagocytes with glycemic control. Diabetic patients were grouped into three groups (Table 2), which are well-controlled DM (n=6), moderately controlled DM (n=11), and poor-controlled DM (n=16). The data of baseline level of O2- release and OPZ-stimulated O2- production at 10 min were collected. Comparisons were made among these groups and controls. All values represent the mean ± se (*, P<0.01, compared with nondiabetic control or well-controlled diabetics).
Overall, there was a positive correlation between O2- production and HbA1c levels, which suggests that the hyperresponsive phenotype of diabetic mononuclear phagocytes is somehow associated with the glycemic control of these patients.
Effects of high glucose, hyperosmolarity, AGE protein, and S100B on O2- generation
High glucose levels, hyperosmolarity, and presence of RAGE ligands occur in hyperglycemia, and these three factors have been found to impair normal cell function. The following experiments were performed to define the influence of these factors on O2- generation. Figure 4 shows that high D-glucose levels increased the O2- generation. In cells not treated with secondary stimuli (unstimulated), high glucose (25.5 mM D-glucose) led to a significant increase in O2- generation compared with low glucose (5.5 mM D-glucose) treatment (P<0.05). The difference between the effects of high and low glucose concentrations was stable and significant when the cells were treated with PMA (P<0.05). Pre-exposure to high glucose was shown to preactivate the cells in response to OPZ (P<0.01). The osmotic control groups, cells treated with medium supplemented with mannitol (5.5 mM D-glucose+20 mM mannitol) or L-glucose (5.5 mM D-glucose+20 mM L-glucose), however, had an elevation similar to high D-glucose treatment on PMA and OPZ stimulations. These data suggest that high glucose alone increased the baseline level of O2-, and it did preactivate the cells in response to secondary stimulation. However, the priming seemed to be at least partly a result of the increase of osmolarity.
Fig. 4.
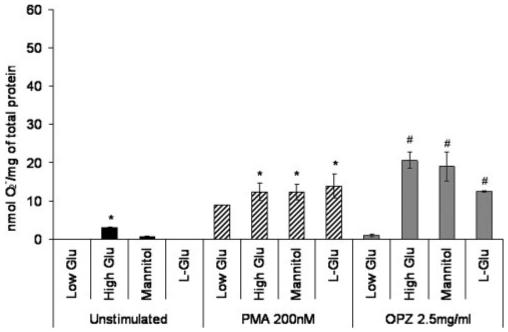
Effects of high glucose concentration and hyperosmolarity on O2- generation from normal human mononuclear phagocytes, which were isolated from healthy controls (n=4) and cultured in RPMI 1640 with low glucose (5.5 mM D-glucose), high glucose (25.5 mM D-glucose), mannitol (5 mM D-glucose, 20 mM mannitol), or L-glucose (5.5 mM D-glucose, 20 mM L-glucose). The cells were assayed after 2 days for O2- anion generation in the resting state or under stimulation with PMA or OPZ. The amount of O2- production was adjusted by total protein content of each well (nmol O2-/mg total protein). All values represent the average ± se (*, P<0.05, compared with low glucose; #, P<0.01, compared with low glucose).
The experiment of Figure 5 was performed to determine whether AGE and S100B take part in the preactivation of mononuclear phagocytes. IFN-γ (10 ng/ml), the known priming factor for monocytes/macrophages, served as a positive control. The negative control in this experiment was native OVA without modification. Figure 5 shows that incubating the cells in the presence of AGE protein increases O2- generation significantly in response to PMA (1.5-fold) and OPZ (4.7-fold) compared with cells treated with PBS alone or with the same concentration of control protein in PBS (P<0.05). The priming effects of AGE protein were comparable with IFN-γ. As also shown in Figure 5, S100B had a similar but stronger preactivating effect compared with AGE protein. The much smaller SE of S100B also suggests that it is a more stable and defined ligand of RAGE than the AGE protein. The priming by the AGE protein and S100B on O2- generation seemed to be independent of osmotic changes, because of the lack of corresponding influences from the control protein under the same concentration.
Fig. 5.

Effects of AGE and S100B on O2- production from human mononuclear phagocytes, which were isolated and cultured for 2-5 days with AGE protein (CML-OVA, 250 μg/ml), IFN-γ (10 ng/ml), control protein (native OVA, 250 μg/ml), or S100B (1 μg/ml), respectively. Cells were then treated with PBS alone (unstimulated), 200 nM PMA, or 2.5 mg/ml OPZ. O2- generation was measured by SOD-inhibitable cytochrome C reduction assay. The amount of O2- production was adjusted by total protein content of each well (nmol O2-/mg total protein). All values represent the mean ± se from three healthy controls (*, P<0.05, compared with cells treated with control protein).
THP-1 cells as a model of human mononuclear phagocytes
As primary human monocytes account for only 3-9% of all leukocytes, their availability is limited. Thus, differentiated THP-1 cells have been broadly used as a model of mature human monocytes. It has been well established that THP-1 cells secrete a series of cytokines including TNF-α and IL-1β [24] and possess functional NADPH oxidase [25, 26]. Based on the importance of RAGE in our study, expression of RAGE in THP-1 cells and primary human mononuclear phagocytes at mRNA (Fig. 6) and protein levels (Fig. 7) was investigated. Mono-Mac 6, another established monocytic cell line, was also examined for RAGE expression compared with THP-1 cells. Total RNA from human lung tissue served as the positive control, and the major form of receptor for AGE in the lung is RAGE, which translates into a full-length protein. Two isoforms (RAGE mRNA and sRAGE1 mRNA encoding the C-terminal, truncated form of the RAGE protein) were expressed in human mononuclear phagocytes, THP-1 cells, and Mono-Mac 6 cells. RAGE mRNA expression seemed to be more abundant in THP-1 cells compared with Mono-Mac 6 cells, and the amount was closer to the level in human mononuclear phagocytes. Figure 7 shows the presence of 50 kDa RAGE protein in human mononuclear phagocytes and THP-1 cells. Disappearance of the 50-kDa band, when blocking peptide for RAGE N-16 antibody was added, demonstrates the specificity of this antibody. Besides the 50-kDa protein, no other isoforms of RAGE were detected specifically by RAGE N-16 antibodyin Western blotting. Based on the functional assays and expression of RAGE, the THP-1 cell line was proved to be an appropriate model of human mononuclear phagocytes.
Fig. 6.
Expression of RAGE mRNA isoforms in various cell types. mRNA from human lung tissue (lane 1), THP-1 cells (lane 2), Mono-Mac 6 (lane 3), and human mononuclear phagocytes (lane 4) was used in RT-PCR to amplify specific targets. PCR products were analyzed with 1% agarose gel containing ethidium bromide (final concentration 0.5 μg/ml). Two isoforms of RAGE mRNA, including RAGE (yielding full-length RAGE protein) and soluble RAGE1 (sRAGE1; yielding C-terminal, truncated, sRAGE protein), are indicated by the arrows. Data are representative of three independent experiments.
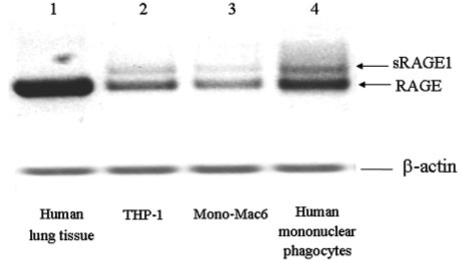
Fig. 7.

Expression of RAGE on THP-1 cells and human mononuclear phagocytes. THP-1 cells were treated with normal culture medium (RPMI 1640 with 25 mM D-glucose) or high glucose medium (RPMI 1640 with 50 mM D-glucose) for 2 days before being lysed for Western blotting for RAGE expression at protein level. Human mononuclear phagocytes were isolated as described. With or without prior mixing with blocking peptide (1:50), RAGE N-16 antibody (1:200) was used to detect the presence of the full-length RAGE protein (50 kDa). Results are representative of three independent experiments.
RAGE is involved in primed O2- generation
Further investigations focused on the signaling events elicited by agonists of RAGE. It is known that AGE and S100B bind to cell-surface receptor RAGE, which has signaling capacity. Therefore, the next experiment was to determine if it is through RAGE that AGE/S100B mediates the priming of O2- generation. To avoid the limited availability and individual variation of human monocytes derived from peripheral blood, experiments investigating AGE-RAGE signaling were shifted to THP-1 cells. Figure 8 shows the specific effect of RAGE ligands (AGE protein and S100B) on O2- generation by THP-1 cells. The capability of THP-1 cells to generate O2- is shown in Figure 8A. THP-1 cells responded well to OPZ stimulation, whereas PMA had weaker effects compared with primary mononuclear phagocytes. S100B by itself did not trigger O2- production. OPZ was thus chosen as the stimulant in the following experiment.
Fig. 8.

S100B primes O2- production from THP-1 cells through RAGE. (A) THP-1 cells were treated under different conditions: resting; 1 μg/ml S100B; 300 nM PMA; or 2.5 mg/ml OPZ. The amount of O2- generation was measured by SOD-inhibitable cytochrome C reduction assay at 10 min. Each bar represents mean ± sem (n=3). (B) Two hours before adding OPZ, cells were treated with S100B alone or S100B and RAGE N-16 antibody. Normal goat IgG was a negative control for RAGE N-16 antibody. O2- generation was measured 10 min after 2.5 mg/ml OPZ stimulation. All values represent the mean ± se from four independent experiments (*, P<0.05).
Anti-RAGE N-16 antibody, which binds to the extracellular domain of RAGE, has been demonstrated previously in our laboratory to block the interaction between RAGE and its agonist. RAGE antibody was added to the cell culture at the same time as S100B and cultured with THP-1 cells for 2-3 days. Figure 8B shows that the incubation of S100B increased the amount of O2- in response to OPZ stimulation from 35.0 ± 2 (nmol/mg total protein) to 81.26 ± 15.77 (nmol/mg total protein; P<0.05). The priming effects of S100B on the response to OPZ can be blocked by adding anti-RAGE N-16 antibody (25.53±3.7 nmol/mg total protein; P<0.05 compared with cells pretreated with S100B). Control IgG did not block the priming by S100B, suggesting that it was the blocking of RAGE that made the difference. The data in Figure 8 suggest that S100B primes O2- generation from THP-1 cells through interaction with RAGE.
DISCUSSION
Reactive oxygen intermediates (hydrogen peroxide and hydroxyl radicals) derived from O2- are important vehicles for defense against bacterial infection; however, they may also cause host tissue injury by causing cell dysfunction, DNA damage, and apoptosis [27] if their generation is not controlled properly. Data of O2- generation of diabetic cells demonstrated that regardless of the type of diabetes, diabetics produced significantly more O2- upon PMA and OPZ stimulation and under the resting state compared with normal mononuclear phagocytes. This finding confirms two previous studies by Kitahara et al. [3] and Devaraj and Jialal [28] and could be associated with atherogenicity of diabetic macrophages [29, 30], exaggerated tissue damage [31, 32], nephropathy [33], and impaired wound healing [34]. The hyper-responsive phenotype of diabetic mononuclear phagocytes suggests that the cells are somehow primed under diabetic conditions. One of the important risk factors that could have priming effects on mononuclear phagocytes in diabetes is hyperglycemia. This was proved in the following analysis. O2- generation under resting and OPZ-stimulated states was compared among our diabetic population, which was divided into three groups by HbA1c level. It was found that the hyper-responsiveness phenotype is correlated to the HbA1c level, which is the indicator of poor chronic glycemic control.
Two factors that arise from hyperglycemia are high glucose concentration and RAGE ligands. The hyper-responsive phenotype of diabetic mononuclear phagocytes and discovery of its relationship to hyperglycemia led to the second part of this study, which is to evaluate the effects of high glucose and RAGE ligands on O2- generation from normal human mononuclear phagocytes. We observed an increased basal level of O2- in cells cultured with high glucose medium but not with mannitol or L-glucose. It has been reported that without stimulation, the increase of O2- anion under high glucose concentration is a result of the enhanced glucose metabolism in the mitochondria [35]. When the oxidative burst was triggered with PMA or OPZ stimulation, high glucose and the osmotic controls induced a similar elevation on O2- generation, which suggests that the effects of high glucose on O2- generation are at least partly a result of increased osmolarity.
Hyperosmolarity might be able to increase O2- generation through certain signaling pathways as the cells respond to cellular stress; however, the effects of hyperosmolarity were shown to be less potent than the RAGE agonists (AGE protein and S100B). Apparently, RAGE agonists mediated oxidative burst independently of hyperosmolarity, as the control protein under the same concentration in the cell culture did not have significant effects on the O2- generation. AGE protein and S100B can prime oxidative burst significantly in response to PMA and OPZ stimulation, and the extent was comparable with IFN-γ, the known priming agent for macrophages/monocytes. Compared with high glucose, the effects of AGE, the focus of this study, seemed to be more specific. Some of the AGE proteins, for example, AGE collagens, are long-lived; therefore, they can activate the cells continuously. Glycated protein (e.g., hemoglobin) in the blood will affect monocytes, and glycated extracellular matrix components (e.g., glycated collagens) will influence the resident macrophages [36]. This might be one of the reasons that some diabetic complications progress even after stringent glucose control therapy.
Cellular priming is usually a conserved, receptor-dependent process [37]. To confirm that activation of RAGE causes the priming, an in vitro blocking of this receptor with anti-RAGE antibody was used to pretreat the cells before adding the ligand S100B. THP-1 cells were used as the cell-line model of human monocytes to avoid the limited availability and individual variation of monocytes isolated from peripheral human blood. THP-1 cells have many characteristics of human monocytes [38]. We have confirmed that THP-1 cells are able to generate O2- responding to OPZ. Expression of RAGE mRNA and protein by THP-1 cells also qualifies them for RAGE signaling investigations. Based on the blocking effects of anti-RAGE N-16 antibody on the increase of O2- generation induced by S100B, the priming induced by S100B on THP-1 cells is mediated through RAGE.
In summary, this study shows that diabetic mononuclear phagocytes are primed to generate O2-, responding to stimulations, and the priming is a result of the hyperglycemia. Among all the factors related to hyperglycemia, RAGE ligands mediate the priming, potentially and specifically through the receptor RAGE. The knowledge from the in vitro blocking experiment gives hints to prevent the hyper-responsive phenotype of mononuclear phagocytes. Further experiments will also be performed to elucidate the mechanisms of RAGE signaling that lead to the enhanced O2- generation.
ACKNOWLEDGMENTS
This work was supported in part by U.S. Public Health Service Grants DE15566, RR00533, and DE14066.
REFERENCES
- 1.Delamaire M, Maugendre D, Moreno M, Le Goff MC, Allannic H, Genetet B. Impaired leucocyte functions in diabetic patients. Diabet. Med. 1997;14:29–34. doi: 10.1002/(SICI)1096-9136(199701)14:1<29::AID-DIA300>3.0.CO;2-V. [DOI] [PubMed] [Google Scholar]
- 2.Mohsenin V, Latifpour J. Respiratory burst in alveolar macrophages of diabetic rats. J. Appl. Physiol. 1990;68:2384–2390. doi: 10.1152/jappl.1990.68.6.2384. [DOI] [PubMed] [Google Scholar]
- 3.Kitahara M, Eyre HJ, Lynch RE, Rallison ML, Hill HR. Metabolic activity of diabetic monocytes. Diabetes. 1980;29:251–256. doi: 10.2337/diab.29.4.251. [DOI] [PubMed] [Google Scholar]
- 4.Hill HR, Hogan NA, Rallison ML, Santos JI, Charette RP, Kitahara M. Functional and metabolic abnormalities of diabetic monocytes. Adv. Exp. Med. Biol. 1982;141:621–628. doi: 10.1007/978-1-4684-8088-7_61. [DOI] [PubMed] [Google Scholar]
- 5.Chang FY, Shaio MF. Respiratory burst activity of monocytes from patients with non-insulin-dependent diabetes mellitus. Diabetes Res. Clin. Pract. 1995;29:121–127. doi: 10.1016/0168-8227(95)01123-4. [DOI] [PubMed] [Google Scholar]
- 6.Vlassara H. The AGE-receptor in the pathogenesis of diabetic complications. Diabetes Metab. Res. Rev. 2001;17:436–443. doi: 10.1002/dmrr.233. [DOI] [PubMed] [Google Scholar]
- 7.Brownlee M, Cerami A, Vlassara H. Advanced glycosylation end products in tissue and the biochemical basis of diabetic complications. N. Engl. J. Med. 1988;318:1315–1321. doi: 10.1056/NEJM198805193182007. [DOI] [PubMed] [Google Scholar]
- 8.Kirstein M, Brett J, Radoff S, Ogawa S, Stern D, Vlassara H. Advanced protein glycosylation induces transendothelial human monocyte chemotaxis and secretion of platelet-derived growth factor: role in vascular disease of diabetes and aging. Proc. Natl. Acad. Sci. USA. 1990;87:9010–9014. doi: 10.1073/pnas.87.22.9010. [DOI] [PMC free article] [PubMed] [Google Scholar]
- 9.Khechai F, Ollivier V, Bridey F, Amar M, Hakim J, de Prost D. Effect of advanced glycation end product-modified albumin on tissue factor expression by monocytes. Role of oxidant stress and protein tyrosine kinase activation. Arterioscler. Thromb. Vasc. Biol. 1997;17:2885–2890. doi: 10.1161/01.atv.17.11.2885. [DOI] [PubMed] [Google Scholar]
- 10.Heidland A, Sebekova K, Schinzel R. Advanced glycation end products and the progressive course of renal disease. Am. J. Kidney Dis. 2001;38(Suppl 1):S100–S106. doi: 10.1053/ajkd.2001.27414. [DOI] [PubMed] [Google Scholar]
- 11.Hofmann MA, Drury S, Fu C, Qu W, Taguchi A, Lu Y, Avila C, Kambham N, Bierhaus A, Nawroth P, Neurath MF, Slattery T, Beach D, McClary J, Nagashima M, Morser J, Stern D, Schmidt AM. RAGE mediates a novel proinflammatory axis: a central cell surface receptor for S100/calgranulin polypeptides. Cell. 1999;97:889–901. doi: 10.1016/s0092-8674(00)80801-6. [DOI] [PubMed] [Google Scholar]
- 12.Zimmer DB, Chessher J, Wilson GL, Zimmer WE. S100A1 and S100B expression and target proteins in type I diabetes. Endocrinology. 1997;138:5176–5183. doi: 10.1210/endo.138.12.5579. [DOI] [PubMed] [Google Scholar]
- 13.Kosaki A, Hasegawa T, Kimura T, Iida K, Hitomi J, Matsubara H, Mori Y, Okigaki M, Toyoda N, Masaki H, Inoue-Shibata M, Nishikawa M, Iwasaka T. Increased plasma S100A12 (EN-RAGE) levels in patients with type 2 diabetes. J. Clin. Endocrinol. Metab. 2004;89:5423–5428. doi: 10.1210/jc.2003-032223. [DOI] [PubMed] [Google Scholar]
- 14.Suzuki F, Kato K. Inhibition of adipose S-100 protein release by insulin. Biochim. Biophys. Acta. 1985;845:311–316. doi: 10.1016/0167-4889(85)90193-4. [DOI] [PubMed] [Google Scholar]
- 15.Halliwell BAG. Free Radicals in Biology and Medicine. 3rd ed. Oxford Science; Oxford, UK: 1998. pp. 33–34. J. M. C. [Google Scholar]
- 16.Babior BM. The respiratory burst of phagocytes. J. Clin. Invest. 1984;73:599–601. doi: 10.1172/JCI111249. [DOI] [PMC free article] [PubMed] [Google Scholar]
- 17.National Diabetes Data Group Classification and diagnosis of diabetes mellitus and other categories of glucose intolerance. Diabetes. 1979;28:1039–1057. doi: 10.2337/diab.28.12.1039. [DOI] [PubMed] [Google Scholar]
- 18.Clark MJ, Jr., Sterrett JJ, Carson DS. Diabetes guidelines: a summary and comparison of the recommendations of the American Diabetes Association, Veterans Health Administration, and American Association of Clinical Endocrinologists. Clin. Ther. 2000;22:899–910. doi: 10.1016/S0149-2918(00)80063-6. [DOI] [PubMed] [Google Scholar]
- 19.Kislinger T, Fu C, Huber B, Qu W, Taguchi A, Du Yan S, Hofmann M, Yan SF, Pischetsrieder M, Stern D, Schmidt AM. N(ε)-(carboxymethyl)lysine adducts of proteins are ligands for receptor for advanced glycation end products that activate cell signaling pathways and modulate gene expression. J. Biol. Chem. 1999;274:31740–31749. doi: 10.1074/jbc.274.44.31740. [DOI] [PubMed] [Google Scholar]
- 20.Chanock SJ, el Benna J, Smith RM, Babior BM. The respiratory burst oxidase. J. Biol. Chem. 1994;269:24519–24522. [PubMed] [Google Scholar]
- 21.Sagone AL, Jr., Mendelson DS, Metz EN. The effect of sodium azide on the chemiluminescence of granulocytes—evidence for the generation of multiple oxygen radicals. J. Lab. Clin. Med. 1977;89:1333–1340. [PubMed] [Google Scholar]
- 22.McPhail LC, Snyderman R. Activation of the respiratory burst enzyme in human polymorphonuclear leukocytes by chemoattractants and other soluble stimuli. Evidence that the same oxidase is activated by different transductional mechanisms. J. Clin. Invest. 1983;72:192–200. doi: 10.1172/JCI110957. [DOI] [PMC free article] [PubMed] [Google Scholar]
- 23.Li Q, Cathcart MK. Selective inhibition of cytosolic phospholipase A2 in activated human monocytes. Regulation of superoxide anion production and low density lipoprotein oxidation. J. Biol. Chem. 1997;272:2404–2411. doi: 10.1074/jbc.272.4.2404. [DOI] [PubMed] [Google Scholar]
- 24.Vey E, Zhang JH, Dayer JM. IFN-γ and 1,25(OH)2D3 induce on THP-1 cells distinct patterns of cell surface antigen expression, cytokine production, and responsiveness to contact with activated T cells. J. Immunol. 1992;149:2040–2046. [PubMed] [Google Scholar]
- 25.Sumi D, Hayashi T, Matsui-Hirai H, Jacobs AT, Ignarro LJ, Iguchi A. 17β-Estradiol inhibits NADPH oxidase activity through the regulation of p47phox mRNA and protein expression in THP-1 cells. Biochim. Biophys. Acta. 2003;1640:113–118. doi: 10.1016/s0167-4889(03)00026-0. [DOI] [PubMed] [Google Scholar]
- 26.Delbosc S, Morena M, Djouad F, Ledoucen C, Descomps B, Cristol JP. Statins, 3-hydroxy-3-methylglutaryl coenzyme A reductase inhibitors, are able to reduce superoxide anion production by NADPH oxidase in THP-1-derived monocytes. J. Cardiovasc. Pharmacol. 2002;40:611–617. doi: 10.1097/00005344-200210000-00015. [DOI] [PubMed] [Google Scholar]
- 27.Martindale JL, Holbrook NJ. Cellular response to oxidative stress: signaling for suicide and survival. J. Cell. Physiol. 2002;192:1–15. doi: 10.1002/jcp.10119. [DOI] [PubMed] [Google Scholar]
- 28.Devaraj S, Jialal I. Low-density lipoprotein postsecretory modification, monocyte function, and circulating adhesion molecules in type 2 diabetic patients with and without macrovascular complications: the effect of α-tocopherol supplementation. Circulation. 2000;102:191–196. doi: 10.1161/01.cir.102.2.191. [DOI] [PubMed] [Google Scholar]
- 29.Cipollone F, Iezzi A, Fazia M, Zucchelli M, Pini B, Cuccurullo C, De Cesare D, De Blasis G, Muraro R, Bei R, Chiarelli F, Schmidt AM, Cuccurullo F, Mezzetti A. The receptor RAGE as a progression factor amplifying arachidonate-dependent inflammatory and proteolytic response in human atherosclerotic plaques: role of glycemic control. Circulation. 2003;108:1070–1077. doi: 10.1161/01.CIR.0000086014.80477.0D. [DOI] [PubMed] [Google Scholar]
- 30.Lopes-Virella MF, Virella G. Immune mechanisms of atherosclerosis in diabetes mellitus. Diabetes. 1992;41(Suppl 2):86–91. doi: 10.2337/diab.41.2.s86. [DOI] [PubMed] [Google Scholar]
- 31.Salvi GE, Collins JG, Yalda B, Arnold RR, Lang NP, Offenbacher S. Monocytic TNF α secretion patterns in IDDM patients with periodontal diseases. J. Clin. Periodontol. 1997;24:8–16. doi: 10.1111/j.1600-051x.1997.tb01178.x. [DOI] [PubMed] [Google Scholar]
- 32.Hou FF, Reddan DN, Seng WK, Owen WF., Jr. Pathogenesis of β(2)-microglobulin amyloidosis: role of monocytes/macrophages. Semin. Dial. 2001;14:135–139. doi: 10.1046/j.1525-139x.2001.00034.x. [DOI] [PubMed] [Google Scholar]
- 33.Hasegawa G, Nakano K, Sawada M, Uno K, Shibayama Y, Ienaga K, Kondo M. Possible role of tumor necrosis factor and interleukin-1 in the development of diabetic nephropathy. Kidney Int. 1991;40:1007–1012. doi: 10.1038/ki.1991.308. [DOI] [PubMed] [Google Scholar]
- 34.Goova MT, Li J, Kislinger T, Qu W, Lu Y, Bucciarelli LG, Nowygrod S, Wolf BM, Caliste X, Yan SF, Stern DM, Schmidt AM. Blockade of receptor for advanced glycation end-products restores effective wound healing in diabetic mice. Am. J. Pathol. 2001;159:513–525. doi: 10.1016/S0002-9440(10)61723-3. [DOI] [PMC free article] [PubMed] [Google Scholar]
- 35.Nishikawa T, Edelstein D, Du XL, Yamagishi S, Matsumura T, Kaneda Y, Yorek MA, Beebe D, Oates PJ, Hammes HP, Giardino I, Brownlee M. Normalizing mitochondrial superoxide production blocks three pathways of hyperglycaemic damage. Nature. 2000;404:787–790. doi: 10.1038/35008121. [DOI] [PubMed] [Google Scholar]
- 36.Jacob SS, Shastry P, Sudhakaran PR. Influence of nonenzymatically glycated collagen on monocyte-macrophage differentiation. Atherosclerosis. 2001;159:333–341. doi: 10.1016/s0021-9150(01)00521-4. [DOI] [PubMed] [Google Scholar]
- 37.Meldrum DR, Cleveland JC, Jr., Moore EE, Partrick DA, Banerjee A, Harken AH. Adaptive and maladaptive mechanisms of cellular priming. Ann. Surg. 1997;226:587–598. doi: 10.1097/00000658-199711000-00003. [DOI] [PMC free article] [PubMed] [Google Scholar]
- 38.Tsuchiya S, Yamabe M, Yamaguchi Y, Kobayashi Y, Konno T, Tada K. Establishment and characterization of a human acute monocytic leukemia cell line (THP-1) Int. J. Cancer. 1980;26:171–176. doi: 10.1002/ijc.2910260208. [DOI] [PubMed] [Google Scholar]