

Abstract
This paper reports on the development of a new structural biology technique for determining the membrane topology of an integral membrane protein inserted into magnetically aligned phospholipid bilayers (bicelles) using EPR spectroscopy. The nitroxide spin probe, 2,2,6,6-tetramethylpiperidine-1-oxyl-4-amino-4-carboxylic acid (TOAC) was attached to the pore-lining transmembrane domain (M2δ) of the nicotinic acetylcholine receptor (AChR) and incorporated into a bicelle. The corresponding EPR spectra revealed hyperfine splittings that were highly dependent on the macroscopic orientation of the bicelles with respect to the static magnetic field. The helical tilt of the peptide can be easily calculated using the hyperfine splittings gleaned from the orientational dependent EPR spectra. A helical tilt of 14° was calculated for the M2δ peptide with respect to the bilayer normal of the membrane, which agrees well with previous 15N solid-state NMR studies. The helical tilt of the peptide was verified by simulating the corresponding EPR spectra using the standardized MOMD approach. This new method is advantageous because: (1) bicelle samples are easy to prepare, (2) the helical tilt can be directly calculated from the orientational-dependent hyperfine splitting in the EPR spectra, and (3) EPR spectroscopy is approximately 1000 fold more sensitive than 15N solid-state NMR spectroscopy; thus, the helical tilt of an integral membrane peptide can be determined with only 100 μg of peptide. The helical tilt can be determined more accurately by placing TOAC spin labels at several positions with this technique.
1. Introduction
The utilization of oriented phospholipid bilayers in both solution NMR and solid-state NMR (SSNMR) spectroscopy has provided a wealth of structural and dynamic information about membrane proteins.1–5 Aligned membrane systems provide unique structural information, when compared with micelles or unoriented phospholipid bilayers consisting of multilamellar vesicles (MLVs). For example, SSNMR studies of 2H-labeled and 15N-labeled proteins incorporated into an aligned membrane system can determine the topology of the protein with respect to the phospholipid bilayers and the static magnetic field.1, 2, 5–9 Generally, these techniques have used phospholipid bilayers that are either mechanically aligned on glass plates10, 11 or magnetically aligned phospholipid bilayers (bicelles).3, 9, 12–15 Although the bicelle model membrane systems were originally developed for SSNMR applications, in our laboratory we successfully demonstrated the magnetic alignment of bicelles at low magnetic field for X-band EPR spectroscopic studies by incorporating either a nitroxide spin-labeled cholesterol derivative (Cholestane) or the fatty acid nitroxide spin probe, doxyl stearic acid (DSA).16–18 In high-field NMR experiments, the bicelles align with their bilayer normal perpendicular to the direction of the static magnetic field due to the negative sign of the magnetic susceptibility anisotropy tensor (Δχ). For low-field X-band EPR experiments, the phospholipid bilayers do not fully align at this orientation without additional alignment reagents. The addition of Dy3+, which posses a large negative Δχ, is used to induce a perpendicular bicelle alignment.16 Conversely, the addition of paramagnetic lanthanide ions with a large positive magnetic susceptibility anisotropy tensor (Eu3+, Er3+, Tm3+ and Yb3+) changes Δχ to a positive value; thus, causing the bicelles to flip 90°such that the membrane normal is parallel with the direction of the static magnetic field.16, 19, 20
The aim of this research is to develop a new structural biology technique for determining the topology of integral membrane proteins inserted into magnetically aligned phospholipid bilayers utilizing spin-labeled EPR spectroscopy. In order to demonstrate the feasibility of this technique, we have used the nicotinic acetylcholine receptor (AChR). The nicotinic acetylcholine receptors are a family of integral membrane ion-channel proteins that bind two molecules of acetylcholine to mediate synaptic transmission of neural signals in the nervous system. The protein is composed of five homologous subunits (α2, β, λ, δ) with a total molecular mass of 280 kDa. 21, 22 Each subunit is composed of a large N-terminal extracellular domain of ~200 amino acids followed by four hydrophobic transmembrane domains of 20–30 residues in length (M1–M4). The M2 domains are of particular interest. The M2 domain of the protein is an amphiphilic α-helix that lines the lumen of the aqueous pores and is responsible for the ion-channel activities of the protein. Opella and coworkers determined the structure and orientation of the M2δ monomer in lipid bilayers using solution and SSNMR techniques.2 M2δ, is α-helical both in dodecylphosphocholine (DPC) micelles and dimyristoylphosphatidylcholine (DMPC) bilayers and found to have a helical tilt angle of 12° relative to the bilayer normal.2 The 15N chemical shift anisotropy, δ, for Leu18 was 198.2 ppm, which is near the limit of the σ33 (217 ppm) chemical shift tensor. This reflects a high degree of ordering at Leu18 due to highly restricted local backbone motions with σ33 oriented nearly parallel to the static magnetic field (Bo). The structural characteristics of the AChR M2δ peptide make it an excellent model transmembrane peptide for developing a new spin-labeled EPR spectroscopic technique to study the structure and orientation of spin-labeled membrane peptides reconstituted into magnetically aligned phospholipid bilayers.
The magnetic interactions of nitroxide spin labels used to label peptides and proteins show a high degree of spatial anisotropy.11 The g and hyperfine splitting values from the EPR spectra of these nitroxide spin labels are axially symmetric, where the observed values are dependent upon the time-averaged orientation that the spin label makes with respect to the direction of the static magnetic field, Bo. Previously, several CW-EPR studies have probed the topology of membrane proteins by obtaining sequential constraints using standard Cys-attached 1-oxyl-2,2,5,5-tetramethyl-D3-pyrroline-3-methylmethanethiosulfonate spin labels (MTSSL).23–29 The TOAC spin label is a tetra substituted unnatural amino acid, and exhibits highly restricted motion due to constrained structural conformations.30 TOAC can be easily functionalized with the 9-fluorenylmethyl-oxycarbonyl (Fmoc) moiety31 for solid-phase peptide synthesis (SPPS) using Fmoc-protected methods.32 TOAC is rigid and known to increase α-helical content of peptides.33–35 The TOAC spin label provides some unique advantages for probing the structural and dynamic properties of integral membrane proteins over the MTSSL approach. In the conventional site-directed spin labeling method, the incorporation of a spin label to a Cys side chain consists of several flexible bonds between the backbone and the nitroxide group, and represents a higher degree of motion. Thus, the EPR spectra of the MTSSL attached to a peptide or protein is dependent upon the corresponding side chain motion. Since the TOAC spin label is rigidly coupled to the peptide backbone, it reports more accurately on the position, orientation and dynamics of the peptide backbone.36, 37 Previous studies have used TOAC to probe the conformational dynamics of short peptides binding to membrane surfaces, including 11-residue lipopeptide antibiotics36, 37 and six- or seven-residue basic peptides.38 Pioneering work by Thomas, Karim, and coworkers have used the synthetic incorporation of TOAC into monomeric phospholamban (PLB) to probe the real time detection of the functionally important conformational changes in the cytoplasmic domain of PLB in lipid bilayers.39, 40 Also, these studies have also shown that the introduction of the TOAC spin label onto a membrane protein does not alter the secondary structure.40 These characteristics make TOAC a powerful tool to probe the structure and orientation of membrane peptides and proteins in well-aligned membranes with spin-labeled EPR spectroscopy.
In this study, two modified TOAC-labeled AChR M2δ peptides, TOAC1 AChR and TOAC18 AChR, were incorporated into magnetically aligned phospholipid bilayers where Glu1 and Leu18 of AChR M2 were replaced with TOAC, respectively (Fig. 1(A)). The principle z-axis of the spin label is spatially analogous to the 15N chemical shift tensor, σ33, and should give complementary orientation-dependent information about the peptide. Therefore, if we know the orientation of the bilayer normal (n) with respect to B0, then the orientation-dependent hyperfine splitting from the aligned spin-labeled EPR spectra will reveal the direction of the z-axis of TOAC with respect to B0, and the orientation of the helical axis (h) with respect to n can also be determined directly from the hyperfine splitting due to the spatial relationship between the z-axis and h (Fig. 1(B) and 1(C)).
Figure 1.

(A) Schematic showing the amino acid sequences of the channel-forming transmembrane domain (M2 domain, δ subunit) of the TOAC1 AChR and TOAC18 AChR peptide, where τ is the TOAC spin label. (B) Schematic showing TOAC18 AChR as a linear α-helical peptide with the principal axes of the TOAC spin label moiety being labeled as follows: the z-axis is directed along the p–orbital, the x-axis is directed along the N-O bond and the y-axis is perpendicular to the other axes. (C) The peptide is shown in the transmembrane orientation, where h is nearly collinear (helical tilt of 12°) with the normal to the phospholipids bilayers n based on 15N solid-state NMR studies.
2. Experimental Section
2.1. Materials
1,2-dihexanoyl-sn-glycero-3-phosphatidylcholine (DHPC), 1,2-dimyristoyl-sn-glycero-3- phosphatidylcholine (DMPC), and 1,2-dimyristoyl-s n-glycero-3-phosphoethanolamine-N-[poly(ethylene glycol) 2000] (PEG2000-PE) were purchased from Avanti Polar Lipids (Alabaster, AL). Triethylamine (TEA), 30% ammonium hydroxide (NH3(aq)), triisopropylsilane (TIS), anisole, hexafluoroisopropanol (HFIP), thulium (III) chloride hexahydrate (Tm3+), dysprosium (III) chloride hexahydrate (Dy3+), and HEPES buffer were obtained from Sigma-Aldrich (St. Louis, MO). Cholesterol was obtained from Avocado Research Chemicals (Ward Hill, MA). 2,2,6,6-tetramethylpiperidine-1-oxyl-4-amino-4-carboxylic acid (TOAC) was purchased from Acros Organics (Pittsburgh, PA). 9-fluorenylmethyl-oxycarbonyl-O-succinimide (Fmoc-OSu), Fmoc-protected amino acids, 2-(6-chloro-1H-benzotriazole-1-yl)-1,1,3,3-tetramethyluronium hexafluorophosphate (HCTU), and Fmoc-Arginine(Pbf)-NovaSyn TGA resin were purchased from Novabiochem (La Jolla, CA). Trifluoroacetic acid (TFA), 1-hydroxybenzo-triazole (HOBt), diisopropylethylamine (DIEA), N-methylpyrolidone (NMP), dichloromethane (DCM), and acetic anhydride (Ac2O) were purchased from Applied Biosystems Inc. (Foster City, CA).
2.2. Synthesis and Purification of TOAC-Labeled AChR M2δ
Solid-phase peptide synthesis using an Fmoc-protection strategy was performed on a 433A Peptide Synthesizer from Applied Biosystems Inc. (Foster City, CA) to synthesize the model membrane peptide TOAC18 AchR using the channel-forming transmembrane domain (AChR M2 domain, δsubunit) of T.californica nicotinic acetylcholine receptor (AChR M2) as a template. The amino acid sequences of TOAC1 AChR and TOAC18 AChR are given in Fig. 1. The peptide synthesizer was equipped with a UV detector (wavelength set to 301 nm) to monitor the Fmoc removal from the N-terminus of the growing peptide. The FastFmoc chemistry-0.1 mmol protocol provided in the SynthAssist 2.0 software (Applied Biosystems Inc., Foster City, CA) was modified by our lab to optimize the yield of the synthesis and allow for customized functionality (i.e., double coupling, increased coupling times, incorporating unnatural amino acids, etc.). An appropriate amount of Fmoc-Arginine(Pbf)-NovaSyn TGA resin (substitution number = 0.22 g resin/mmol peptide) was used to synthesize 0.1 mmol of peptide (based on a theoretical yield of 100%). All amino acids were purchased as Fmoc-protected with chemically sensitive side-chain residues being chemically modified (side-chain protected) to minimize any side reactions.
A cleavage mixture of TFA/TIS/anisole/H20 (8.5 mL/0.5 mL/0.5 mL/0.5 mL) was added to an appropriate amount of peptide-resin and allowed to react for 3 hrs to remove the side-chain protecting groups (except for the tert-butyl (tBu) moeity on Cys16) and cleave the peptide from the resin. The peptide was filtered to remove the resin beads and precipitated with cold methyl tert-butyl ether. The precipitated peptide was centrifuged, and the pellet was dried under dry N2 gas and vacuum desiccated overnight. Because TFA from the cleavage mixture reduces nitroxides to the hydroxylamine form, the spin-labeled peptides were treated with NH3 (aq) to reoxidize the spin label back to the nitroxide form. The spin-labeled peptide was dissolved in an isopropanol:water (50:50) mixture. A few drops of aqueous ammonia was added to regenerate the spin-label back to the nitroxide form. After this procedure, the peptide was lyophilized and stored at −20 °C. Also, the regeneration of the spin label was performed after HPLC purification in order to avoid reduction of the nitroxide due to the presence of TFA in the HPLC solvent.
Spin-labeled peptides were purified on a C18 reverse-phase semi preparative column (218TP1010, 10μm, 300 Å pore size, 10 × 250 mm, column volume of 19.5 mL) from Grace Vyadac, Inc. (Hesperia, CA). Solvent A consisted of 0.1% TFA in H20 and solvent B consisted of 50% n-propanol + 30% acetonitrile + 20% H2O + 0.1% TFA. The C18 column was interfaced with an AKTA Explorer 10S HPLC from Amersham Pharmacia Biotech (Piscataway, NJ) controlled by their Unicorn 3.0 software. The purification of the peptide was analyzed with mass spectrometry [matrix-assisted laser desorption/ionization time-of-flight (MALDI-TOF)].
2.3. TOAC1 and 18 AChR incorporation into bicelle samples
Appropriate volumes of DMPC, PEG2000-PE, and cholesterol were dispensed into a 25 mL pear-shaped flask (Flask 1) and DHPC and TOAC18 AChR peptide were dispensed into a second 25 mL pear-shaped flask (Flask 2). The mole ratios of DMPC/DHPC/PEG2000-PE/cholesterol/spin-labeled peptide were respectively 3.5/1.0/0.035/0.35/0.0035. The samples were dried with N2 (g) and vacuum desiccated overnight to remove all organic solvents. The following day an appropriate amount of HEPES buffer (100 mM) was added to Flask 2, vortexed until contents of Flask 2 were solublized (~15 min), contents from Flask 2 were transferred to Flask 1, vortexed until contents of Flask 1 were solubilized (~1 hr), and then sonicated for an additional 30 min at 4 °C. The final lipid concentration was 25 wt %. The samples were annealed by performing at least three freeze-thaw cycles using liquid nitrogen. A small volume of Tm3+(aq) or Dy3+(aq) was added to the bicelle samples (final lanthanide ion concentration was 20 mol % with respect to DMPC).
2.4. EPR spectroscopy
Samples were drawn into 1mm ID capillary tubes and sealed on both ends with Critoseal (Fisher Scientific, Florence, KY). The capillary tubes were placed into standard quartz EPR tubes (707-SQ-250M, Wilmad Glass, Buena, NY) that were filled with light mineral oil. Magnetic alignment was induced by placing the lanthanide-doped sample into the X-band EPR spectrometer at 298 K and raising the temperature to 318 K over 11 min while in the presence of an applied magnetic field (0.64 T), after which EPR spectra were taken at 318 K. A randomly dispersed sample was obtained by placing a Tm3+-doped sample into the spectrometer preheated to 318 K and an EPR spectrum was taken after thermal equilibration for ~ 10 min.
All EPR experiments were carried out on a Bruker EMX X-band CW-EPR spectrometer consisting of an ER 041XG microwave bridge and an ER 4119HS cavity that is coupled with an ER 4131VT nitrogen gas temperature controller (temperature stability of ± 0.2 °C). Each spin-labeled EPR spectrum was acquired by taking a 42-s field-swept scan (3370 G center field, 100 G sweep width, 9.434 GHz microwave frequency, 100 kHz modulation frequency, 1.0 G modulation amplitude, and a microwave power of 2 mW). All EPR spectra were processed on a 1 GHz G4 Macintosh computer utilizing the Igor software package (Wavemetrics, Lake Oswego, OR).
Simulations of EPR spectra and fits to experimental spectra of TOAC18 AChR were carried out by using the NLSL program41, using the MOMD model, in which the membranes are randomly oriented and all detectable rotational motion occurs relative to the membrane. The magnitude of the axially symmetric hyperfine splitting tensoral components was measured from the rigid limit spectrum obtained at −60 °C and the isotropic hyperfine splitting values from TOAC18 AChR in solution at 45 °C. Assuming the equivalence of Axx and Ayy, the hyperfine tensoral components were calculated as A = [5.6, 5.6, 33.30 G]. The principal values of the g-tensors g = [2.0096, 2.0064, 2.0027] of analogous nitroxide from the literature were used.42 For consistency, we used similar model, simulation parameters, notations, and fitting procedures as described previously in the literature.10, 11, 41
3. Results and Discussion
The TOAC1 and TOAC18 AChR M2δ peptides were synthesized separately using the amino acid sequence of the channel-forming transmembrane domain of the nicotinic acetylcholine receptor (AChR M2δ) as a template (Fig. 1(A)), where Glu1 and Leu18 were replaced with the TOAC spin label. Fig. 1(B) shows a model schematic of TOAC18 AChR with the corresponding principal axes of the spin label. Based on models derived from the crystal structure and EPR analysis of the TOAC-labeled peptide30, 43, it is inferred that the average orientation of the nitroxide p orbital is tilted 21° with respect to the helical axis (h), the x-axis is perpendicular to the helical axis, and the peptide rotates about the helical axis. A solid-state NMR PISEMA study of the AChR M2δ found the peptide to be transmembrane with a helical tilt of 12° with respect to the bilayer normal (Fig. 1(C)).2
The EPR spectra of TOAC1 AChR and TOAC18 AChR incorporated into randomly dispersed DMPC/DHPC lipid bilayers are shown in Figure 2. The corresponding CW-EPR spectra reveal dramatic differences in the nanosecond rotational dynamics, from the narrow linewidth spectrum of TOAC1 (dynamic disorder, 1.2 × 10⁻⁹ s; Fig. 2(A)) to the broad spectrum of the spin label at position 18 (Fig. 2(B)), indicating highly restricted motion (1.3 x 10⁻⁸ s). The rotational dynamics of the nitroxide were extracted from the spectra by fitting the data to a motional model of the nitroxide using the NLSL program.41
Figure 2.
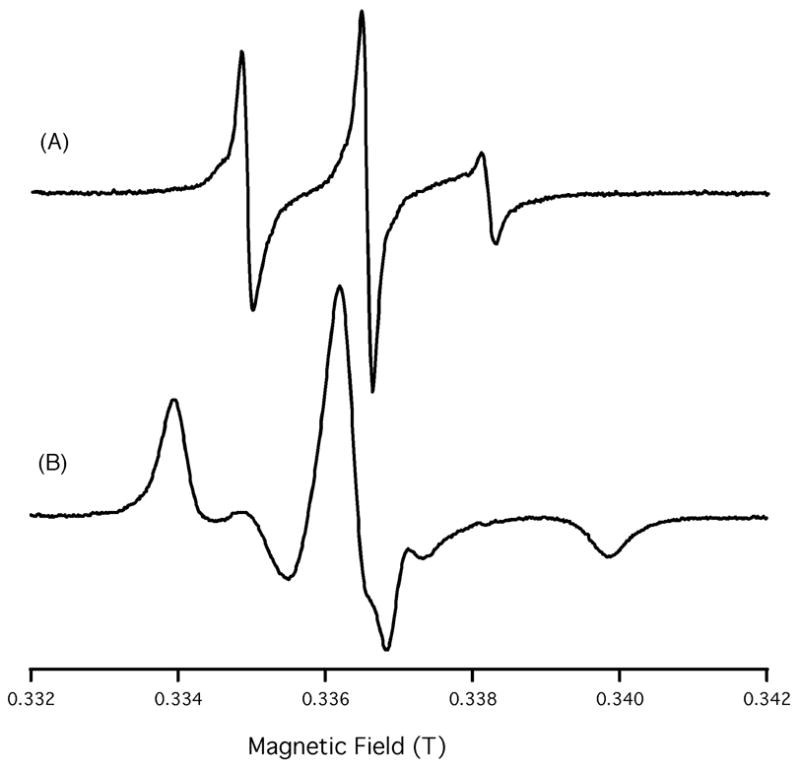
EPR spectra of (A) TOAC1 AChR and (B) TOAC18 AChR in randomly dispersed DMPC/DHPC bicelles. Spectra show the dramatic differences in the nanosecond rotational dynamics, from the narrow linewidth spectrum of TOAC1 (dynamic disorder, 1.2 × 10⁻⁹ s; (A)) to the broad spectrum of the spin label at position 18 (B), indicating highly restricted motion (1.3 ×10⁻⁸ s).
Figures 3(A) and 3(B) show spin-labeled EPR spectra of the TOAC18 AChR peptide incorporated into DMPC/DHPC bicelles that were magnetically aligned parallel (Tm3+-doped sample, n || Bo) and perpendicular (Dy3+-doped sample, n ⊥ Bo) with respect to the external magnetic field Bo. Clearly, the spectra indicate that the corresponding hyperfine splittings are orientation dependent. When the TOAC1 AChR peptide was incorporated into the same bicelle matrix no hyperfine orientation dependence was observed (data not shown). This is not surprising given the isotropic disordered nature of the N-terminus TOAC1 when compared to the more ordered TOAC18 peptide. For comparison, Figure 3(C) shows a broad powder pattern EPR spectrum from an unaligned sample that represents a random distribution of TOAC18 AChR in the bilayers.44, 45 In contrast, the magnetically aligned samples exhibit well-aligned EPR spectra (similar to a “single crystal”) with the observed hyperfine splitting (Aexp) being strongly orientation-dependent with narrower linewidths (Figs. 3(A) and (B)). The observed hyperfine splitting values indicate that the motionally averaged z-axis of the nitroxide is oriented nearly parallel to the bilayer normal.
Figure 3.

Spin-labeled X-band EPR spectra of TOAC18 AChR incorporated into either magnetically aligned (A and B) or randomly dispersed (C) phospholipid bilayers. For magnetically aligned samples, the average normal to the phospholipid bilayers, n, were either parallel (A) or perpendicular (B) to the applied magnetic field, B0.
The lineshapes and orientation-dependent hyperfine splitting behavior exhibited in Figure 3 are very similar to the spin probe, 5-doxylstearic acid (5-DSA) incorporated into magnetically aligned bicelles. 16 5-DSA rapidly rotates about its long molecular axis (l), which is collinear with the normal of the phospholipid bilayers (l || n) and the z-axis of the spin label. The z-axis of TOAC in an α-helix makes a small angle with the long helical axis30, so that finding the z-axis nearly parallel to the bilayer normal immediately implies that the AChR-M2δ is transmembrane. This agrees well with the known structure of AChR-M2δ. 2, 46 Thus, these results show that EPR spectroscopy can be used as a simple qualitative tool for determining the topology of integral membrane proteins/peptides.
3.1. Measurement of Director tilt
The magnetic framework of the nitroxide spin labels used in this study is defined such that the x-axis is extended along the direction of the N-O bond, the z-axis lies along the p-orbital of the NO bond containing the unpaired electron, and the y-axis is perpendicular to the other axes. The magnitude of the axially symmetric hyperfine tensoral components are Axx ≈ Ayy ≪ Azz, where Axx, Ayy and Azz are the tensoral components directed along the x-, y- and z- axes of the spin label, respectively. For an axially symmetric system and using this approximation (Axx ≈ Ayy) the following expressions can be written for A|| and A⊥ tensors44:
| (1) |
where θ is the angle between the z-axis of the nitroxide and the director axis ZD (the symmetry axis of the anisotropic motion). When there is no motion present in the system, θ is negligible. Therefore, Azz (A||) is the experimentally observed hyperfine splitting value if the magnetic field is applied along the z-axis. In the presence of motion, A|| is less than Azz.
In aligned media A|| is the experimentally observed hyperfine splitting if the magnetic field is applied along the axis of motional averaging (director axis, ZD). Conversely, if the magnetic field is applied perpendicular to the director axis, the observed hyperfine splitting value is A⊥. In general, the following equation can be used when the magnetic field makes an angle (ψ) with the axis of motional averaging (ZD)44:
| (2) |
The hyperfine tensoral components were measured as Azz = 33.30 G, Ayy = 5.6 G, and Axx = 5.6 G. According to Eqn. 1 when no motion is present in the system, A|| and A⊥ values are expected to be 33.3 and 5.6 G, respectively. However, the observed A|| and A⊥ from the powder spectrum are 29.7 and 7.1, respectively, indicating the presence of residual motion in the system. Therefore, in the parallel-aligned bicelle samples (i.e. n || B0), when the magnetic field is applied along the director axis (ψ= 0°), the observed hyperfine splitting value should be at a maximum (Aexp ≅ A||= 29.7 G) according to Eqn.2. From the observed hyperfine splitting values of the aligned sample (Fig. 3 (A)), it can be inferred that the director axis must be nearly parallel to Bo (Aexp = 26.6 G) for the Tm3+-doped samples (n || Bo). As discussed previously, the hyperfine splitting values depend on the orientation of the director axis with respect to the external magnetic field. The deviation of 3.1 G (29.7 – 26.6 G) for the parallel-aligned spectrum (Fig. 3 (A)) suggests that the director axis is not perfectly collinear with the magnetic field (B0) and may be accounted for by a small degree of the director tilt (ψ). The director tilt angle ψ with respect to the magnetic field B0 for the parallel-aligned sample is equal to the director tilt angle ζ with respect to the bilayer normal n, which was introduced previously (Figure 4).10, 11 Hence, according to Eqn.2 the director tilt angle (ψexp=ζ) is found to be 27±4°.
Figure 4.

Side view scheme (A) and top view structure (B) of AChR-M2δ in the parallel-aligned bilayers show the relationship between the director tilt angle (ζ) as an angle between n and the director axis ZD, helical tilt angle (φ) as an angle between n and the helical axis h, and the angle of 21° between h and ZD. The top view figure (B) shows that the plane (n, h) is nearly orthogonal to the (h, ZD) plane.
3.2. EPR spectral simulations
To further confirm our results, simulations of the EPR spectra using the Microscopic Order Macroscopic Disorder (MOMD) NLSL formalism developed by Freed and co-workers was conducted.41 The case of non-zero director tilt angle ζ for the simulations was introduced in the literature10, 11, where the integration over all the azimuthal orientations was taken to simulate EPR spectra for the arbitrary orientation of the magnetic field with respect to the bilayer normal. For consistency, we carefully followed the simulation procedures established in the literature (comparable model system, simulation parameters, and notations). The fits were performed with the rotational diffusion rate (R|| and R⊥), the coefficient of ordering potential, and the director tilt angle (ψ) as the input parameters. The principle hyperfine tensoral values used for the simulation were experimentally determined as A=[5.6, 5.6, 33.3 G], the g-components g=[2.0096, 2.0064, 2.0027] were taken from the literature.42 The rotational correlation time was obtained from the rotational diffusion rate using the expression ( ).45 Karim, et.al have shown that the motion of the TOAC spin label attached to the transmembrane helix of phospholamban can be characterized by a single mode of motion and order parameter (S).40 We used the same approach here and we first simulated the randomly dispersed spectrum to find the rotational diffusion tensor components and coefficients for the orienting potential (Fig. S1; See Supporting Information). The perpendicularly aligned spectrum was simulated using the same parameters. For the parallel-aligned spectrum, a slightly slower rotational diffusion and smaller order parameter were used. This is not surprising because the 15N linewidths from 15N-labeled proteins are broader in parallel aligned bicelle spectra, when compared to perpendicular aligned spectra suggesting slower dynamics.9, 14 The presence of Tm3+ in the flipped bicelles could be causing the slower dynamics. The parameters of the simulations were S=0.72±0.03, τ=1.3×10⁻⁸ s (randomly dispersed and perpendicularly aligned samples) and S=0.64±0.03, τ=2.3×10⁻⁸ s (parallel aligned sample). It is well known that it is hard to unambiguously resolve contributions from both the correlation time and the order parameters using simulations of EPR spectra at a single frequency. Thus, by performing these experiments at a higher frequency such as a Q-band these dynamic parameters can be obtained more accurately. However, for the results presented in this paper, a small change in the tilt angle (±5°) has a pronounced effect on the EPR spectrum that cannot be compensated by changes in the S or τ values. The best fit was obtained for the director tilt angle ζ of 30±5°, that confirms the experimental director tilt angle ζexp=27° derived directly from the hyperfine splitting values.
3.3. Determination of the Helical Tilt
From crystal structures of α-helical TOAC incorporated peptides, it is inferred that the axis of motional averaging (ZD) is 21° with respect to the helical axis.30, 43 The same degree of deviation (~21°) of the director axis with respect to the helical axis for TOAC-18 labeled AChR was determined using the MOLMOL program.47 The AChR M2δ peptide is rotated around its helix long axis such that the pore-lining residues Glu 1, Ser 8, Val 15, Leu 18, and Gln 22 face the N-terminal side of the membrane, which is assigned to be intracellular.2, 48–50 It implies that the plane (n, h) of the helical axis and bilayer normal is nearly orthogonal to the plane (h, ZD) of the helical axis and director axis (Fig. 4). By taking into account this angle (21°), the director tilt angle (27°) gleaned from the EPR spectrum of the parallel-aligned samples, and unitary transformations involving three Euler angles (α,β,γ), we calculated a helix tilt angle of 14° with respect to the membrane normal. This is in good agreement with the 12° helical tilt determined by 15N solid-state NMR spectroscopy 2 and a 14–15° tilt obtained from molecular dynamics studies.51 A full description of the procedure for the helical tilt calculation is given in the Supporting information. These results indicate that the angular dependent hyperfine splitting of magnetically aligned EPR spectra can be used to determine the helical tilt of an integral membrane protein relative to the bilayer normal. In aligned 15N SSNMR studies, only one 15N labeled amide will yield an estimate of the helical tilt and more data points are needed for an accurate tilt measurement. In a similar fashion, the helical tilt can be determined more accurately by placing TOAC spin labels at several positions with this technique. Recent studies have demonstrated that solid-state NMR spectra of aligned samples is well suited for answering questions about the deviation in the helical tilt angle with varying bilayers thickness due to hydrophobic mismatch. 52, 53 In a similar fashion, our new EPR methodology can be easily used to probe helical tilt angles due to hydrophobic mismatch with different phospholipids.
4. Conclusions
This study details a new development for spin-labeled EPR spectroscopy to obtain pertinent structural information of a peptide inside a membrane. The helical tilt can be directly calculated from the corresponding aligned EPR spectra, without conducting spectral simulations. EPR spectroscopy is approximately a thousand fold more sensitive than NMR spectroscopy. Even at much lower protein/peptide concentrations (μg scale for EPR and mg scale for NMR), the high S/N ratio obtainable via EPR spectroscopy (one scan, 30 sec) when compared to solid-state NMR spectroscopy (10,000 scans, 14 hours) will indicate the membrane peptide orientation with respect to the lipid bilayer instantaneously. Thus, the data presented here indicate that this new structural biology technique is inexpensive and more efficient than comparable solid-state NMR spectroscopic methods to determine the topology/orientation of integral membrane proteins/peptides within the lipid bilayer. Currently, the insertion of TOAC is limited to peptides and small proteins (< 60 aminoacids) using Fmoc solid phase peptide synthesis. However, recent studies have indicated the possibility for site-specific insertion of unnatural fluorescent or spin labeled amino acids in proteins via tRNA suppressor techniques.54–57 Thus, for the first time the bicelle alignment technique in connection with TOAC-EPR spectroscopy holds a great deal of promise for probing the structure of integral membrane peptides and potentially proteins.
Supplementary Material
Simulated EPR spectra and the full description of the procedure for the helical tilt calculation.
Acknowledgments
We would like to thank Dr. David Cafiso, Dr. Jimmy Felix, and Ethan Karp for help with this manuscript. National Institutes of Health Grant (GM60259-01) and National Science Foundation CAREER Award (CHE-0133433) supported this work.
References
- 1.Opella SJ. Nat Struct Biol. 1997;4:845–848. [PubMed] [Google Scholar]
- 2.Opella SJ, Marassi FM, Gesell JJ, Valente AP, Kim Y, Oblatt-Montal M, Montal M. Nat Struct Biol. 1999;6:374–379. doi: 10.1038/7610. [DOI] [PMC free article] [PubMed] [Google Scholar]
- 3.Prestegard JH. Nat Struct Biol. 1998;5:517–522. doi: 10.1038/756. [DOI] [PubMed] [Google Scholar]
- 4.Tjandra N, Bax A. Science. 1997;278:1111–1114. doi: 10.1126/science.278.5340.1111. [DOI] [PubMed] [Google Scholar]
- 5.Howard KP, Opella SJ. J Magn Reson B. 1996;112:91–94. doi: 10.1006/jmrb.1996.0116. [DOI] [PubMed] [Google Scholar]
- 6.Marassi FM, Ramamoorthy A, Opella SJ. Proc Natl Acad Sci USA. 1997;94:8551–8556. doi: 10.1073/pnas.94.16.8551. [DOI] [PMC free article] [PubMed] [Google Scholar]
- 7.Opella SJ, Nevzorov A, Mesieh MF, Marassi FM. Biochem Cell Biol. 2002;80:597–604. doi: 10.1139/o02-154. [DOI] [PMC free article] [PubMed] [Google Scholar]
- 8.Opella SJ, Marassi FM. Chem Rev. 2004;104:3587–3606. doi: 10.1021/cr0304121. [DOI] [PMC free article] [PubMed] [Google Scholar]
- 9.De Angelis AA, Nevzorov AA, Park SH, Howell SC, Mrse AA, Opella SJ. J Am Chem Soc. 2004;126:15340–15341. doi: 10.1021/ja045631y. [DOI] [PubMed] [Google Scholar]
- 10.Jacobsen K, Oga S, Hubbell WL, Risse T. Biophys J. 2005;88:4351–4365. doi: 10.1529/biophysj.105.059725. [DOI] [PMC free article] [PubMed] [Google Scholar]
- 11.Risse T, Hubbell WL, Isas JM, Haigler HT. Phys Rev Lett. 2003;91:188101. doi: 10.1103/PhysRevLett.91.188101. [DOI] [PubMed] [Google Scholar]
- 12.Sanders CR, Landis GC. Biochemistry. 1995;34:4030–4040. doi: 10.1021/bi00012a022. [DOI] [PubMed] [Google Scholar]
- 13.Sanders CR, Prosser RS. Structure. 1998;6:1227–1234. doi: 10.1016/s0969-2126(98)00123-3. [DOI] [PubMed] [Google Scholar]
- 14.Park SH, Mrse AA, Nevzorov AA, De Angelis AA, Opella SJ. J Magn Reson. 2006;178:162–165. doi: 10.1016/j.jmr.2005.08.008. [DOI] [PubMed] [Google Scholar]
- 15.De Angelis AA, Jones DH, Grant CV, Park SH, Mesleh MF, Opella SJ. NMR experiments on aligned samples of membrane proteins. Methods Enzymol. 2005;394:350–382. doi: 10.1016/S0076-6879(05)94014-7. [DOI] [PubMed] [Google Scholar]
- 16.Cardon TB, Tiburu EK, Padmanabhan A, Howard KP, Lorigan GA. J Am Chem Soc. 2001;123:2913–2914. doi: 10.1021/ja005574i. [DOI] [PubMed] [Google Scholar]
- 17.Garber SM, Lorigan GA, Howard KP. J Am Chem Soc. 1999;121:3240–3241. [Google Scholar]
- 18.Mangels ML, Cardon TB, Harper AC, Howard KP, Lorigan GA. J Am Chem Soc. 2000;122:7052–7058. [Google Scholar]
- 19.Prosser RS, Hunt SA, DiNatale JA, Vold RR. J Am Chem Soc. 1996;118:269–270. [Google Scholar]
- 20.Prosser RS, Volkov VB, Shiyanovskaya IV. Biophys J. 1998;75:2163–2169. doi: 10.1016/S0006-3495(98)77659-3. [DOI] [PMC free article] [PubMed] [Google Scholar]
- 21.Conti-Tronconi BM, Gotti CM, Hunkapiller MW, Raftery MA. Science. 1982;218:1227–1229. doi: 10.1126/science.7146904. [DOI] [PubMed] [Google Scholar]
- 22.Raftery MA, Hunkapiller MW, Strader CD, Hood LE. Science. 1980;208:1454–1457. doi: 10.1126/science.7384786. [DOI] [PubMed] [Google Scholar]
- 23.Cuello LG, Cortes DM, Perozo E. Science. 2004;306:491–495. doi: 10.1126/science.1101373. [DOI] [PubMed] [Google Scholar]
- 24.Hubbell WL, Cafiso DS, Altenbach C. Nat Struct Biol. 2000;7:735–739. doi: 10.1038/78956. [DOI] [PubMed] [Google Scholar]
- 25.Kim CS, Kweon DH, Shin YK. Biochemistry. 2002;41:10928–10933. doi: 10.1021/bi026266v. [DOI] [PubMed] [Google Scholar]
- 26.Langen R, Isas JM, Hubbell WL, Haigler HT. Proc Natl Acad Sci USA. 1998;95:14060–14065. doi: 10.1073/pnas.95.24.14060. [DOI] [PMC free article] [PubMed] [Google Scholar]
- 27.Liu YS, Sompornpisut P, Perozo E. Nat Struct Biol. 2001;8:883–887. doi: 10.1038/nsb1001-883. [DOI] [PubMed] [Google Scholar]
- 28.Macosko JC, Kim CH, Shin YK. J Mol Biol. 1997;267:1139–1148. doi: 10.1006/jmbi.1997.0931. [DOI] [PubMed] [Google Scholar]
- 29.Perozo E, Cortes DM, Sompornpisut P, Kloda A, Martinac B. Nature. 2002;418:942–948. doi: 10.1038/nature00992. [DOI] [PubMed] [Google Scholar]
- 30.Flippen-Anderson JL, George C, Valle G, Valente E, Bianco A, Formaggio F, Crisma M, Toniolo C. Int J Peptide Protein Res. 1996;47:231–238. doi: 10.1111/j.1399-3011.1996.tb01350.x. [DOI] [PubMed] [Google Scholar]
- 31.Marchetto R, Schreier S, Nakaie CR. J Am Chem Soc. 1993;115:11042–11043. [Google Scholar]
- 32.Merrifield B. Concept and early development of solid-phase peptide synthesis. Methods Enzymol. 1997;289:3–13. doi: 10.1016/s0076-6879(97)89040-4. [DOI] [PubMed] [Google Scholar]
- 33.Bettio A, Gutewort V, Poppi A, Dinger MC, Zschornig O, Arnold K, Toniolo C, Beck-Sickinger AG. J Pept Sci. 2002;8:671–682. doi: 10.1002/psc.428. [DOI] [PubMed] [Google Scholar]
- 34.McNulty JC, Thompson DA, Carrasco MR, Millhauser GL. FEBS Lett. 2002;529:243–248. doi: 10.1016/s0014-5793(02)03352-5. [DOI] [PubMed] [Google Scholar]
- 35.Bui TTT, Formaggio F, Crisma M, Monaco V, Toniolo C, Hussain R, Siligardi G. J Chem Soc Perkin Trans 2. 2000;5:1043–1046. [Google Scholar]
- 36.Monaco V, Formaggio F, Crisma M, Toniolo C, Hanson P, Millhauser GL. Biopolymers. 1999;50:239–253. doi: 10.1002/(SICI)1097-0282(199909)50:3<239::AID-BIP2>3.0.CO;2-O. [DOI] [PubMed] [Google Scholar]
- 37.Monaco V, Formaggio F, Crisma M, Toniolo C, Hanson P, Millhauser G, George C, Deschamps JR, Flippen-Anderson JL. Bioorg Med Chem. 1999;7:119–131. doi: 10.1016/s0968-0896(98)00220-x. [DOI] [PubMed] [Google Scholar]
- 38.Victor KG, Cafiso DS. Biophy J. 2001;81:2241–2250. doi: 10.1016/S0006-3495(01)75871-7. [DOI] [PMC free article] [PubMed] [Google Scholar]
- 39.Zamoon J, Nitu F, Karim C, Thomas DD, Veglia G. Proc Natl Acad Sci USA. 2005;102:4747–4752. doi: 10.1073/pnas.0406039102. [DOI] [PMC free article] [PubMed] [Google Scholar]
- 40.Karim CB, Kirby TL, Zhang ZW, Nesmelov Y, Thomas DD. Proc Natl Acad Sci USA. 2004;101:14437–14442. doi: 10.1073/pnas.0402801101. [DOI] [PMC free article] [PubMed] [Google Scholar]
- 41.Budil DE, Lee S, Saxena S, Freed JH. J Magn Reson. 1996;120:155–189. [Google Scholar]
- 42.Capiomont A, Chion B, Lajzerowicz-Bonneteau J, Lemaire H. J Chem Phys. 1974;60:2530–2535. [Google Scholar]
- 43.Hanson P, Anderson DJ, Martinez G, Millhauser G, Formaggio F, Crisma M, Toniolo C, Vita C. Mol Phys. 1998;95:957–966. [Google Scholar]
- 44.Seelig J. Anisotropic motion in liquid crystalline structures. In: Berliner LJ, editor. Spin Labeling Theory and Applications. Academic Press; New York: 1976. pp. 373–410. [Google Scholar]
- 45.Freed JH. Theory of slow tumbling ESR spectra for nitroxides. In: Berliner LJ, editor. Spin Labeling Theory and Applications. Academic Press; New York: 1976. pp. 53–130. [Google Scholar]
- 46.Unwin N. Nature. 1995;373:37–43. doi: 10.1038/373037a0. [DOI] [PubMed] [Google Scholar]
- 47.Koradi R, Billeter M, Wuthrich K. J Mol Graphics. 1996;14:51–55. doi: 10.1016/0263-7855(96)00009-4. [DOI] [PubMed] [Google Scholar]
- 48.Colquhoun D, Sakmann B. Neuron. 1998;20:381–387. doi: 10.1016/s0896-6273(00)80982-4. [DOI] [PubMed] [Google Scholar]
- 49.Lena C, Changeux JP. Curr Opin Neurobiol. 1997;7:674–682. doi: 10.1016/s0959-4388(97)80088-8. [DOI] [PubMed] [Google Scholar]
- 50.Oiki S, Madison V, Montal M. Proteins. 1990;8:226–236. doi: 10.1002/prot.340080305. [DOI] [PubMed] [Google Scholar]
- 51.Kessel A, Shental-Bechor D, Haliloglu T, Ben-Tal N. Biophys J. 2003;85:3431–3444. doi: 10.1016/S0006-3495(03)74765-1. [DOI] [PMC free article] [PubMed] [Google Scholar]
- 52.Marcotte I, Belanger A, Auger M. Chem Phys Lipids. 2006;139:137–149. doi: 10.1016/j.chemphyslip.2005.12.002. [DOI] [PubMed] [Google Scholar]
- 53.Park SH, Opella SJ. J Mol Biol. 2005;350:310–318. doi: 10.1016/j.jmb.2005.05.004. [DOI] [PubMed] [Google Scholar]
- 54.Becker CFW, Lausecker K, Balog M, Kalai T, Hideg K, Steinhoff HJ, Engelhard M. Magn Reson Chem. 2005;43:S34–S39. doi: 10.1002/mrc.1688. [DOI] [PubMed] [Google Scholar]
- 55.England PM. Biochemistry. 2004;43:11623–11629. doi: 10.1021/bi048862q. [DOI] [PubMed] [Google Scholar]
- 56.Shafer AM, Kalai T, Liu SQB, Hideg K, Voss JC. Biochemistry. 2004;43:8470–8482. doi: 10.1021/bi035542i. [DOI] [PubMed] [Google Scholar]
- 57.Zhang ZW, Smith BAC, Wang L, Brock A, Cho C, Schultz PG. Biochemistry. 2003;42:6735–6746. doi: 10.1021/bi0300231. [DOI] [PubMed] [Google Scholar]
Associated Data
This section collects any data citations, data availability statements, or supplementary materials included in this article.
Supplementary Materials
Simulated EPR spectra and the full description of the procedure for the helical tilt calculation.