

Abstract
It is established that aminoguanidine (AG), diaminoguanidine (DAG), and NG-amino-L-arginine (NAA) are metabolism-based inactivators of the three major isoforms of nitric oxide synthase (NOS). In the case of neuronal NOS (nNOS), heme alteration is known to be a major cause of inactivation although the exact mechanism by which this occurs is not well understood. We show here by the use of LC/MS/MS techniques that AG, DAG, and NAA are metabolized by nNOS to products with corresponding mass ions at m/z of 45.2, 60.2, and 160.0, respectively. These results are consistent with the loss of a hydrazine moiety from each inactivator. These findings are confirmed by exact mass measurements and comparison to authentic standards in the case of the products for NAA and AG, respectively. Moreover, the major dissociable heme product that was formed during inactivation of nNOS by AG, DAG, and NAA had molecular ions at m/z 660.2, 675.2, and 775.3, respectively. These results are consistent with an adduct of heme and inactivator minus a hydrazine moiety. In support of this, MS/MS studies reveal a fragment ion of heme in each case. With the use of 14C-labeled heme, we also show that in the case of AG, the dissociable heme adduct accounts for approximately one-half of the heme that is altered. In addition, we employ a software-based differential metabolic profiling method by substracting LC/MS data sets derived from samples that contained nNOS from those that did not contain the enzyme to search for products and substrates in complex reaction mixtures. The metabolic profiling method established in this study can be used as a general tool to search for substrates and products of enzyme systems, including the drug metabolizing liver microsomal P450 cytochromes. We propose that the metabolism-based inactivation of nNOS by AG, DAG, and NAA occurs through oxidative removal of the hydrazine group and the formation of a radical intermediate that forms stable products after H-atom abstraction or reacts with the heme prosthetic moiety and inactivates nNOS.
INTRODUCTION
Nitric oxide synthases (NOS)1 are P450-like hemoprotein enzymes that catalyze the conversion of L-arginine to citrulline and nitric oxide by a reaction that requires NADPH and molecular oxygen (1–4). There are three main isoforms of NOS: neuronal (nNOS), macrophage or inducible (iNOS), and endothelial (eNOS). The isoform-selective inhibition of NOS has been of intense interest due to the various physiological and pathological actions of nitric oxide attributable to the three isoforms (for reviews see (5–12)). Aminoguanidine (AG), which contains a guanidino moiety and a hydrazine group is structurally one of the simplest of these inhibitors. AG is thought to be of potential use in diabetes (11,13) and it was first reported by Corbett et al. (14) to inhibit iNOS in a selective manner. AG is an isoform selective mechanism-based inactivator of iNOS in vitro although nNOS and eNOS are also inactivated (15). Diaminoguanidine (DAG), which is structurally related to AG, is also a mechanism-based inactivator of all three isoforms of NOS, although it exhibits less selectivity for iNOS (16). NG-amino-L-arginine (NAA), which is an arginine analog that contains a hydrazine group on the guanidine moiety has also been described previously as a mechanism-based inactivator of all three NOS isoforms in vitro (16). Based on the reported Ki values, however, nNOS (Ki = 0.3 μM) appears to be more sensitive to inactivation by NAA compared to eNOS (Ki = 2.5 μM) or iNOS (Ki = 3 μM).
AG, DAG, and NAA cause the alteration of the heme prosthetic group as well as the protein of NOS (17–21). In the case of nNOS, it was shown that the AG-mediated alteration of the prosthetic heme is a major cause of the loss in enzyme activity (17). The prosthetic heme of nNOS is altered, in part, to a dissociable heme adduct as well as a heme adduct that is irreversibly bound to the protein (17). For NAA, the major dissociable heme product formed has a mass of 775.3, which is consistent with the mass of heme plus NAA minus a hydrazine group (21). This finding led us to question if the structurally related AG and DAG also give rise to similarly altered heme adducts. Moreover, we sought to further define the metabolic fate of AG, DAG, and NAA in the hopes of learning more about NOS catalysis. In the current study, we show that nNOS metabolizes AG, DAG, and NAA to stable products that have lost their respective hydrazine moieties. Interestingly, the masses of the dissociable heme adducts formed after treatment of nNOS with AG, DAG, or NAA are also consistent with adduction of inactivator to the heme after loss of a hydrazine moiety. Thus, we propose a common reaction mechanism involving the oxidative metabolism of these hydrazine-based inactivators to form a radical on the guanidino carbon that leads, in part, to product formation or, in part, to heme adduct formation.
MATERIALS AND METHODS
Materials
All reagents were purchased from either Aldrich (Milwaukee, WI) or Sigma (St. Louis, MO) unless stated otherwise. NAA was purchased from Alexis Biochemicals (San Diego, CA). (6R)-5,6,7,8-Tetrahydro-L-biopterin (tetrahydrobiopterin) was purchased from Dr. Schirck’s Laboratory (Jona, Switzerland). [14C]-labeled heme (130 mCi/mmol) was purchased from the University of Leeds Industrial Services (Leeds, England). Solvents used for LC/MS were purchased from Burdick and Jackson (Muskegon, MI).
Preparation of nNOS
nNOS was overexpressed in Sf9 insect cells as previously described (22). Oxyhemoglobin (25 μM) was added as a source of heme during expression. Cells were harvested, suspended in 1 volume of 10 mM Hepes, pH 7.5, containing 320 mM sucrose, 100 μM EDTA, 0.1 mM DTT, 10 μg/mL trypsin inhibitor, 100 μM leupeptin, 0.5 μM pepstatin A, 2 μg/mL of aprotinin, 3 mM phenylmethanesulphonyl fluoride, and 10 μM tetrahydrobiopterin, and ruptured by Dounce homogenization. Lysates from infected Sf9 cells (8 × 10⁹) were centrifuged at 100,000g for 1 h. The supernatant fraction was loaded onto a 2′5′-ADP Sepharose column (8 mL) and the nNOS was affinity purified as described (22), except that 10 mM 2′ AMP in high salt buffer was used to elute the protein. The nNOS-containing fractions were loaded onto a Sephacryl S-300 high resolution gel filtration column (2.6 × 100 cm), which was equilibrated with 50 mM Tris-HCl, pH 7.4, containing 100 mM NaCl, 10% glycerol, 0.1 mM EDTA, 0.1 mM DTT, and 10 μM tetrahydrobiopterin as previously described (23). The nNOS containing fractions were concentrated with the use of a Centriplus concentrator and stored at −80°C.
Treatment of nNOS with AG, DAG, or NAA
nNOS (0.5 μM) was added to a reaction mixture of 40 mM potassium phosphate, pH 7.4, containing 0.4 mM NADP+, 10 mM glucose-6-phosphate, 1 unit/mL glucose-6-phosphate dehydrogenase, 0.2 mM CaCl2, 500 unit/mL superoxide dismutase, 100 unit/mL catalase, 80 μg/mL calmodulin, 100 μM tetrahydrobiopterin, and AG (1 mM), DAG (500 μM) or NAA (100 μM) in a total volume of 180 μL. The reaction mixture was incubated at 30°C for 1 h. As a control, the reaction mixture was incubated as above except that nNOS was omitted.
Detection and characterization of AG, DAG, or NAA metabolites by LC/MS
LC/MS analysis was performed with the use of a ThermoFinnigan (San Jose, CA) Surveyor HPLC system interfaced to a TSQ Quantum Ultra AM mass spectrometer equipped with an IonMax electrospray ionization source. The electrospray ionization source was tuned with L-arginine and the optimized conditions were as follows: 4000 V for spray voltage, 350°C for capillary temperature, and a sheath gas pressure of 20 (arbitrary units). The mass spectrometer was set to acquire positive ions in Q3MS mode, scanning from either m/z 30–500 or m/z 80–1500 in 1.0 second, depending on the mass of the predicted metabolites. Quadrupole resolution was set to 0.7 daltons (full width at half maximum). Microscan signal averaging was not used. The reaction mixtures containing treated nNOS were placed in a Centricon (Amicon, 10,000 molecular weight cut-off; Millipore Corporation, Bedford, MA) filter and spun at 3000g for 20 min at 4°C. An aliquot (5 μL) of the filtrate was injected onto the HPLC hydrophilic interaction column (Atlantis HILIC silica, 2.1 × 150 mm; Waters, Milford, MA) equilibrated with 5% solvent A (10 mM ammonium formate) and 95% solvent B (0.2% acetic acid in acetonitrile) at a flow rate of 0.2 mL/min. After 2 min, a linear gradient was run to 70% solvent A over 13 min, followed by 2 min of isocratic flow at 70% solvent A.
The mass spectral data were analyzed for product formation by finding differences amongst the treated and untreated samples with the use of Xcalibur software (ThermoFinnigan). The data files were first subtracted and then the spectral data over 1-min time periods were manually analyzed to discern differences over that region. All putative product ions determined by this method were then verified by analyzing the extracted ion chromatograms. We also utilized a trial version of MetAlign™ (Plant Research International, Wageningen, UR) software to analyze the LC/MS data sets. This software was used to perform baseline correction and absolute difference filtering as described by the manufacturer.
Accurate mass of the NAA metabolite was measured in the high resolution (0.1 Da FWHM) mode as described by ThermoFinnigan. Calibration of the mass analyzer was performed with polytyrosine–1, 3, 6 and polyethylene glycol. Internal calibration was achieved by concomitant infusion from 14.3 to 15.3 min of a lock mass solution containing 20 μM L-histidine ([M+H]+ = 156.0768) and L-arginine ([M+H]+ = 175.1190). The molecular formula of the NAA metabolite was obtained with the use of Xcalibur software.
Characterization of the dissociable heme products formed during inactivation of nNOS by AG, DAG, or NAA
LC/MS/MS was carried out with the use of a ThermoFinnigan LTQ linear ion trap mass spectrometer equipped with ThermoFinnigan Surveyor HPLC system. The electrospray ionization source was tuned on horse heart myoglobin and the optimized conditions were as follows: 4000 V for spray voltage, 250°C for capillary temperature, 4.0 V for capillary voltage and 150 V for tube lens. The ion trap was operated in positive ion mode using the normal mass range and scan rate settings, and scanning from m/z 300–2000. Automatic gain control was enabled for a standard full scan MS. Microscan signal averaging was not used. Aliquots (15 μL) of reaction mixtures containing treated nNOS were injected onto a reverse phase HPLC column (XTerra MS C18, 2.1 × 150 mm; Waters, Milford, MA) equilibrated with 80% of solvent A (0.05% trifluoroacetic acid/0.05% formic acid) and 20% of solvent B (0.05% trifluoroacetic acid/0.05% formic acid in acetonitrile) at a flow rate of 0.3 mL/min. A linear gradient was run to 37% solvent B over 15 min, followed by a linear gradient to 44% solvent B over 13 min then a linear gradient to 100% solvent B over 4 min. The mass spectrometer was set up to perform data-dependent acquisition to obtain the molecular ion of the heme adduct as well as to measure the fragmentation of the molecular ions. For MS/MS studies the normalized collision energy was set to 35%.
Treatment of nNOS reconstituted with radiolabeled heme with AG and analysis of heme adducts
To prepare nNOS reconstituted with radiolabeled heme, nNOS was expressed and purified as described above except that oxyhemoglobin was not added during expression so that heme-deficient apo-nNOS was produced. The purified apo-nNOS (2 μM) was reconstituted as described (23). Specifically, the apo-nNOS was added to a mixture containing 100 μM BH4, 100 μM L-arginine, 200 unit/ml catalase, 20 unit/ml SOD, and 4 mM DTT in 50 mM Hepes, pH 7.4. The 14C-labeled heme (130 mCi/mmol) was dissolved in DMSO and added to the mixture to give a final concentration of 2.4 μM in heme with a DMSO concentration of 2.8 %. The mixture was incubated in the dark at room temperature for 2 h. To remove free heme the reconstituted nNOS[14C-heme] was purified with the use of 2′5′ADP-Sepharose as previously described (23), except that a high salt wash was omitted. The eluent was pooled and then concentrated with the use of a Centricon 10,000 molecular weight cut-off filter. The nNOS[14C-heme] preparation had NO synthase activity of 640 nmol/min/mg of protein and a heme content of 0.52 mol heme per mol of monomer. The activity of the reconstituted enzyme is about one-half of that found for the native enzyme of approximately 1100 nmol/min/mg protein (23). The activity of nNOS was measured by quantifying the NO-mediated oxidation of oxyhemoglobin to methemoglobin by a micro-titer based spectral assay as described (23). The protein was measured by use of Coomassie Plus reagent (BioRad) with bovine serum albumin as standard.
nNOS[14C-heme] (1.5 μM) was added to a reaction mixture of 40 mM potassium phosphate, pH 7.4, containing 0.4 mM NADP+, 10 mM glucose-6-phosphate, 1 unit/mL glucose-6-phosphate dehydrogenase, 0.2 mM CaCl2, 100 unit/mL superoxide dismutase, 25 unit/mL catalase, 12 μg/mL calmodulin, 10 μM tetrahydrobiopterin, and 500 μM AG in a total volume of 300 μL at room temperature. The alteration of the heme prosthetic group was measured by HPLC similar to that described (17). HPLC was performed with the use of a Waters 600S controller, 717 plus autosampler, 996 photodiode array detector (Waters Corp., Milford, MA), and an in-line radiochemical detector (Radiomatic 500TR, Packard, Downers Grove, IL). The reaction mixtures were injected onto an HPLC column (C18 Vydac 5μm 2.1 × 150 mm) equilibrated with 65% solvent A (0.1% trifluoroacetic acid) and 35% solvent B (0.1 % trifluoroacetic acid in acetonitrile) at a flow rate of 0.3 ml/min. After 15 min, a linear gradient was run to 65% solvent B over 10 minutes. Absorbance at 220 nm and 400 nm was monitored. Myoglobin was used as a standard.
RESULTS
LC/MS analysis for metabolites of NAA
We examined a variety of chromatographic conditions and found that the polar, cationic, guanidine compounds, such as NAA, are nicely retained on a hydrophilic interaction column specially formulated for basic compounds (HILIC). As shown in Fig. 1, the total ion current (TIC) chromatogram of the effluent from the HILIC column after injection of the reaction mixture containing nNOS treated with NAA (Panel A) gave multiple peaks similar to that found for the reaction mixture incubated without nNOS (Panel B). Although there are differences between these chromatograms, the preponderance of signals from the various components of the reaction mixture obscures these differences. In order to more clearly see these differences, the data file of the reaction mixture containing nNOS (Panel A) was subtracted from a reaction mixture where nNOS was omitted (Panel B). This should give ions for potential nNOS substrates present in the reaction mixture, namely NAA. We manually inspected the spectral data, obtained after subtraction, over 1-min intervals throughout the entire HPLC run and found over the 14–15 min time period a spectrum of a compound with m/z of 190.1 (Fig. 1C). This is consistent with the retention time and mass spectrum of authentic NAA. Thus as expected, we could discern loss of the starting NAA. A similar analysis where the data file obtained for the reaction mixture not containing nNOS was subtracted from that of the reaction mixture with nNOS gives ions of metabolites. As shown in Fig. 1D, this analysis gives a spectrum of a compound with an m/z of 160.0 over the same 14–15 min time period. This ion is due to a chemical present only when nNOS was included in the reaction mixture and likely represents a metabolite. To validate our manual analysis, we show by plotting the extracted ion chromatogram for m/z of 160.0 that this ion is present only in the nNOS containing reaction mixture with a retention time of 14.7 min (Fig. 1E). Although not shown, we examined a variety of samples representing differing amounts of NAA, nNOS, and time. The results described above represent the clearest differences.
Figure 1.
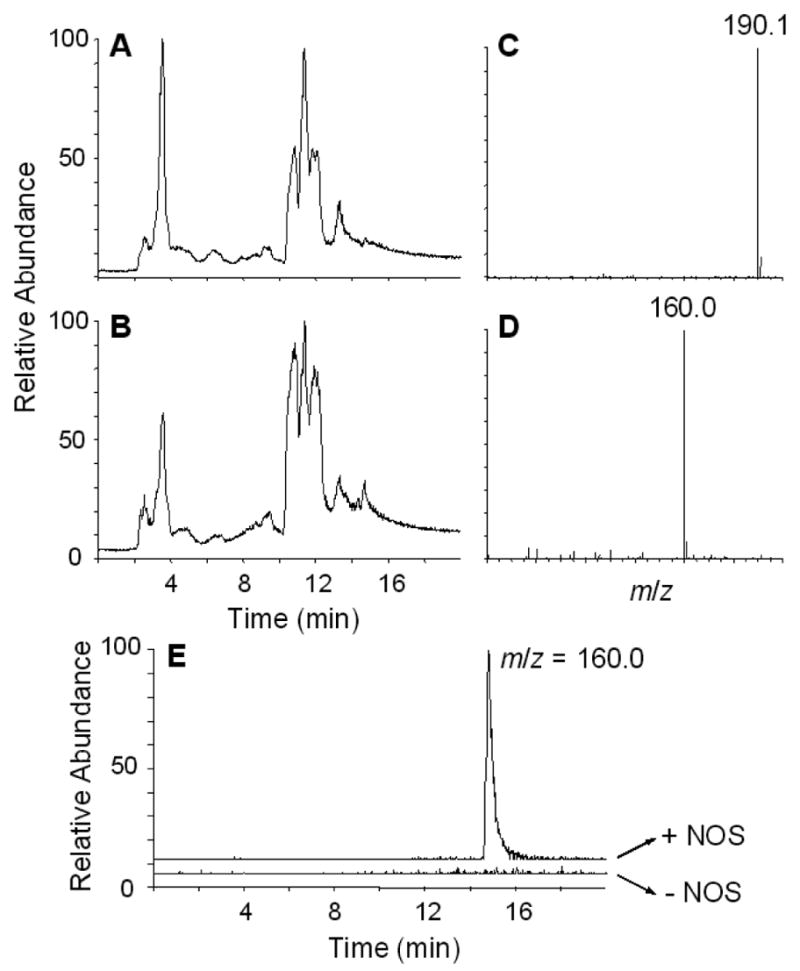
LC/MS analysis of the low molecular mass fraction derived from reaction mixtures containing nNOS and NAA. The reaction mixture containing nNOS treated with 100 μM NAA was filtered through a 10,000 molecular mass filter and analyzed by LC/MS/MS on a triple-quadrupole mass spectrometer as described in Materials and Methods. A, total ion chromatogram of a reaction mixture of nNOS treated with 100 μM NAA; B, total ion chromatograph of a control reaction mixture treated with 100 μM NAA in the absence of nNOS; C, the mass spectrum of a compound eluting between 14–15 min present in the sample shown in B, but not in the sample shown in A; D, the mass spectrum of a compound eluting between 14–15 min present in sample shown in A, but not for the sample shown in B; E, the chromatogram of the ion at m/z 160.0 obtained from the reaction mixture with (+NOS) or without (−NOS) nNOS. The results in C and D were generated by first subtracting the indicated data sets and then manually looking at the spectral data over 1-min time periods to discern differences.
For further characterization of the putative metabolite, the sample was analyzed under high-resolution conditions with the use of histidine ([M+H]+ = 156.0768, calculated) and arginine ([M+H]+ = 175.1190, calculated) as lock masses. We obtained an ion at m/z of 160.1079, which is consistent with a compound with the molecular formula of C6H14O2N3+ ([M+H]+ = 160.1081), which has a calculated value within 1.25 ppm of the observed value. The error in accuracy of measuring the mass of the standards was less than 20 ppm. The molecular formula is consistent with a compound resulting from the loss of a hydrazine moiety from NAA (Scheme 1A, upper row).
Scheme 1.

Metabolites identified by LC/MS/MS analysis of nNOS treated with NAA, DAG, or AG. A, metabolites of NAA, DAG and AG; B, heme adducts found after treatment of nNOS with NAA, DAG or AG. * indicates the results from high resolution measurements. The structures are presented as the neutral molecules. The m/z values are calculated for the protonated forms.
LC/MS analysis for metabolites of DAG and AG produced by nNOS
The TIC chromatograms of DAG-treated reaction mixtures incubated with or without nNOS were analyzed by the same procedure described above for NAA. When the TIC chromatogram from the reaction mixture without nNOS was subtracted from that with nNOS, a new ion at m/z 60.2 was found. As shown in Fig. 2A, the chromatographic profile of the ion at m/z of 60.2 clearly shows a peak for the sample containing nNOS (upper chromatogram, +NOS) but not in the sample where nNOS was omitted (lower chromatogram, −NOS). The ion at m/z 60.2 is consistent with formimidic acid hydrazide, which is the predicted product upon the loss of a hydrazine moiety from DAG (Scheme 1A, middle row). We could not determine the accurate mass for this compound.
Figure 2.
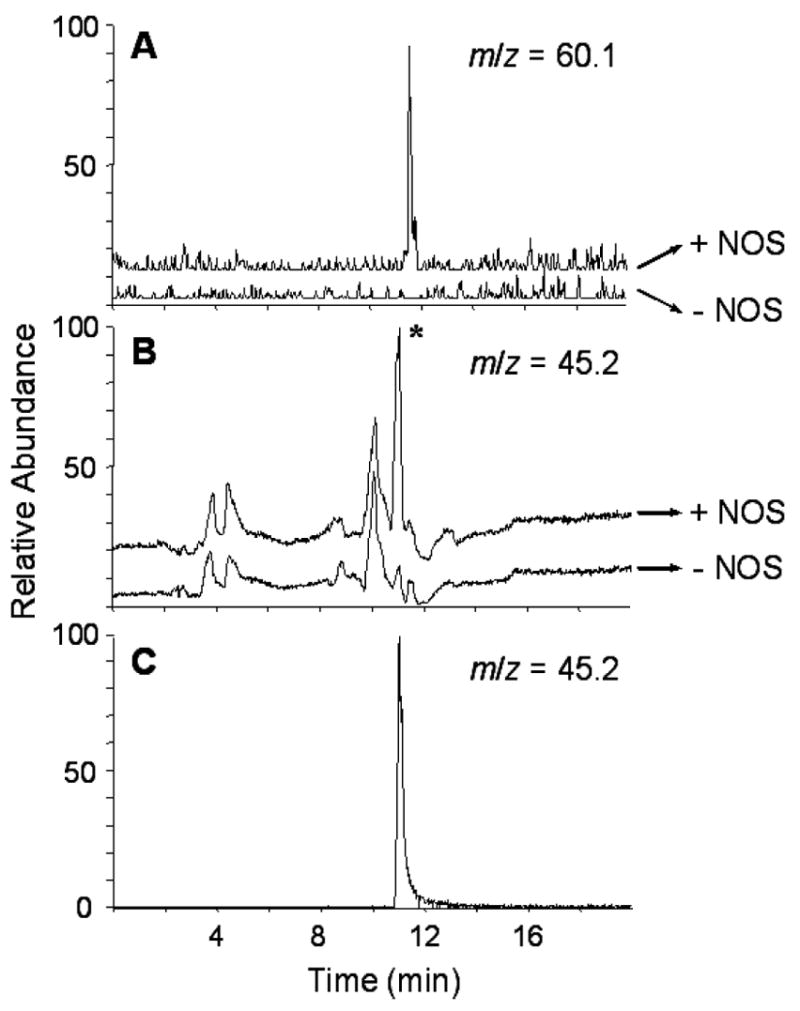
LC/MS analysis of nNOS treated with DAG or AG. The nNOS was treated with 500 μM DAG or 1 mM AG and analyzed as in Fig. 1. A, chromatograms of the ion at m/z 60.2 obtained from the reaction mixtures treated with DAG in the presence (upper, + NOS) or absence (bottom, − NOS) of nNOS; B, chromatrograms of the ion at m/z 45.2 obtained from the reaction mixtures treated with AG in the presence (upper, + NOS) or absence (bottom, − NOS) of nNOS; C, chromatrogram of the ion at m/z 45.2 obtained from a solution containing 20 μM formamidine acetate. The asterisk on B indicates the major difference between the chromatrograms containing NOS to that not containing NOS.
When the AG reaction mixtures incubated with or without nNOS were analyzed by this approach, the product was not easily discerned due to the large number of background ions in the low mass region. Based on the results of NAA and DAG, AG should lose hydrazine to form formamidine, which has a calculated m/z of 45.1 (Scheme 1A, bottom row). As shown in Fig. 2B, selected ion monitoring of the ion at m/z of 45.1 gives multiple peaks in the sample containing nNOS (+NOS) as well as that not containing nNOS (−NOS). However, a prominent peak at 11 min is present only in the chromatogram of the sample with nNOS (Fig. 2B, +NOS, *). The retention time and mass spectrum of this peak is identical with that obtained from authentic formamidine (Fig. 2C).
Analysis of LC/MS data for NAA by use of MetAlign™ software
We sought to reanalyze the data for NAA with the use of MetAlign™ software as an alternate method to the manual method described above. As we intend to look at other metabolism-based inactivators in the future, we wished to develop a more robust method to discern differences amongst LC/MS data sets. The major advantage of a software based method is the unbiased, high-throughput capability of the analysis. Because of the added capabilities of the software over that of the manual method, we could examine differences in reaction mixtures containing NAA (Sample 1), NAA and nNOS (Sample 2), and nNOS (Sample 3). The raw or original TIC chromatograms are shown for each of these samples (Fig. 3A). As shown in Fig. 3B, we analyzed for differences between Sample 1 and 2 (Baseline Corrected 1–2) to look for substrates and for differences between Sample 2 and Samples 1 and 3 (Baseline Corrected 2-1-3) to look for products. These chromatograms represent the smoothed, baseline-corrected, and subtracted data sets. Next, the program calculated statistically significant differences amongst the chromatograms for each baseline corrected sample (Fig. 3C, Absolute Difference). In the case of Sample 1–2, we find two major peaks in the chromatogram. Subsequent analysis of the spectrum associated with each of these peaks gave a prominent ion at m/z of 279 for the peak at approximately 3.8 min and an m/z of 190 for the peak at approximately 15 min (Fig. 3D). Examination of the extracted ion chromatogram of the ion at m/z 279 for all the samples revealed that this ion is present in Sample 3 as well as Sample 1. Thus, this ion represents a compound present in the nNOS preparation and was excluded from further consideration. This leaves the ion at m/z of 190, which is consistent with NAA, as the only valid ion. The Absolute Difference analysis of Samples 2-1-3, gives 6 major peaks on the chromatogram (Fig. 3C, Absolute Difference 2-1-3). Again, examination of the extracted ion chromatogram of the major ions in these 6 peaks in all the samples revealed that all except two ions are present in the NAA alone (Sample 1) and nNOS alone (Sample 3) chromatograms. Thus, four of these peaks cannot represent metabolites dependent on nNOS action and thus were not considered. The full scan spectra of the two remaining product candidates are shown in Fig. 3D as indicated with ions of m/z of 160 and 218. As a final level of filtering, we examined the structural relatedness of the putative substrates and products by MS/MS analysis to find common fragment ions. We found a fragment ion at m/z of 70 for both molecular ions at m/z of 190 and 160 (data not shown) and this confirmed our assignment of the metabolic conversion of NAA to a product with m/z of 160 as described above. We did not find common fragments for the ion at m/z of 218 with that of the ion at m/z 190. The identity of the compound corresponding to m/z of 218 is unknown. Overall, we have succeeded in utilizing MetAlign software to verify our initial findings for NAA. However, we failed to obtain results from DAG and AG by these methods.
Figure 3.
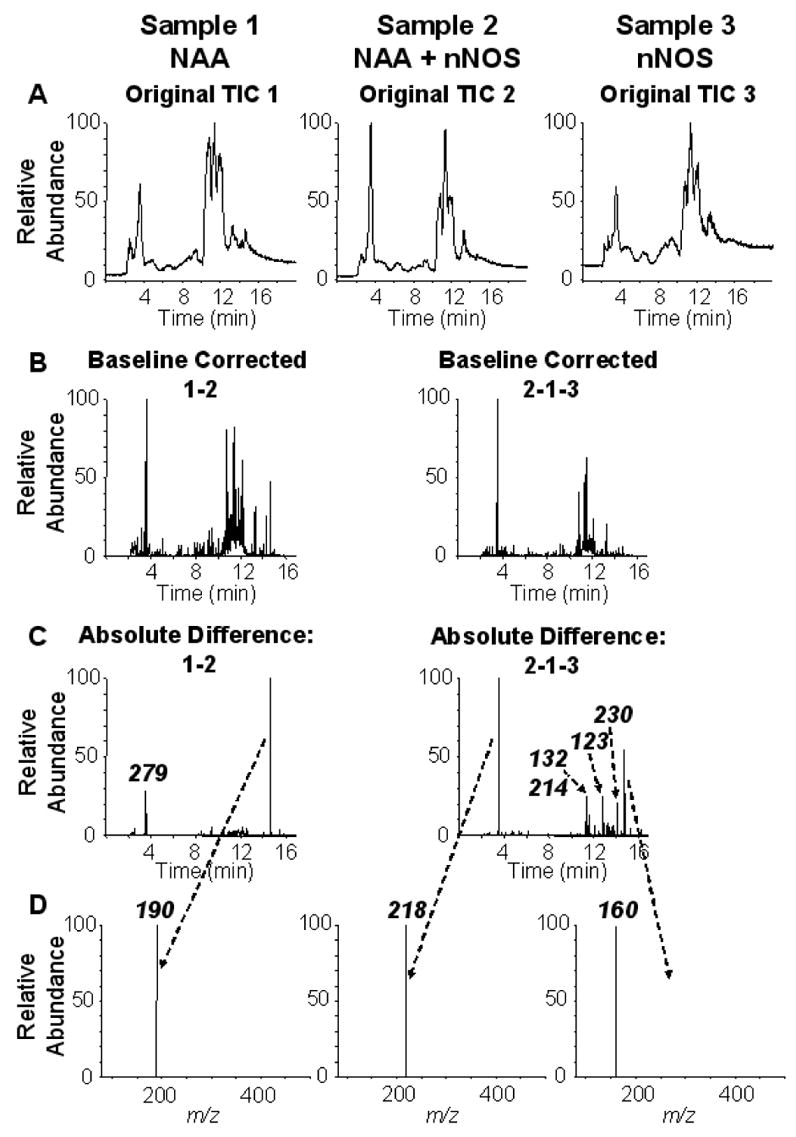
MetAlign™ analysis of LC/MS data obtained from reaction mixtures containing NAA (Sample 1), NAA + nNOS (Sample 2) and nNOS (Sample 3). Three samples were generated and analyzed by LC/MS as in Fig. 1, except that MetAlign™ software was used to analyze the data. A, total ion chromatogram of each sample as indicated; B, chromatograms obtained after subtraction of the indicated data sets and baseline correction; C, chromatograms obtained after filtering absolute differences of the indicated data sets; D, mass spectra obtained from the indicated peaks in C.
Characterization of the major dissociable heme adducts formed during inactivation of nNOS by NAA, DAG, or AG
AG is known to inactivate nNOS by a process that covalently alters the heme prosthetic group to dissociable and protein-bound heme adducts (17). The dissociable heme adduct was found to incorporate radiolabel from 14C-labeled AG, indicating that at least the carbon atom from AG was bound to the heme during the inactivation of nNOS (17). Moreover, the major dissociable heme adduct formed from nNOS after NAA-mediated inactivation was found to have an ion at m/z of 775.3. Although not confirmed by MS/MS analysis, the mass is consistent with formation of an adduct between heme and NAA minus a hydrazine moiety. Thus, we thought that LC/MS/MS analysis of the heme adducts formed from nNOS may provide further insight into the metabolism of NAA, DAG, and AG. Initially, we sought to reexamine the dissociable heme adduct formed during inactivation of nNOS by NAA (Fig. 4, NAA). The major dissociable heme adduct is detected on the HPLC profile by its absorbance at 400 nm (Fig. 4A, NAA Peak 1). The mass spectrum for this peak shows prominent ions at m/z of 775.3 and 616.2 (Fig. 4B, NAA). MS/MS analysis of the ion at m/z of 775.3 gives a fragment ion at m/z of 616.2, consistent with heme (Fig. 4C, NAA). Similarly, the dissociable heme adduct produced during the treatment of nNOS with DAG gives an ion at m/z of 675.2 with a corresponding daughter ion at 616.2 (Fig. 4B and 4C, DAG). The dissociable heme adduct from the reaction of nNOS with AG gives an ion at m/z 660.2 with a fragment ion at m/z of 616.2 (Fig. 4B and 4C, AG). In each case, a common fragment ion corresponding to heme is found, indicating that the heme is altered by the addition of the inactivator molecule minus a hydrazine moiety and a hydrogen atom (Scheme 1B).
Figure 4.
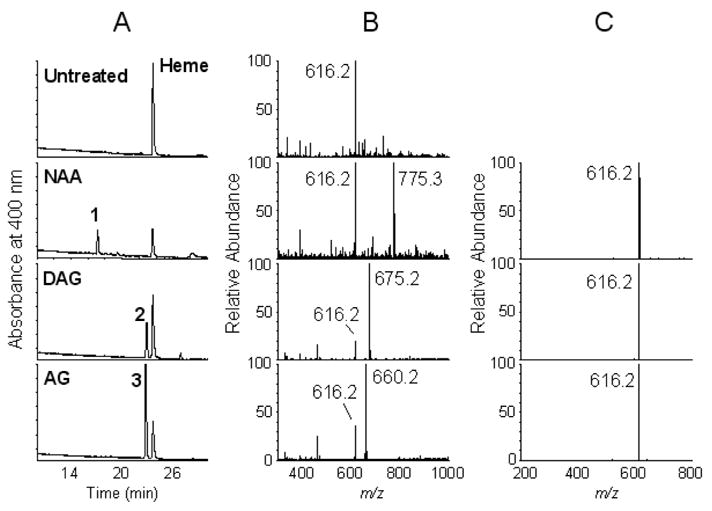
LC/MS analysis of nNOS heme adducts. Reaction mixtures containing nNOS were directly injected onto a reverse phase HPLC column and the effluents were analyzed by photodiode array detector and a Finnigan LTQ linear ion trap mass spectrometer as described in Materials and Methods. Untreated, reaction mixture treated with vehicle; NAA, reaction mixture treated with 100 μM NAA; DAG, reaction mixture treated with 500 μM DAG; AG, reaction mixture treated with 1 mM AG. A, profiles of HPLC chromatograms at 400 nm for each sample; B, the mass spectra obtained of the indicated peaks observed on the 400 nm profile for each sample; C, the mass spectra of the fragment ions obtained from the molecular ions for each sample in B. Heme (Heme) and the dissociable heme adducts are the major peaks (peaks 1–3) with absorbance at 400 nm. The compounds with m/z of 775.3, 675.2, and 660.2 have a common fragment ion at m/z of 616.2, which corresponds to heme.
Studies with nNOS containing radiolabeled heme
Although the loss of heme is known to be a major mechanism for inactivation of nNOS due to AG and NAA (17), it is not known how much of the altered heme can be accounted for by the formation of the dissociable heme product identified here. It is known that altered heme products may have differing extinction coefficients and thus cannot be accurately quantified by peak areas on the 400-nm HPLC chromatograms (24). We chose to reconstitute heme-deficient apo-nNOS with 14C-labeled heme and utilize the reconstituted preparation of nNOS[14C-heme] for quantitation of the heme adducts after inactivation with AG. As shown in Fig. 5A, HPLC analysis of the untreated nNOS gives a major radiolabeled peak at 22 min, corresponding to heme. As shown in Fig. 5B, treatment of the nNOS with AG causes a decrease of approximately 55% in the amount of radioactive heme and the formation of several peaks containing radioactivity including Peak I, which corresponds to the major dissociable heme adduct. Approximately 45% of the altered heme is accounted for in this peak. The remainder of the radioactivity is found in very polar fractions with retention times of less than 8 min and in the fractions containing the heme that is irreversibly bound to the protein (Peak II). Thus, the dissociable heme product accounts only for about one-half of the heme that is altered.
Figure 5.
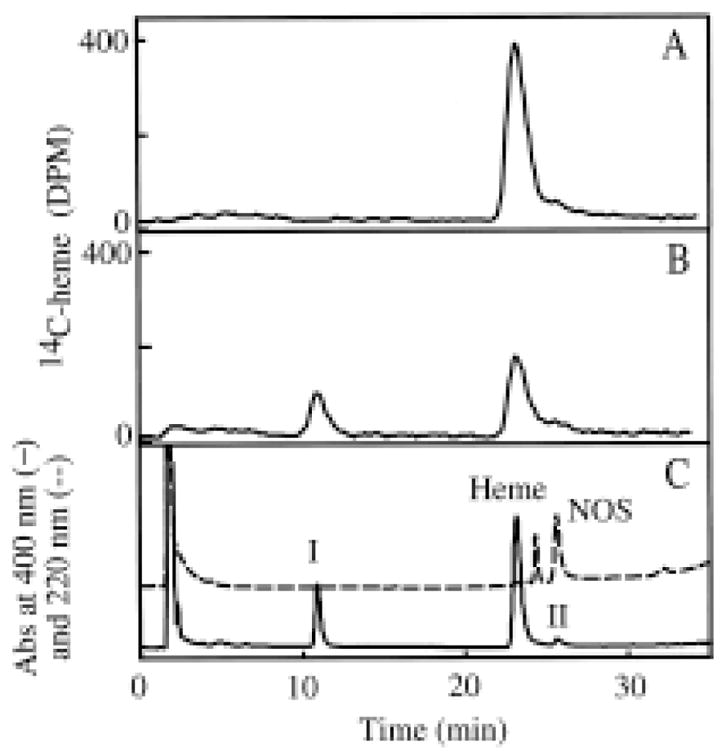
HPLC profiles of untreated and AG-treated nNOS[14C-heme]. A, untreated nNOS; B, nNOS treated with 500 μM AG; C, same sample as in B. The nNOS was treated with AG and analyzed by HPLC as described in Materials and Methods. The radioactivity was measured in A and B. The absorbance at 220 nm (dashed line) and 400 nm (solid line) was measured in C.
Since we have previously established how much radioactivity from 14C-AG is associated with the HPLC peak corresponding to the dissociable heme adduct characterized above (17), we estimated the stoichiometry of AG found with the dissociable heme adduct. Based on the 14C-heme measurements above, we calculated the amount of heme product represented by the area of Peak I at 400 nm as 0.057 pmol per 1000 area units (mean of two determinations; 0.054 and 0.060). We next compared the amount of radioactivity present in peak I from reaction mixtures containing 14C-AG from published data (17). The amount of AG-equivalents bound to the amount of Peak I at 400 nm was 0.060 ± 0.001 pmole 14C-AG per 1000 area units (n = 7, SEM). Based on the data from 14C-heme and 14C-AG, there is approximately one AG-derived mole of 14C per mole of 14C-heme. These calculations are consistent with the interpretation of the mass data for the dissociable heme adduct derived from AG treatment of nNOS (Scheme 1B).
DISCUSSION
It is established that AG, DAG, and NAA are suicide or metabolism-based inactivators of NOS (17–21). Metabolism-based inactivators or suicide inactivators are chemically inert molecules that mimic the natural substrate of the enzyme and get metabolized to a highly reactive intermediate, often a free radical. The reactive intermediate then attacks a susceptible site, often an important active site moiety of the enzyme, leading to the inactivation of the enzyme. In the case of nNOS, it has been shown that the mechanism of inactivation by AG and NAA involves the metabolism of these compounds to reactive intermediates that covalently alter the heme prosthetic group. Since the exact nature of the reactive intermediates was unknown, we sought to characterize the heme adducts to elucidate the reactive intermediate responsible for inactivation. Often, the reactive intermediates also produce stable products as the inactivation process is not totally efficient. Therefore, we also searched for stable metabolite molecules. In the current study, we show by LC/MS/MS analysis that AG, DAG, and NAA are metabolized by nNOS leading to the net loss of N2H2 from each inactivator (See Scheme 1 for structures and masses). We also found that dissociable heme adducts are formed in each case with a mass of heme plus the inactivator minus N2H3. Based on these results, we propose that a carbon radical intermediate is formed that either abstracts a hydrogen atom to give product or reacts with the heme prosthetic group to form a heme adduct (Scheme 2).
Scheme 2.
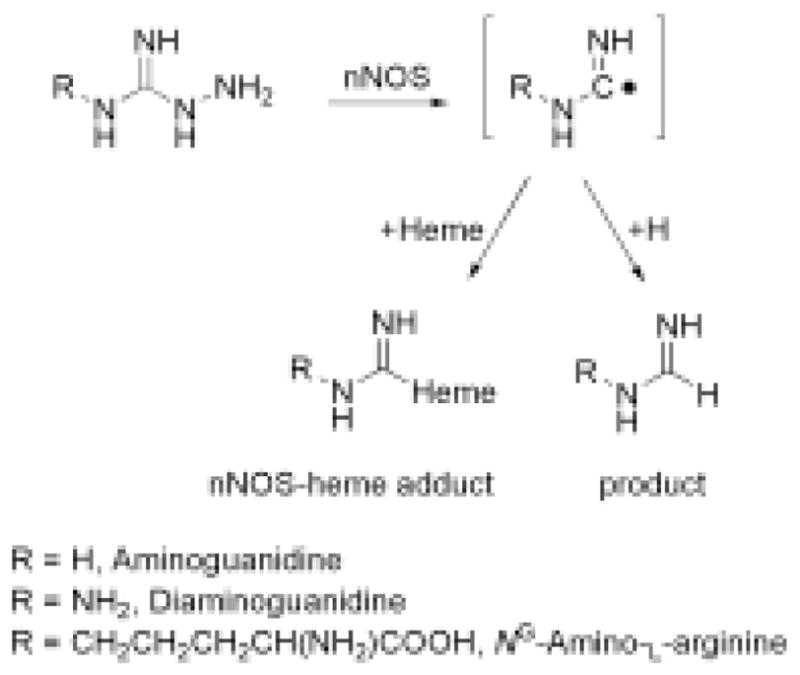
Proposed mechanism for the metabolism-based inactivation of nNOS by NAA, DAG, and AG.
There is precedent for formation of phenyl and alkyl radicals from the corresponding phenyl and alkyl hydrazines during their metabolism by myoglobin, hemoglobin, and liver microsomal cytochrome P450s (25–30). Phenyldiazine, or its precursor phenylhydrazine, is known to form phenyl radicals and form iron-phenyl complexes within the heme active site of a variety of hemeproteins (30). More specifically in the case of nNOS, phenyldiazine is known to form iron-phenyl complexes in a highly similar reaction (31). Thus, it seems likely that nNOS metabolizes the hydrazine based inactivators, AG, DAG, and NAA, to the radical species shown in Scheme 2.
Although it is clear that the heme products identified here are adducts with the radical species shown in Scheme 2, the exact structure of the heme adducts is not known. The pyrrole nitrogen, meso carbon, and iron are likely targets of addition (30). Our attempts at isolation and purification of these heme adducts failed as the heme adducts were found to be labile under the conditions used here and reverted back to native heme during the isolation procedure. We have thus not been able to isolate sufficient quantities for further characterization of these adducts. We suspect a slow hydrolysis of the dissociable heme adducts during our isolation procedures. The formation of the dissociable heme adduct from NAA and nNOS has been observed in cells, and thus the reactions characterized here likely occur in vivo (21).
In the course of these studies, we utilized for a trial period MetAlign™ software that was developed to allow comparisons of LC/MS data. We report here our experience in utilizing this potentially very useful tool in analysis of our data sets. We find that the software shows promise as an initial filtering tool to discern differences among data sets, such that substrates and products can be identified. Although we have utilized this software for nNOS, we believe this approach to be of general use in searching for substrates and products for any isolated enzyme.
Acknowledgments
This investigation was supported by National Institutes of Health Grants ES08365
Footnotes
Abbreviations: AG, aminoguanidine; DAG, diaminoguanidine; NAA, NG-amino-L-arginine; NOS, nitric oxide synthase; nNOS, neuronal NOS; eNOS, endothelial NOS; iNOS, inducible NOS; SOD, superoxide dismutase..
References
- 1.White KA, Marletta MA. Nitric oxide synthase is a cytochrome P-450 type hemoprotein. Biochemistry. 1992;31:6627–6631. doi: 10.1021/bi00144a001. [DOI] [PubMed] [Google Scholar]
- 2.Stuehr DJ, Ikeda-Saito M. Spectral characterization of brain and macrophage nitric oxide synthases. J Biol Chem. 1992;267:20547–20550. [PubMed] [Google Scholar]
- 3.McMillan K, Bredt DS, Hirsch DJ, Snyder SH, Clark JE, Masters BSS. Cloned, expressed rat cerebellar nitric oxide synthase contains stoichiometric amounts of heme, which binds carbon monoxide. Proc Natl Acad Sci USA. 1992;89:11141–11145. doi: 10.1073/pnas.89.23.11141. [DOI] [PMC free article] [PubMed] [Google Scholar]
- 4.Marletta MA. Nitric oxide synthase structure and mechanism. J Biol Chem. 1993;268:12231–12234. [PubMed] [Google Scholar]
- 5.Li H, Poulos TL. Structure-function studies on nitric oxide synthases. J Inorg Biochem. 2005;99:293–305. doi: 10.1016/j.jinorgbio.2004.10.016. [DOI] [PubMed] [Google Scholar]
- 6.Stuehr DJ. Mammalian nitric oxide synthases. Biochem Biophys Acta. 1999;1411:217–230. doi: 10.1016/s0005-2728(99)00016-x. [DOI] [PubMed] [Google Scholar]
- 7.Moncada S, Palmer RMJ, Higgs EA. Nitric oxide: Physiology, pathophysiology, and pharmacology. Pharmacol Rev. 1991;43:109–142. [PubMed] [Google Scholar]
- 8.Marletta MA. Nitric oxide synthase: aspects concerning structure and catalysis. Cell. 1994;78:927–930. doi: 10.1016/0092-8674(94)90268-2. [DOI] [PubMed] [Google Scholar]
- 9.Griffith OW, Kilbourn RG. Nitric oxide synthase inhibitors: amino acids. Methods Enzymol. 1996;268:375–392. doi: 10.1016/s0076-6879(96)68040-9. [DOI] [PubMed] [Google Scholar]
- 10.Kerwin JF, Jr, Heller M. The arginine-nitric oxide pathway: a target for new drugs. Med Res Rev. 1994;14:23–74. doi: 10.1002/med.2610140103. [DOI] [PubMed] [Google Scholar]
- 11.Southan GJ, Szabo C. Selective pharmacological inhibition of distinct nitric oxide synthase isoforms. Biochem Pharmacol. 1996;51:383–394. doi: 10.1016/0006-2952(95)02099-3. [DOI] [PubMed] [Google Scholar]
- 12.Roman LJ, Martasek P, Masters BS. Intrinsic and extrinsic modulation of nitric oxide synthase activity. Chem Rev. 2002;102:1179–1190. doi: 10.1021/cr000661e. [DOI] [PubMed] [Google Scholar]
- 13.Holstad M, Jansson L, Sandler S. Inhibition of nitric oxide formation by aminoguanidine: an attempt to prevent insulin-dependent diabetes mellitus. Gen Pharmacol. 1997;29:697–700. doi: 10.1016/s0306-3623(97)00012-8. [DOI] [PubMed] [Google Scholar]
- 14.Corbett JA, Tilton RG, Chang K, Hasan KS, Ido Y, Wang JL, Sweetland MA, Lancaster JRJ, Williamson JR, McDaniel ML. Aminoguanidine, a novel inhibitor of nitric oxide formation, prevents diabetic vascular dysfunction. Diabetes. 1992;41:552–556. doi: 10.2337/diab.41.4.552. [DOI] [PubMed] [Google Scholar]
- 15.Wolff DJ, Lubeskie A. Aminoguanidine is an isoform-selective, mechanism-based inactivator of nitric oxide synthase. Arch Biochem Biophys. 1995;316:290–301. doi: 10.1006/abbi.1995.1040. [DOI] [PubMed] [Google Scholar]
- 16.Wolff DJ, Lubeskie A. Inactivation of nitric oxide synthase isoforms by diaminoguanidine and NG-amino-L-arginine. Arch Biochem Biophys. 1996;325:227–234. doi: 10.1006/abbi.1996.0028. [DOI] [PubMed] [Google Scholar]
- 17.Jianmongkol S, Vuletich JL, Bender AT, Demady DR, Osawa Y. Aminoguanidine-mediated inactivation and alteration of neuronal nitric oxide synthase. J Biol Chem. 2000;275:13370–13376. doi: 10.1074/jbc.275.18.13370. [DOI] [PubMed] [Google Scholar]
- 18.Bryk R, Lubeskie A, Wolff DJ. Studies of neuronal nitric oxide synthase inactivation by diverse suicide inhibitors. Arch Biochem Biophys. 1999;369:243–251. doi: 10.1006/abbi.1999.1340. [DOI] [PubMed] [Google Scholar]
- 19.Bryk R, Wolff DJ. Mechanism of inducible nitric oxide synthase inactivation by aminoguanidine and L-N6-(1-iminoethyl)lysine. Biochemistry. 1998;37:4844–4852. doi: 10.1021/bi972065t. [DOI] [PubMed] [Google Scholar]
- 20.Bryk R, Wolff DJ. Pharmacological modulation of nitric oxide synthesis by mechanism-based inactivators and related inhibitors. Pharmacol Ther. 1999;84:157–178. doi: 10.1016/s0163-7258(99)00030-3. [DOI] [PubMed] [Google Scholar]
- 21.Vuletich JL, Lowe ER, Jianmongkol S, Kamada Y, Kent UM, Bender AT, Demady DR, Hollenberg PF, Osawa Y. Alteration of the heme prosthetic group of neuronal nitric-oxide synthase during inactivation by N(G)-amino-L-arginine in vitro and in vivo. Mol Pharmacol. 2002;62:110–118. doi: 10.1124/mol.62.1.110. [DOI] [PubMed] [Google Scholar]
- 22.Bender AT, Silverstein AM, Demady DR, Kanelakis KC, Noguchi S, Pratt WB, Osawa Y. Neuronal nitric oxide synthase is regulated by the hsp90-based chaperone system in vivo. J Biol Chem. 1999;274:1472–1478. doi: 10.1074/jbc.274.3.1472. [DOI] [PubMed] [Google Scholar]
- 23.Bender AT, Nakatsuka M, Osawa Y. Heme insertion, assembly, and activation of apo-neuronal nitric-oxide synthase in vitro. J Biol Chem. 2000;275:26018–26023. doi: 10.1074/jbc.275.34.26018. [DOI] [PubMed] [Google Scholar]
- 24.Osawa Y, Williams MS. Covalent crosslinking of the heme prosthetic group to myoglobin by H2O2: Toxicological implications. Free Radical Biol Med. 1996;21:35–41. doi: 10.1016/0891-5849(95)02215-5. [DOI] [PubMed] [Google Scholar]
- 25.Augusto O, Ortiz de Montellano PR, Quintanilha A. Spin-trapping of free radicals formed during microsomal metabolism of ethylhydrazine and acetylhydrazine. Biochem Biophys Res Commun. 1981;101:1324–1330. doi: 10.1016/0006-291x(81)91592-8. [DOI] [PubMed] [Google Scholar]
- 26.Augusto O, Kunze KL, Ortiz de Montellano PR. N-Phenylprotoporphyrin IX formation in the hemoglobin-phenylhydrazine reaction. Evidence for a protein-stabilized iron-phenyl intermediate. J Biol Chem. 1982;257:6231–6241. [PubMed] [Google Scholar]
- 27.Ortiz de Montellano PR, Augusto O, Viola F, Kunze KL. Carbon radicals in the metabolism of alkyl hydrazines. J Biol Chem. 1983;258:8623–8629. [PubMed] [Google Scholar]
- 28.Ortiz de Montellano PR, Kerr DE. Inactivation of myoglobin by ortho-substituted arylhydrazines Formation of prosthetic heme aryl-iron but not N-aryl adducts. Biochemistry. 1985;24:1147–1152. doi: 10.1021/bi00326a013. [DOI] [PubMed] [Google Scholar]
- 29.Ortiz de Montellano PR. Arylhydrazines as probes of hemoprotein structure and function. Biochimie. 1995;77:581–593. doi: 10.1016/0300-9084(96)88174-0. [DOI] [PubMed] [Google Scholar]
- 30.Ortiz de Montellano PR. Free radical modification of prosthetic heme groups. Pharmacol Ther. 1990;48:95–120. doi: 10.1016/0163-7258(90)90020-3. [DOI] [PubMed] [Google Scholar]
- 31.Gerber NC, Ortiz de Montellano PR. Neuronal nitric oxide synthase. Expression in Escherichia coli, irreversible inhibition by phenyldiazene, and active site topology. J Biol Chem. 1995;270:17791–17796. doi: 10.1074/jbc.270.30.17791. [DOI] [PubMed] [Google Scholar]