

Abstract
Numerous microbes inhabit the human intestine, many of which are uncharacterized or uncultivable. They form a complex microbial community that deeply affects human physiology. To identify the genomic features common to all human gut microbiomes as well as those variable among them, we performed a large-scale comparative metagenomic analysis of fecal samples from 13 healthy individuals of various ages, including unweaned infants. We found that, while the gut microbiota from unweaned infants were simple and showed a high inter-individual variation in taxonomic and gene composition, those from adults and weaned children were more complex but showed a high functional uniformity regardless of age or sex. In searching for the genes over-represented in gut microbiomes, we identified 237 gene families commonly enriched in adult-type and 136 families in infant-type microbiomes, with a small overlap. An analysis of their predicted functions revealed various strategies employed by each type of microbiota to adapt to its intestinal environment, suggesting that these gene sets encode the core functions of adult and infant-type gut microbiota. By analysing the orphan genes, 647 new gene families were identified to be exclusively present in human intestinal microbiomes. In addition, we discovered a conjugative transposon family explosively amplified in human gut microbiomes, which strongly suggests that the intestine is a ‘hot spot’ for horizontal gene transfer between microbes.
Key words: metagenomics, human gut microbiota, gene family, conjugative transposon
1. Introduction
All surfaces of the human body are inhabited by complex microbial communities (microbiota).1–4 In adults, the combined microbial populations exceed 100 trillion cells, about 10 times the total number of cells composing the human body. Most reside in the intestinal tract, and in particular in the distal colon where cell densities are as high as 1012 g−1 of human feces. The members of the human intestinal microbiota are classified into more than 50 genera and hundreds of species representing nine bacterial and one archaeal division.1,5–7 The total number of genes encoded by their collective genomes (microbiome) is estimated to exceed that of the human genome by at least one order of magnitude.1 Our gut microbiota possesses many metabolic capabilities which are lacking in the human host and, thus, can be viewed as indispensable for human life.3 It contributes to host nutrition by enhancing the efficacy of energy harvest from ingested food and by synthesizing essential vitamins.1,8,9 It also affects a broad range of physiological properties of the human host, controlling, for instance, intestinal epithelial cell proliferation and differentiation, energy balance, pH, the development of the immune system, and protection against pathogens.1,10–12 Imbalance of the intestinal microbiota can predispose individuals to a variety of disease states ranging from inflammatory bowel diseases to allergy and obesity.13–18
The composition, dynamics, and functions of the human intestinal microbiota have been studied mostly using culture-based approaches and analyses of 16S ribosomal RNA sequences.3,5,13,19 Notwithstanding these efforts, our understanding of this microbial community is still very limited, particularly with regard to the overall gene content, because of its high complexity and our inability to cultivate most of the microbial species residing in the gut. For instance, although it has been established that the microbiota of adults and unweaned infants differ in composition,6,7 it is largely unknown how such compositional differences affect the overall gene contents and functional properties.
To explore the genomic features of complex microbial communities including uncultivable microbes, a culture-independent metagenomic approach is practical.20 In a pioneering study, it has been recently applied to fecal samples from two adult Americans.21 However, the data obtained from only two adults are insufficient for understanding the structure and functional capabilities of gut microbial communities, as they may be largely affected by various intrinsic and environmental factors, such as age, diet, and host genotype.7,16,22–25 Here, we extended the study to 13 healthy Japanese individuals, including adults, weaned children, and unweaned infants. The analysis not only indicated the presence of gene sets commonly enriched in human gut microbiomes, but also revealed intriguing differences of microbiomes between adults and unweaned infants and between American and Japanese individuals.
2. Materials and methods
2.1. Subjects
All the subjects were healthy Japanese individuals. The ages, genders, and familial relationships of all subjects are summarized in Table 1. All subjects or their parents were informed of the purpose and protocol of this study. None of the subjects were given dietary restrictions except for antibiotics, probiotics, fermented foods (fermented beans, yogurt, etc.), and well-known functional foods for at least 4 weeks prior to sampling. None had a history of gastrointestinal disorder at the time of sampling, and none had unusual eating behaviors.
Table 1.
Summary of the samples, sequencing, assembly, and gene annotation
| Sample status | Sample name | Sex | Age | Total reads | Total read lengtha (bp) | contigs |
singlets |
Total lengh of assembled sequence (Mb) | Total genesb (A) | COG-assigned genes (B) | Identified COGsc (C) | Average COG sized (B)/(C) | In-house NR DB hit genese (D) | Orphan genesf (A) − (D) | ||
|---|---|---|---|---|---|---|---|---|---|---|---|---|---|---|---|---|
| average length (bp) | contigs | average length (bp) | reads | |||||||||||||
| Individual | In-A | Male | 45 years | 81687 | 52509363 | 2809.0 | 5410 | 902.0 | 16330 | 29.93 | 38778 | 18058 | 2355 | 7.67 | 30210 | 8568 |
| Individual | In-B | Male | 6 months | 80617 | 62792581 | 3701.6 | 1721 | 1003.1 | 8481 | 14.88 | 20063 | 9393 | 1617 | 5.81 | 15127 | 4936 |
| Individual | In-D | Male | 35 years | 84237 | 55137918 | 2159.1 | 7613 | 911.8 | 36312 | 49.55 | 67740 | 29998 | 2559 | 11.72 | 49079 | 18661 |
| Individual | In-E | Male | 3 months | 80852 | 56781600 | 2301.1 | 4819 | 1008.7 | 16838 | 28.07 | 37652 | 18688 | 2107 | 8.87 | 28513 | 9139 |
| Individual | In-M | Female | 4 months | 89340 | 57808421 | 3375.1 | 4794 | 655.7 | 15541 | 26.37 | 34330 | 18187 | 2857 | 6.37 | 27050 | 7280 |
| Individual | In-R | Female | 24 years | 85787 | 55404826 | 1920.6 | 8935 | 811.3 | 36524 | 46.79 | 63356 | 28612 | 2655 | 10.78 | 46104 | 17252 |
| Family I | F1-S | Male | 30 years | 78452 | 53568019 | 2153.6 | 7545 | 806.5 | 28038 | 38.86 | 54151 | 25173 | 2531 | 9.95 | 40771 | 13380 |
| F1-T | Female | 28 years | 81348 | 55365235 | 1980.4 | 7389 | 791.5 | 37458 | 44.28 | 65156 | 31230 | 2921 | 10.69 | 47955 | 17201 | |
| F1-U | Female | 7 months | 82525 | 53864663 | 2779.4 | 4854 | 850.4 | 14430 | 25.76 | 35260 | 20365 | 2519 | 8.08 | 28711 | 6549 | |
| Family II | F2-V | Male | 37 years | 80772 | 55926002 | 2008.7 | 7919 | 809.2 | 38442 | 47.02 | 66461 | 33535 | 2873 | 11.67 | 49955 | 16506 |
| F2-W | Female | 36 years | 79163 | 54885684 | 2289.8 | 6778 | 833.0 | 30550 | 40.97 | 57213 | 27680 | 2609 | 10.61 | 43625 | 13588 | |
| F2-X | Male | 3 years | 80858 | 56587120 | 2296.0 | 5032 | 832.1 | 34252 | 40.05 | 57446 | 26599 | 2669 | 9.97 | 42452 | 14994 | |
| F2-Y | Female | 1.5 years | 79754 | 56276047 | 2044.2 | 9159 | 849.9 | 32461 | 46.31 | 64942 | 30870 | 2664 | 11.59 | 50349 | 14593 | |
| Total | 1065392 | 726907479 | 2299.8 | 81968 | 839.9 | 345657 | 478.84 | 662548 | 318388 | 3268 | 97.43 | 499901 | 162647 | |||
| American | Sub. 7 | Female | 28 years | 15.94 | 22329 | 12223 | 2160 | 5.66 | 18443 | 3886 | ||||||
| Sub. 8 | Male | 37 years | 20.49 | 27579 | 14962 | 2249 | 6.65 | 23518 | 4061 | |||||||
| Soil | 144.90 | 212128 | 84060 | 4423 | 19.01 | 125302 | 86826 | |||||||||
| Whale fall | 1 | 29.78 | 46478 | 23222 | 3140 | 7.40 | 32847 | 13631 | ||||||||
| 2 | 30.86 | 47274 | 21826 | 2922 | 7.47 | 32038 | 15236 | |||||||||
| 3 | 28.87 | 42870 | 21076 | 2894 | 7.28 | 31410 | 11460 | |||||||||
| Sargasso | 816.55 | 1406274 | 746941 | 5184 | 144.09 | 1038259 | 368015 | |||||||||
aThe total read length with Phred scores of >15.
bThe number of genes predicted from the non-redundant sequences of each sample by the MetaGene program.
cThe number of COGs to which at least one gene was assigned in each microbime.
dThe average numbers of predicted genes belonging to each COG [(B)/(C)].
eThe number of predicted genes showing similarity to genes in the ‘in-house extended NR database’.
fThe number of genes showing no significant similarity to genes in the ‘in-house extended NR database’ (e-value ≥ 1.0e − 5 in the BLASTP analysis).
2.2. Isolation of bacterial DNA from fecal samples
The collected fecal samples were immediately placed under anaerobic conditions using the Anaero-Pack system (Mitsubishi Gas Chemical Co.), and transported at 4°C to the laboratory within 24 h. Three grams of wet fecal sample were suspended vigorously in phosphate-buffered saline (8 mM Na2HPO4, 137 mM NaCl, 2.7 mM KCl, and 1.5 mM KH2PO4). The suspension was filtered through a 100 µm mesh nylon filter (Falcon). The bacterial cells in the filtrates were collected by centrifugation at 5000 × g for 10 min at 4°C, suspended in 10 ml of Tris–EDTA containing 10 mM Tris-HCl and 1 mM EDTA (pH 8), and then used for DNA isolation. The lysis of bacterial cells was carried out under almost the same conditions as those described in the literature.26 In brief, 1.5 mg of lysozyme was added to 10 ml of cell suspension. After incubation at 37°C for 1 h with gentle mixing, 2 mg of proteinase K were added and the mixture was incubated at 55°C for 5 min. Subsequently, 1.2 ml of 10% (wt/vol) sodium dodecyl sulfate was added to the cell suspension, which was further incubated at 55°C for 1 h with gentle mixing. High-molecular-weight DNA was isolated and purified by phenol/chloroform extraction, RNase A treatment, ethanol, and finally polyethyleneglycol precipitation.
To assess the efficiency of cell lysis, the total number of microbial cells was determined before and after the lytic treatment. A chamber with a depth of 0.02 mm (Erma, Tokyo, Japan) was used for the bacterial cell counting under a phase-contrast microscope (Leica; Leitz DMR model). The cell counting was repeated three times for each sample. The average efficiency of the cell lysis was apparently around 70% or more.
2.3. DNA sequencing, assembly, and gene prediction
Shotgun libraries were constructed from randomly sheared bacterial DNA (2–3 kb) (HydroShear, GeneMachines) and the pUC18 vector. Template DNA for the sequencing was prepared by polymerase chain reaction (PCR) amplification of the insert DNA using a TaKaRa ExTaq kit (Takara Bio) and GeneAmp PCR System 9700 (ABI) as described previously.27 Sequencing was carried out for both ends of the clones using the BigDye v3.1 chemistry on ABI3730 sequencers (ABI) or the ET chemistry on MegaBACE4500 sequencers (GE Healthcare). The shotgun reads from each sample were individually assembled to generate non-redundant metasequences using the PCAP software28 with default parameters.
The MetaGene program,29 which is based on a Hidden Markov Model (HMM) algorithm, was employed to predict potential protein-coding regions (open reading frames, ORFs ≥20 amino acids) from the metasequences of each sample. Prior to gene finding, we masked low-quality sequences (Phred score <15) using ‘Xs’.
2.4. Database construction
The ‘in-house extended NR database’ included the data set from the GenBank non-redundant amino-acid database (version 26, May 2007) plus a dataset obtained by MetaGene prediction from 44 unpublished microbial genome sequences (Supplementary Table S1). These unpublished sequences were obtained from the public database and the websites of the Genome Sequencing Center of Washington University, St Louis (http://genome.wustl.edu/sub_genome_group_index.cgi?GROUP = 3) and the Human Metagenome Consortium Japan (HMGJ; http://www.metagenome.jp/). The ‘reference dataset for COG (Cluster of Orthologous Groups of proteins) assignment’ (Supplementary Table S2) contained 343 microbial genome sequences where COG assignment has been made for all the genes by the NCBI. The ‘in-house reference database’ (referred to as ‘Ref-DB’) was constructed by selecting 243 microbial genomes (Supplementary Table S3) from the reference dataset for COG assignment. To avoid the effect of multiply sequenced species, we selected one representative strain from each species. To identify the genomic features specific to human gut microbiomes, known gut microbes were also excluded from Ref-DB.
To search for the genes related to the Tn1549-like conjugative transposons (CTns), we also constructed a modified Ref-DB by adding the genes on Tn1549 from Enterococcus faecalis strain BM4382 (AAF72340-68)30 and on CTn2, CTn4, and CTn5 of Clostridium difficile strain 630.31 Since Ref-DB originally includes those on the Tn1549-like CTns from E. faecalis strain V583 32 and Streptococcus pyogenes strain MGAS10750,33 the modified Ref-DB contains six known Tn1549-like CTns.
2.5. Clustering analysis of pairwise microbiome comparison
BLASTP34 analyses of all protein sequences from one microbiome against all those from every other were used to estimate the genomic similarities existing in all possible microbiome comparisons.18,35 Bit-scores of the best hits from every single sequence from one microbiome against another were summed up to yield a cumulative pairwise bit-score value. The cumulative bit-score values from all possible pairwise comparisons were then used to construct a distance matrix.18 Since the cumulative bit-score values from microbiome A to microbiome B [denoted as Σ(A,B)] is not equal to that from microbiome B to microbiome A [Σ(B,A)] in the non-reciprocal BLASTP analysis, we used the minimum of the two values, min[Σ(A,B), Σ(B,A)], as a measure of the similarity between microbiomes A and B. To normalize the differences derived from the size differences among the microbiomes, we calculated the measure of genome conservation distance, D2.36,37 The obtained distance matrix was then used for clustering by the multi-dimensional scaling (MDS) method.
2.6. Taxonomic assignment
Taxonomic assignment of protein-coding genes was performed according to the best-hit pairs in the BLASTP analysis against the in-house extended NR database where the taxonomic information for all genes is available. For the first screening, all BLASTP results were filtered by e-value (≤1.0e − 8) and hit length coverage (≥50% of a query sequence). Then, to tentatively assign the taxonomic origins of the genes, we adopted a 90% BLASTP identity threshold. The genes with best-hit pairs under the threshold were assigned as ‘No hits’.
2.7. COG assignment and evaluation of enrichment
COG assignment of predicted gene products was made on the basis of the BLASTP analysis against the reference dataset for COG assignment. After filtering the BLASTP results by e-value (≤1.0e − 8) and aligned length coverage (≥50% of a query sequence), the COG assignment of each gene product was made according to the COG information of its best-hit pair in the reference dataset for COG assignment. If the best-hit pair was not assigned to any COG, the gene product was considered to be ‘uncharacterized’. On the basis of COG assignments, the size of each COG (the number of gene products belonging to each COG) was then counted up for every microbiome. Since most of the genes located at the contig ends and in singletons are predicted as ‘partial genes’ by MetaGene, their hit counts were corrected by the length ratio of each ‘partial gene’ to the reference to minimize multiple counts of fragmented genes. When a predicted gene product had a best-hit pair with a reference protein that has been assigned to multiple COGs, this hit was divided by the number of assigned COGs and the value was dispensed evenly to each COG. The size of each COG was normalized by the total number of genes predicted in each microbiome (‘normalized %’). The average size of each COG in previously sequenced microbial genomes in Ref-DB was also calculated and normalized by the average total gene number (‘DB %’). Finally, the magnitude of enrichment (enrichment value) of each COG was calculated for every microbiome by dividing the ‘normalized %’ by the ‘DB%’. COGs with an average enrichment value of > 2.0 were defined as enriched COGs in each microbiome because, in all the gut microbiomes examined, the enrichment values for 126 COGs belonging to the essential gene sets defined in Escherichia coli and Bacillus subtilis mostly varied between 0.3 and 1.9, with a mean value of 0.92. A clustering analysis of microbiomes based on the COG enrichment values was performed using only the 868 COGs where at least one member was observed in every microbiome to avoid the effects of unidentified COGs. The matrix was clustered independently in the microbiomes and in the COGs using the pairwise complete-linkage hierarchical clustering of the uncentered correlation (cluster-1.3138).
2.8. Orphan genes in human gut microbiomes
Orphan genes whose products showed no significant similarity to known proteins were surveyed from the 662,548 genes predicted in the 13 samples by the BLASTP analysis with the e-value threshold of 1.0e − 5 against the ‘in-house extended NR database’. We also obtained orphan genes from the metagenomic sequences of other environmental microbiomes21,26,39 under the same condition. We then performed an all-to-all BLASTP analysis among the orphan gene products and selected the pairs having BLAST scores greater than 60. The gene products selected were subsequently clustered using the TribeMCL program40 with default parameters. Of the clusters comprising only the gene products derived from human gut microbiomes, those containing ≥30 members were further subjected to motif search/extraction with the HMMER program against the Pfam motif database41 and to identification of the conserved amino-acid sequences by using the MEME program.42
2.9. Accession numbers
All the assembled sequence data have been deposited in DDBJ/EMBL/GenBank under accession numbers BAAU01000001-BAAU01028900 (subject F1-S), BAAV01000001-BAAV01036326 (F1-T), BAAW01000001-BAAW01016539 (F1-U), BAAX01000001-BAAX01036455 (F2-V), BAAY01000001-BAAY01030198 (F2-W), BAAZ01000001-BAAZ01031237 (F2-X), BABA01000001-BABA01035177 (F2-Y), BABB01000001-BABB01020226 (In-A), BABC01000001-BABC01009958 (In-B), BABD01000001-BABD01037296 (In-D), BABE01000001-BABE01020532 (In-E), BABF01000001-BABF01016164 (In-M), and BABG01000001-BABG01034797 (In-R).
3. Results and discussion
3.1. Samples, sequencing, and gene prediction
The subjects analysed in this study included seven adults (aged 24–45 years), two children (3 and 1.5 years), and four unweaned infants (3–7 months). Seven of the subjects belonged to two unrelated families consisting of three and four members, respectively (Table 1).
We isolated the microbial DNA from each fecal sample, constructed shotgun libraries (see ‘Materials and methods’ for details), and produced a total of 1,057,481 shotgun reads (about 80,000 reads for each) representing sequences of about 727 Mb at a Phred score of >15 (Table 1). Relatively large numbers of total shotgun reads (67.6% on average) were assembled into contigs for each sample (Table 1), contrasted with the soil sample in which less than 1% of the total reads (nearly 150, 000 reads) were assembled.39 Although 52–80% (in most cases less than 60%) of the total reads were assembled in the adults and children, 79–89% were assembled in the unweaned infants. Therefore, the lengths of the non-redundant metasequences significantly differed between adult/child and infant microbiomes: 38.9–49.6 Mb for all adults and children except for one adult (29.9 Mb in In-A) and 14.9–28.1 Mb for all infants (Table 1). The total length of the contigs and singletons obtained from the 13 samples was 478.8 Mb.
From each non-redundant metasequence, we identified 20,063–67,740 potential protein-coding genes (≥20 amino acids) by using the MetaGene program (Table 1). We might have overestimated the number of genes in our metasequences by false prediction and/or double counting of the fragmented ORFs that were derived from the same gene. The MetaGene program, however, predicted 1,406,000 ORFs in the Sargasso Sea metagenomic data,26 which is 8.7% more than that (1,284,108 ORFs) identified from the same dataset by evidence-based gene finding.
3.2. Composition of human gut microbiota
To compare the overall sequence similarities among the microbiomes from fecal and other-environmental samples,21,26,39 we performed a reciprocal BLASTP analysis of the whole gene set for each microbiome, followed by MDS clustering against the D2 normalized distance matrix (see ‘Materials and methods’). The data indicated that all gut microbiomes from the adults and weaned children form a distinct group (Fig. 1). In contrast, those from the unweaned infants were highly divergent from each other and from the microbiomes of the adults and children, as well as from those of other environments.
Figure 1.

Clustering analysis of microbiomes based on cumulative bitscore comparisons. MDS was applied to the distance matrix calculated from reciprocal pairwise BLASTP analysis among all predicted gene products. The dots represent fecal samples from adults and children (blue), unweaned infants (red), Americans (green), and samples from other natural environments (orange). Whale falls 1–3, Sargasso and soil indicate the metadata for microbial communities from the deep sea,39 surface seawater,26 and the surface soil of a farm,39 respectively.
To determine the microbial composition at the genus level, we next conducted a BLASTP analysis of all the predicted genes against the genes in our ‘in-house extended NR database’ (see ‘Materials and methods’). With a threshold of 90% BLASTP identity, 17–43% of the predicted genes could be assigned to particular genera (35–65 genera, 121 in total) in the adults and children (Fig. 2). A significantly higher proportion of genes (35–55%) was assignable (31–61 genera, 84 in total) in the unweaned infants, but, overall, the data indicated that the majority of gut microbes are as yet uncharacterized. We detected a total of 142 genera from the 13 samples in this analysis.
Figure 2.

Compositional view of human intestinal microbiomes. A compositional view of microbiomes based on the taxonomic assignment of protein-coding genes is shown. The stacked bars represent the compositions of each sample estimated from the results of BLASTP analysis with a 90% threshold identity. ‘Others’ includes the genera whose proportions were less than 1% in any of the samples. The data for the fecal samples from two American adults (‘Sub. 7’ and ‘Sub. 8’) are also shown.
Despite the low proportion of assigned genes, their taxonomic distribution indicated a clear compositional change after weaning. In the adults and weaned children, the major constituents were always Bacteroides, followed by several genera belonging to the division Firmicutes, such as Eubacterium, Ruminococcus, and Clostridium, and the genus Bifidobacterium. In the infants, Bifidobacterium and/or a few genera from the family Enterobacteriaceae, such as Escherichia, Raoultella, and Klebsiella, were the major constituents. A significant level of inter-individual variation was observed also among the adults and children, but there was a much higher variation among the unweaned infants.
To further evaluate the microbial composition at the species level, we examined the intra-genus diversity of Bacteroides and Bifidobacterium, the most dominant genera in the adults and children and in the infants, respectively. Taking advantage of the number of available genome sequences belonging to these two genera (11 species from Bacteroides, five from Bifidobacterium), we performed a mapping analysis of the shotgun reads to these genomes using the BLASTN program34 with a threshold of ≥95% identity and ≥150 bp aligned length. The analysis demonstrated that, for each infant, more than 80% of the shotgun reads were mapped to Bifidobacterium derived from a single species or genome (Supplementary Table S4). In contrast, the shotgun reads from the adults and children were mapped to multiple Bacteroides species except for In-A, suggesting a compositional complexity of this genus in human gut microbiota.
Together with the results of the shotgun sequence assembly (Table 1), the data from these compositional analyses showed a clear structural difference between the microbiota of the unweaned infants and those of the adults and weaned children. Infant microbiota were dominated by a few microbial species or strains, exhibiting rather simple structures, but showed a remarkable inter-individual variation. In contrast, most microbiota of the adults and children were much more complex in species composition, but exhibited high levels of overall sequence similarity between the samples. In In-A, the shotgun read sequences apparently derived from a few species of Bacteroides and Eubacterium were notably dominated (data not shown), accounting for the significantly shorter non-redundant sequence of In-A (see Subsection 3.1 and Table 1).
It should also be noted that the samples from Japanese and American21 adults differed significantly in composition, particularly in terms of Bacteroides and archaeal species (Fig. 2). The gut microbiomes from two American samples contained very few sequences and genes assigned to Bacteroides species and a significant number of sequences and genes assigned to an archaeal species, whereas the gut microbiomes from the Japanese samples contained a high ratio of sequences and genes assigned to Bacteroides species and almost no archaeal sequences and genes. Further studies should establish the reasons for these intriguing differences, which could be due to various factors including the genetic background and dietary style of the hosts, but also to differences in the experimental conditions between the two studies.
3.3. Functional assignment of predicted genes
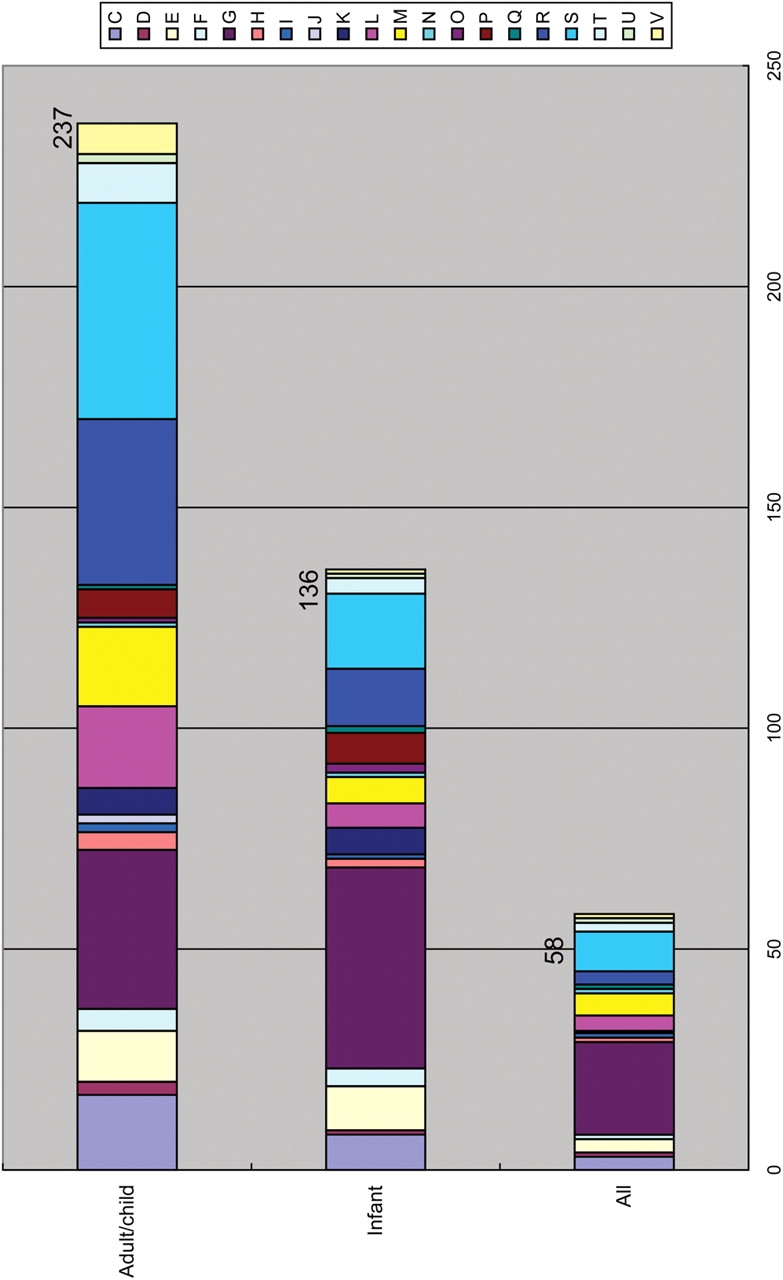
Functional assignment of predicted genes (662,548 in total) was made on the basis of BLASTP analysis against the ‘reference dataset for COG assignment’ (see ‘Materials and methods’). By this analysis, about 48% of the predicted genes were assigned to a total of 3,268 COGs (Table 1). The number of COGs identified in the infant microbiomes showed remarkable inter-individual variation (1617–2857 COGs), in contrast to those of the adults and children (2355–2921 COGs). Also, the number of orthologous genes belonging to each COG in the infants was on average about two-third of that observed in the adults and children. These results indicate that the gene repertoires in the gut microbiomes are more variable and functionally less redundant in infants than in adults and children.
To explore the functional characteristics of human intestinal microbiota, we looked for significantly over- or under-represented COGs in gut microbiomes when compared with Ref-DB (see ‘Materials and methods’). As shown in Fig. 3, human gut microbiomes showed patterns distinct from those of other environments such as sea and soil. The over-representation of COGs classified into the ‘Carbohydrate transport and metabolism’ category and the under-representation of those for ‘Lipid transport and metabolism’ were observed in all the human gut microbiomes examined in this study. However, a clear difference was observed between the adults/children and the unweaned infants. The gut microbiomes from the adults and children exhibited a uniform pattern, and the over-representation of COGs for ‘Defense mechanisms’ and under-representation of ‘Cell motility’, ‘Secondary metabolites biosynthesis, transport and catabolism’ and ‘Post-translational modification, protein turnover, chaperones’ were remarkable (Fig. 3B). In contrast, the infant microbiomes showed variable patterns (Fig. 3C). The enrichment values of all the COGs in each microbiome are shown in Supplementary Table S5.
Figure 3.
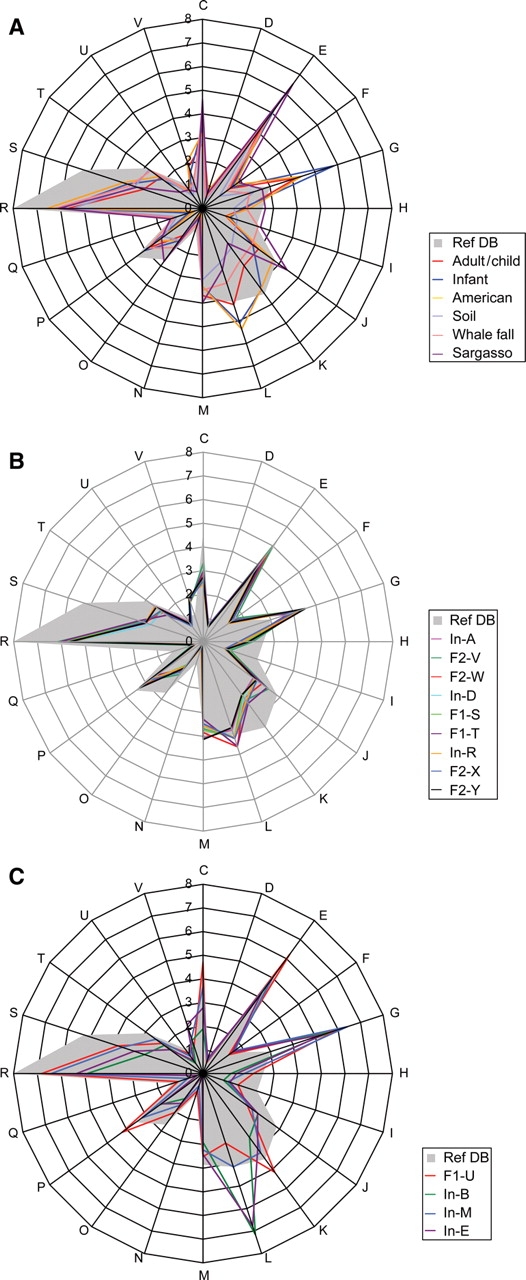
Summary of the COG assignment of predicted genes. (A) Comparison of the distribution patterns of COG-assigned genes between each type of microbiome and Ref-DB (for Ref-DB, see ‘Materials and methods’). Fecal samples from Japanese adults and children (nine samples), Japanese infants (four) and American adults (two), and three samples from whale fall were each averaged. (B) Distribution of COG-assigned genes in the nine microbiomes from adults and children. (C) Distribution of COG-assigned genes in the four microbiomes from unweaned infants; C: Energy production and conversion; D: Cell cycle control, mitosis, and meiosis; E: Amino acid transport and metabolism; F: Nucleotide transport and metabolism; G: Carbohydrate transport and metabolism; H: Coenzyme transport and metabolism; I: Lipid transport and metabolism; J: Translation; K: Transcription; L: Replication, recombination and repair; M: Cell wall/membrane biogenesis; N: Cell motility; O: Post-translational modification, protein turnover, chaperones; P: Inorganic ion transport and metabolism; Q: Secondary metabolites biosynthesis, transport and catabolism; R: General function prediction only; S: Function unknown; T: Signal transduction mechanisms; U: Intracellular trafficking and secretion; V: Defense mechanisms. The genes not assignable to any COGs are not shown in this figure.
Profiling analysis based on the COG enrichment values calculated for each microbiome further demonstrated that, while the gut microbiomes of the adults and children showed similar profiles, those of the infants had distinct and more variable profiles (Fig. 4; also see Supplementary Fig. S1). It may be noteworthy that neither this analysis nor the overall sequence similarity analysis shown in Fig. 1 provided any conclusive evidence for the resemblance of the genomic features of gut microbiomes among family members and within the sexes.
Figure 4.
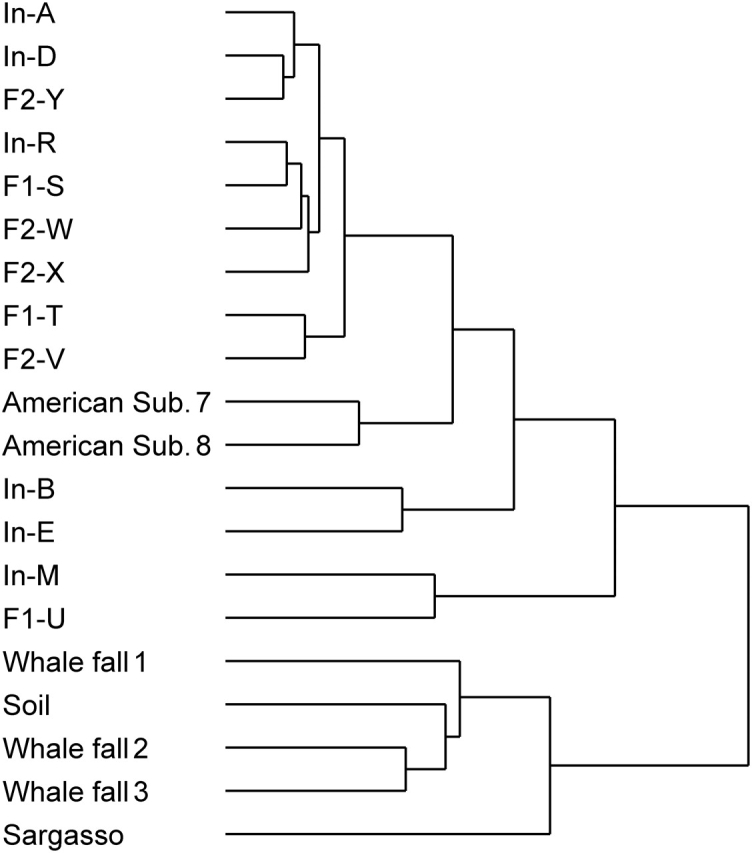
Relationship between human intestinal microbiomes and other-environmental microbiomes based on their functional profiles. The result of a clustering analysis of microbiomes based on the enrichment values of each COG calculated for each microbiome is shown. The matrix was clustered independently in the samples and COGs using the pairwise complete-linkage hierarchical clustering of the uncentered correlation (cluster-1.31). Also, see Supplementary Fig. S1.
3.4. A gene set commonly enriched in adult-type gut microbiomes
COGs that are commonly enriched in the microbiomes of all adults and children were searched, and 237 COGs met the following criteria: (i) the average enrichment value exceeds 2.0 and (ii) the enrichment value in all subjects exceeds 1.0 (Fig. 5 and Supplementary Table S6). When the samples from two adult Americans were included in the analysis, 79% (188) of the 237 COGs still met the above criteria, even though the American data contained, unusually, only a few sequences derived from Bacteroides species (Fig. 2). In contrast, only 5–10% of these COGs exhibited an enrichment value of >2.0 in the microbiomes of other environments. Therefore, these COGs are specifically enriched in adult-type gut microbiomes, and thus may encode important functions for the gut microbiota itself as well as for its host.
Figure 5.
Functional distribution of commonly enriched COGs. The functional distribution of commonly enriched COGs in adult/child microbiomes (‘A-gutCEGs’), in infant microbiomes (‘I-gutCEGs’), or in both types of microbiomes is shown: see Fig. 3 for the COG categorization.
Pyruvate-formate lyase (COG1882), which catalyzes the non-oxidative conversion of pyruvate to formate and acetyl-coenzyme A, was enriched. Unexpectedly, however, genes for the formate hydrogenlyase system that decomposes formate to CO2 and H2 were rather under-represented. In this regard, of interest is the enrichment of formyltetrahydrofolate synthetase (COG2759), methenyl tetrahydrofolate cyclohydrolase (COG3404), and methionine synthase (COG1410), all of which are enzymes involved in the regulation of one carbon pool by folate. Their enrichment may suggest that one carbon unit of formate can be utilized effectively by the gut microbiota in the folate-mediated cycle of one carbon pool. In contrast to the enrichment of enzymes for anaerobic pyruvate metabolism, the pyruvate dehydrogenase complex (COG2069) was profoundly depleted. All components of the oxidative tricarboxylic acid (TCA) cycle and the membrane respiratory chain (with the exception of NADH:ubiquinone oxidoreductase) were also significantly under-represented in all subjects, but phosphoenolpyruvate carboxykinase (COG1866) and pyruvate carboxyltransferase (COG5016), which generate oxaloacetate, an entry substrate to the TCA cycle in the reductive pathway, were enriched. Together with the striking depletion of most gene families whose products scavenge oxygen radicals, these findings reflect well the fact that the adult gut ecosystem is a kingdom of strict anaerobes.
The enrichment of carbohydrate metabolism genes was also striking: 24% (53 COGs) of the commonly enriched COGs had this function. At least 14 families of glycosyl hydrolases for plant-derived dietary polysaccharides and host tissue-derived proteoglycans or glycoconjugates were enriched in the adults. In addition, many enzymes involved in the metabolism of mono- or disaccharides released by these glycosyl hydrolases, such as l-fucose isomerase (COG2407), l-arabinose isomerase (COG2160), and galactokinase (COG0153), were also over-represented. Several peptidase families (COG1362, COG2195, COG3340, and COG3579) were also enriched, but most genes for fatty-acid metabolism were selectively reduced in number. These findings support the notion that the colonic microbiota utilizes otherwise indigestible polysaccharides and peptides as major resources for energy production and biosynthesis of cellular components.7,8 The enrichment of phosphoenolpyruvate carboxykinase (COG1866), glycogen synthase (COG0297) and ADP-glucose pyrophosphorylase (COG0448) suggests that energy storage is also an important activity of adult-type gut microbiota. This activity may be required for the gut microbiota to cope with intermittent nutrient supply in the adult gut. The enrichment of antimicrobial peptide transporters (COG0577 and COG1132) and a multidrug efflux pump (COG0534) is also of interest. Host intestinal cells produce various cationic antimicrobial peptides (CAMPs), such as beta-defensins.43 Many microorganisms also produce CAMPs to compete with other microbes sharing the same niche. The enrichment of antimicrobial peptide transporters and the multidrug efflux pump may play a primary role in the stable colonization of gut microbes in the adult intestine by conferring resistance to CAMPs.
The enrichment of several enzymes for DNA repair is also noteworthy (Supplementary Table S6). These enzymes may be needed to repair microbial DNA damage caused by genotoxic substances, such as nitrosamines and heterocyclic amines contained in ingested foods and secondary bile acids and nitroso compounds synthesized in the intestine via gut microbiota-involving processes.44 It is conceivable that not only the host cells but also intestinal microbes are constantly exposed to such genotoxic compounds.
Another distinguishing feature of the adult-type microbiota is the striking depletion of genes for the biosynthesis of flagella and chemotaxis (Supplementary Table S5). This implies that motility and chemotaxis are not required for the intestinal microbes to persist in the gut, where the contents are constantly stirred by peristalsis. Rather, flagellated microbes may be easily eliminated by the host immune system because flagella are highly immunogenic. Abnegation of motility may be another adaptation mechanism of gut microbes to the intestinal environment.
3.5. A gene set commonly enriched in infant-type gut microbiomes
Despite the high inter-individual variation, 136 COGs were found to be commonly enriched in the infant microbiomes (Fig. 5 and Supplementary Table S6). Of these, 58 were also over-represented in the adult/child microbiomes.
Genes for anaerobic energy production were also enriched in infants, but genes for the pyruvate dehydrogenase complex and all components of the oxidative TCA cycle were present in the infants at a frequency similar to that in Ref-DB. These findings may reflect the compositional feature of the infant gut microbiota, which contains considerable numbers of facultative anaerobes (Fig. 2).
In infant microbiomes, about 35% (47) of the 136 enriched COGs were for ‘Carbohydrate transport and metabolism,’ including 12 families of glycosyl hydrolases, nine of which were enriched also in the adult gut microbiomes. Unexpectedly, they included several enzymes that degrade non-digestible polysaccharides of plant origin, such as pullulanase and related glycosidases (COG1523), arabinogalactan endo-1,4-beta-galactosidase (COG3867), and endopolygalacturonase (COG5434). These enzymes may act to degrade oligosaccharides in breast milk or host-derived proteoglycans like mucin to maintain the functional homeostasis of gut epithelia.45 It is also possible that the gut microbiota is ready to utilize plant-derived polysaccharides to some extent before weaning.
The over-representation of various transport systems was also characteristic to infants, with 22% (29) of the 136 enriched COGs being transporters. In particular, the enrichment of phosphotransferase systems that mediate active sugar transport was remarkable. This prokaryote-specific transport system may play a central role in the uptake of lactose and other easily digestible simple sugars rich in breast milk. The over-representation of other transporters may also be advantageous to the microbes in the infant intestine because breast milk contains many other essential nutrients such as amino acids, long-chain fatty acids, nucleotides, vitamins, and minerals in a readily available form. The difference in diet between adults and unweaned infants appears to affect other functional properties as well. For instance, the genes for defense mechanisms and DNA repair that were over-represented in the adults were not so in the infants.
3.6. A CTn family amplified in the intestine
Although this remains largely unproven, the distal colon has been regarded an ecologically suitable site for horizontal gene transfer (HGT) between microorganisms due to its high microbial cell density.2 We identified many gene families related to transposases and bacteriophages in the metagenomic data, but their over-representation was noted only in certain individuals (Supplementary Table S5). An exception to this was a set of genes homologous to those on Tn1549-like CTns, which was notably enriched in most of the gut microbiomes analysed here (Fig. 6). Tn1549 was originally identified in an E. faecalis strain,30 thereafter, its relatives have been identified in another E. faecalis strain, Butyrivibrio, Clostridium, and Streptococcus.31,32,46,47 It has also been recorded that Tn1549 is transferable between C. symbiosum and Enterococcus spp.48 The homologues found in the metagenomic data accounted for 0.8% of all the predicted genes (5,325 genes in total) and were also enriched in the two fecal samples from American individuals21 (Fig. 6 and Supplementary Table S7). They were highly divergent in sequence from the corresponding genes on six known Tn1549-like CTns (Fig. 6C), but frequently appeared as gene clusters on contigs. We identified 89 contigs that contained four or more genes related to Tn1549-like CTns. These genes appeared there in the same or a similar gene organization as seen in Tn1549-like CTns (Supplementary Table S7), suggesting that they were derived from divergent members of a Tn1549-like CTn family, which we refer to as ‘CTnRINT’ (CTn rich in intestine). By analysing these contigs, we found that CTnRINT members contain a variety of genes, such as those for ABC-type multidrug transport systems, in the regions corresponding to that for the vancomycin-resistance genes on Tn1549 (data not shown). As shown in Fig. 6B, other known Tn1549-like CTns also contain various accessory genes in this region. These findings strongly suggest that the CTnRINT family is largely involved in the process of HGT in the human intestine. It seems reasonable that conjugal elements, which mediate genetic exchanges and transmittance through cell–cell contact, are key players in HGT in the colon.
Figure 6.

The Tn1549-like CTn family, ‘CTnRINT’, explosively amplified in human gut microbiomes. (A) Numbers of genes homologous to those on six known Tn1549-like CTns. Genes derived from each fecal sample are shown in different colors. Plum: In-A; brown: F2-V; light yellow: F2-W; light cyan: In-D; dark red: F1-S; salmon: F1-T; royal blue: In-R; pale turquoise: F2-X; midnight blue: F2-Y; magenta: F1-U; yellow: In-B; cyan: In-M; and maroon: In-E. (B) Gene organizations of six known Tn1549-like CTns. Tn1549 from E. faecalis strain BM4382, an unnamed CTn from E. faecalis V583, CTn4, CTn2 and CTn5 from C. difficile, and an unnamed CTn from S. pyogenes MGAS10750 are shown. Pentagons and circles represent ORFs. ORFs in the conserved regions are depicted in green, and orthologues are connected with pink vertical lines. The three ORFs depicted in blue are tentatively positioned in this figure to more clearly show their orthologous relationships, and their actual positions are indicated by dotted arrow lines. Orange pentagons represent the accessory genes of the six CTns. Those from Tn1549 and the CTn of E. faecalis V583 include vancomycin-resistance genes.30,32 (C) Sequence diversity of the Tn1549-like CTn family (‘CTnRINT’). All the CTnRINT-related gene products were searched for their best-hit homologues among those on the six known CTnRINT family members. The six columns represent Tn1549, the CTn from E. faecalis V583, CTn4, CTn2 and CTn5 from C. difficile, and the CTn from S. pyogenes MGAS10750, respectively (from left to right). The BLASTP identity (%) for a CTnRINT-related gene product was plotted in the CTn column where its best-hit homologue was identified.
In addition to the CTnRINT family, we found that integrases/site-specific recombinases belonging to COG4974 were remarkably expanded in the microbiomes of the adults and children. Most of them were apparently derived from several types of integrative mobile genetic elements such as Tn916-like CTns49, suggesting that other types of integrative elements are also richly present in human gut microbiomes.
3.7. Orphan gene families in human gut microbiomes
Of the 662,548 genes predicted in the 13 samples, 162,647 were orphan genes (25% of the total genes). Similarly, 503,115 orphan genes were obtained from other-environmental microbiomes.21,26,39 An all-to-all BLASTP analysis of these 665,762 orphan gene products followed by a clustering analysis (see ‘Materials and methods’) yielded 160,543 clusters and 461,435 singletons. Of the 160,543 clusters, 647 comprised five or more gene products derived only from human fecal samples (Supplementary Table S8). The largest two clusters, ID37 and ID39 containing 48 and 47 members, respectively, were present in the microbiomes of all the Japanese adults and children, and also in those of the American adults. For eight clusters that comprise ≥30 gene members, we performed motif search/extraction analyses by using the HMMER program against the Pfam motif database.41 Only two gene products in cluster ID44 showed a significant similarity to a Pfam motif (PF07508; recombinase); other gene products in cluster ID44 showed no significant similarity in the Pfam database. We could identify the conserved amino-acid sequences (38–50 amino acids) for each cluster by using the MEME program42 (Supplementary Fig. S2). These conserved sequences may represent new motifs specific to human gut microbiomes.
3.8. Remarks and future perspectives
The present study is the first large-scale comparative metagenomic analysis of human gut microbiomes. The data provided several new lines of insight into the genomic features of gut microbiota. First, our data clearly demonstrated a difference in overall composition and gene repertoire between adult- and infant-type gut microbiomes. The simple and less redundant features of the infant-type gut microbiota are probably linked to its high inter-individual variability (Figs. 1, 2, and 3C). We suggest that the infant-type can be viewed as unstable, yet dynamic and adaptable. Conversely, the functional uniformity observed in the adult-type microbiota (Figs. 1, 3B, and 4) may be attributable to its more complex nature (Fig. 2 and Tables 1 and S2), which in turn suggests that the insurance hypothesis50 for the benefit of biodiversity may be relevant to the gut.
Secondly, a comparison of the gene contents between gut microbiota and previously sequenced microbes revealed 237 COGs commonly enriched in adult-type microbiomes and 136 COGs in infant-type microbiomes (Fig. 5 and Supplementary Table S6). The characterization of these genes revealed distinct nutrient acquisition strategies in each type of microbiota, possibly to accommodate very different diets of their hosts. The analysis also revealed several possible strategies through which intestinal microbes adapt to the intestinal environment and establish symbiotic relationships with their host. Thus, these genes, which we refer to as ‘Adult- or Infant-gut Commonly Enriched Genes’ (A-gutCEGs or I-gutCEGs), appear to encode some of the core functions of each type of microbiota. It is noteworthy that the two gene sets contain as many as 104 gene families of unknown functions (Fig. 5). The in vitro and in vivo functions of these uncharacterized genes as well as those of the 647 ‘new’ gene families (Supplementary Table S8) would be important topics of future studies.
Thirdly, a survey of the enriched genes revealed an abundance of mobile genetic elements in the human intestinal gene pool, emphasizing that the human gut microbiota is a “hot spot” for HGT between microbes. Of particular importance is the abundance of conjugal elements including CTnRINT. Considering their high transfer efficiency, the broad range of hosts, and the frequent carriage of drug-resistance genes, it would be prudent to reassess the heavy use of antibiotics in modern medicine.
Finally, the metagenomic datasets presented here will be of great use for understanding the roles of gut microbiota in the etiology of human diseases and also for scientifically evaluating the efficacy of probiotics, prebiotics and other ‘functional foods’ that are widely used for modulating the intestinal microbiota in an effort to improve our health7.
Funding
This work was supported by Grants-in-Aid for Scientific Research on Priority Areas ‘Comprehensive Genomics’ (M.H.) and ‘Applied Genomics’ (T.H. and T.K.) from the Ministry of Education, Science, and Technology of Japan, and a Grant-in-Aid from the Institute for Bioinformatics Research and Development, the Japan Science and Technology Agency (BIRD-JST) (K.K.).
Supplementary Material
Acknowledgements
We thank Jun Ishikawa, Pawan K. Dhar, and Takeaki Taniguchi for their help and support with the data analysis, Noriko Itoh, Hiromi Inaba, Asako Tamura, Keiko Furuya, Kanako Motomura, Yasue Yamashita, Chie Yoshino, and Yuri Hayakawa for their technical assistances, Yumiko Hayashi for her editorial assistance, and those responsible for the microbial genome sequencing project at the Washington University Genome Sequencing Center for providing open access to unpublished genome sequence data.
Supplementary Data
Supplementary data are available online at www.dnaresearch.oxfordjournals.org.
References
- 1.Backhed F., Ley R. E., Sonnenburg J. L., Peterson D. A., Gordon J. I. Host-bacterial mutualism in the human intestine. Science. 2005;307:1915–1920. doi: 10.1126/science.1104816. [DOI] [PubMed] [Google Scholar]
- 2.Ley R. E., Peterson D. A., Gordon J. I. Ecological and evolutionary forces shaping microbial diversity in the human intestine. Cell. 2006;124:837–848. doi: 10.1016/j.cell.2006.02.017. [DOI] [PubMed] [Google Scholar]
- 3.Savage D. C. Microbial biota of the human intestine: a tribute to some pioneering scientists. Curr. Issues. Intest. Microbiol. 2001;2:1–15. [PubMed] [Google Scholar]
- 4.Tancrede C. Role of human microflora in health and disease. Eur J Clin Microbiol. Infect. Dis. 1992;11:1012–1015. doi: 10.1007/BF01967791. [DOI] [PubMed] [Google Scholar]
- 5.Eckburg P. B., Bik E. M., Bernstein C. N., et al. Diversity of the human intestinal microbial flora. Science. 2005;308:1635–1638. doi: 10.1126/science.1110591. [DOI] [PMC free article] [PubMed] [Google Scholar]
- 6.Fanaro S., Chierici R., Guerrini P., Vigi V. Intestinal microflora in early infancy: composition and development. Acta Paediatr. 2003;91(Suppl.):48–55. doi: 10.1111/j.1651-2227.2003.tb00646.x. [DOI] [PubMed] [Google Scholar]
- 7.Gibson G. R., Roberfroid M. B. Dietary modulation of the human colonic microbiota: introducing the concept of prebiotics. J. Nutr. 1995;125:1401–1412. doi: 10.1093/jn/125.6.1401. [DOI] [PubMed] [Google Scholar]
- 8.Guarner F., Malagelada J. R. Gut flora in health and disease. Lancet. 2003;361:512–519. doi: 10.1016/S0140-6736(03)12489-0. [DOI] [PubMed] [Google Scholar]
- 9.Hooper L. V., Gordon J. I. Commensal host-bacterial relationships in the gut. Science. 2001;292:1115–1118. doi: 10.1126/science.1058709. [DOI] [PubMed] [Google Scholar]
- 10.Backhed F., Ding H., Wang T., et al. The gut microbiota as an environmental factor that regulates fat storage. Proc. Natl. Acad. Sci. USA. 2004;101:15718–15723. doi: 10.1073/pnas.0407076101. [DOI] [PMC free article] [PubMed] [Google Scholar]
- 11.Rakoff-Nahoum S., Paglino J., Eslami-Varzaneh F., Edberg S., Medzhitov R. Recognition of commensal microflora by toll-like receptors is required for intestinal homeostasis. Cell. 2004;118:229–241. doi: 10.1016/j.cell.2004.07.002. [DOI] [PubMed] [Google Scholar]
- 12.Samuel B. S., Gordon J. I. A humanized gnotobiotic mouse model of host-archaeal-bacterial mutualism. Proc. Natl. Acad. Sci. USA. 2006;103:10011–10016. doi: 10.1073/pnas.0602187103. [DOI] [PMC free article] [PubMed] [Google Scholar]
- 13.Ley R. E., Turnbaugh P. J., Klein S., Gordon J. I. Microbial ecology: human gut microbes associated with obesity. Nature. 2006;444:1022–1023. doi: 10.1038/4441022a. [DOI] [PubMed] [Google Scholar]
- 14.Macdonald T. T., Monteleone G. Immunity, inflammation, and allergy in the gut. Science. 2005;307:1920–1925. doi: 10.1126/science.1106442. [DOI] [PubMed] [Google Scholar]
- 15.Manichanh C., Rigottier-Gois L., Bonnaud E., et al. Reduced diversity of faecal microbiota in Crohn's disease revealed by a metagenomic approach. Gut. 2006;55:205–211. doi: 10.1136/gut.2005.073817. [DOI] [PMC free article] [PubMed] [Google Scholar]
- 16.McGarr S. E., Ridlon J. M., Hylemon P. B. Diet, anaerobic bacterial metabolism, and colon cancer: a review of the literature. J. Clin. Gastroenterol. 2005;39:98–109. [PubMed] [Google Scholar]
- 17.Seksik P., Sokol H., Lepage P., et al. Review article: the role of bacteria in onset and perpetuation of inflammatory bowel disease. Aliment. Pharmacol. Ther. 2006;24(Suppl 3):11–18. doi: 10.1111/j.1365-2036.2006.03053.x. [DOI] [PubMed] [Google Scholar]
- 18.Turnbaugh P. J., Ley R. E., Mahowald M. A., Magrini V., Mardis E. R., Gordon J. I. An obesity-associated gut microbiome with increased capacity for energy harvest. Nature. 2006;444:1027–1031. doi: 10.1038/nature05414. [DOI] [PubMed] [Google Scholar]
- 19.Finegold S. M., Sutter V. L., Mathisen G. E. Normal indigenous flora, In. In: Hentges D. J., editor. Human Intestinal Microflora in Health and Disease. NY: Academic Press; 1983. pp. 3–31. [Google Scholar]
- 20.Tringe S. G., Rubin E. M. Nat. Rev. Genet. Vol. 6. Metagenomics: DNA sequencing of environmental samples; 2005. pp. 805–814. [DOI] [PubMed] [Google Scholar]
- 21.Gill S. R., Pop M., Deboy R. T., et al. Metagenomic analysis of the human distal gut microbiome. Science. 2006;312:1355–1359. doi: 10.1126/science.1124234. [DOI] [PMC free article] [PubMed] [Google Scholar]
- 22.Benno Y., Endo K., Mizutani T., Namba Y., Komori T., Mitsuoka T. Comparison of fecal microflora of elderly persons in rural and urban areas of Japan. Appl. Environ. Microbiol. 1989;55:1100–1105. doi: 10.1128/aem.55.5.1100-1105.1989. [DOI] [PMC free article] [PubMed] [Google Scholar]
- 23.Favier C. F., Vaughan E. E., De Vos W. M., Akkermans A. D. Molecular monitoring of succession of bacterial communities in human neonates. Appl. Environ. Microbiol. 2002;68:219–226. doi: 10.1128/AEM.68.1.219-226.2002. [DOI] [PMC free article] [PubMed] [Google Scholar]
- 24.Hopkins M. J., Sharp R., Macfarlane G. T. Age and disease related changes in intestinal bacterial populations assessed by cell culture, 16S RNA abundance, and community cellular fatty acid profiles. Gut. 2001;48:198–205. doi: 10.1136/gut.48.2.198. [DOI] [PMC free article] [PubMed] [Google Scholar]
- 25.Stewart J. A., Chadwick V. S., Murray A. Investigations into the influence of host genetics on the predominant eubacteria in the faecal microflora of children. J. Med. Microbiol. 2005;54:1239–1242. doi: 10.1099/jmm.0.46189-0. [DOI] [PubMed] [Google Scholar]
- 26.Venter J. C., Remington K., Heidelberg J. F., et al. Environmental genome shotgun sequencing of the Sargasso Sea. Science. 2004;304:66–74. doi: 10.1126/science.1093857. [DOI] [PubMed] [Google Scholar]
- 27.Hattori M., Tsukahara F., Furuhata Y., et al. A novel method for making nested deletions and its application for sequencing of a 300 kb region of human APP locus. Nuc. Acids Res. 1997;25:1802–1808. doi: 10.1093/nar/25.9.1802. [DOI] [PMC free article] [PubMed] [Google Scholar]
- 28.Huang X., Wang J., Aluru S., Yang S. P., Hillier L. PCAP: a whole-genome assembly program. Genome Res. 2003;13:2164–2170. doi: 10.1101/gr.1390403. [DOI] [PMC free article] [PubMed] [Google Scholar]
- 29.Noguchi H., Park J., Takagi T. MetaGene: prokaryotic gene finding from environmental genome shotgun sequences. Nucl. Acids Res. 2006;34:5623–5630. doi: 10.1093/nar/gkl723. [DOI] [PMC free article] [PubMed] [Google Scholar]
- 30.Garnier F., Taourit S., Glaser P., Courvalin P., Galimand M. Characterization of transposon Tn1549, conferring VanB-type resistance in Enterococcus spp. Microbiology. 2000;146(Pt 6):1481–1489. doi: 10.1099/00221287-146-6-1481. [DOI] [PubMed] [Google Scholar]
- 31.Sebaihia M., Wren B. W., Mullany P., et al. The multidrug-resistant human pathogen Clostridium difficile has a highly mobile, mosaic genome. Nat. Genet. 2006;38:779–786. doi: 10.1038/ng1830. [DOI] [PubMed] [Google Scholar]
- 32.Paulsen I. T., Banerjei L., Myers G. S., et al. Role of mobile DNA in the evolution of vancomycin-resistant Enterococcus faecalis. Science. 2003;299:2071–2074. doi: 10.1126/science.1080613. [DOI] [PubMed] [Google Scholar]
- 33.Beres S. B., Richter E. W., Nagiec M. J., et al. Molecular genetic anatomy of inter- and intraserotype variation in the human bacterial pathogen group A Streptococcus. Proc. Natl. Acad. Sci. USA. 2006;103:7059–7064. doi: 10.1073/pnas.0510279103. [DOI] [PMC free article] [PubMed] [Google Scholar]
- 34.Altschul S. F., Madden T. L., Schaffer A. A., et al. Gapped BLAST and PSI-BLAST: a new generation of protein database search programs. Nucl. Acids Res. 1997;25:3389–3402. doi: 10.1093/nar/25.17.3389. [DOI] [PMC free article] [PubMed] [Google Scholar]
- 35.DeLong E. F., Preston C. M., Mincer T., et al. Community genomics among stratified microbial assemblages in the ocean's interior. Science. 2006;311:496–503. doi: 10.1126/science.1120250. [DOI] [PubMed] [Google Scholar]
- 36.Kunin V., Ahren D., Goldovsky L., Janssen P., Ouzounis C. A. Measuring genome conservation across taxa: divided strains and united kingdoms. Nucl. Acids Res. 2005;33:616–621. doi: 10.1093/nar/gki181. [DOI] [PMC free article] [PubMed] [Google Scholar]
- 37.Korbel J. O., Snel B., Huynen M. A., Bork P. SHOT: a web server for the construction of genome phylogenies. Trends Genet. 2002;18:158–162. doi: 10.1016/s0168-9525(01)02597-5. [DOI] [PubMed] [Google Scholar]
- 38.de Hoon M. J., Imoto S., Nolan J., Miyano S. Open source clustering software. Bioinformatics. 2004;20:1453–1454. doi: 10.1093/bioinformatics/bth078. [DOI] [PubMed] [Google Scholar]
- 39.Tringe S. G., Mering von C., Kobayashi A., et al. Comparative metagenomics of microbial communities. Science. 2005;308:554–557. doi: 10.1126/science.1107851. [DOI] [PubMed] [Google Scholar]
- 40.Enright A. J., Van Dongen S., Ouzounis C. A. An efficient algorithm for large-scale detection of protein families. Nucl. Acids Res. 2002;30:1575–1584. doi: 10.1093/nar/30.7.1575. [DOI] [PMC free article] [PubMed] [Google Scholar]
- 41.Finn R. D., Mistry J., Schuster-Bockler B., Griffiths-Jones S., et al. Pfam: clans, web tools and services. Nucl. Acids Res. 2006;34(Database Issue):D247–D251. doi: 10.1093/nar/gkj149. [DOI] [PMC free article] [PubMed] [Google Scholar]
- 42.Bailey T. L., Elkan C. Fitting a mixture model by expectation maximization to discover motifs in biopolymers. Proc. Int. Conf. Intell. Syst. Mol. Biol. 1994;2:28–36. [PubMed] [Google Scholar]
- 43.Peschel A., Sahl H. G. The co-evolution of host cationic antimicrobial peptides and microbial resistance. Nat. Rev. Microbiol. 2006;4:529–536. doi: 10.1038/nrmicro1441. [DOI] [PubMed] [Google Scholar]
- 44.Wakabayashi K., Nagao M., Esumi H., Sugimura T. Food-derived mutagens and carcinogens. Cancer Res. 1992;52:2092s–2098s. [PubMed] [Google Scholar]
- 45.Bry L., Falk P. G., Midtvedt T., Gordon J. I. A model of host-microbial interactions in an open mammalian ecosystem. Science. 1996;273:1380–1383. doi: 10.1126/science.273.5280.1380. [DOI] [PubMed] [Google Scholar]
- 46.Domingo M. C., Huletsky A., Bernal A., et al. Characterization of a Tn5382-like transposon containing the vanB2 gene cluster in a Clostridium strain isolated from human faeces. J. Antimicrob. Chemother. 2005;55:466–474. doi: 10.1093/jac/dki029. [DOI] [PubMed] [Google Scholar]
- 47.Melville C. M., Brunel R., Flint H. J., Scott K. P. The Butyrivibrio fibrisolvens tet(W) gene is carried on the novel conjugative transposon TnB1230, which contains duplicated nitroreductase coding sequences. J. Bacteriol. 2004;186:3656–3659. doi: 10.1128/JB.186.11.3656-3659.2004. [DOI] [PMC free article] [PubMed] [Google Scholar]
- 48.Launay A., Ballard S. A., Johnson P. D., Grayson M. L., Lambert T. Transfer of vancomycin resistance transposon Tn1549 from Clostridium symbiosum to Enterococcus spp. in the gut of gnotobiotic mice. Antimicrob. Agents. Chemother. 2006;50:1054–1062. doi: 10.1128/AAC.50.3.1054-1062.2006. [DOI] [PMC free article] [PubMed] [Google Scholar]
- 49.Franke A. E., Clewell D. B. Evidence for a chromosome-borne resistance transposon (Tn916) in Streptococcus faecalis that is capable of “conjugal” transfer in the absence of a conjugative plasmid. J. Bacteriol. 1981;145:494–502. doi: 10.1128/jb.145.1.494-502.1981. [DOI] [PMC free article] [PubMed] [Google Scholar]
- 50.Yachi S., Loreau M. Biodiversity and ecosystem productivity in a fluctuating environment: the insurance hypothesis. Proc. Natl. Acad. Sci. USA. 1999;96:1463–1468. doi: 10.1073/pnas.96.4.1463. [DOI] [PMC free article] [PubMed] [Google Scholar]
Associated Data
This section collects any data citations, data availability statements, or supplementary materials included in this article.