

Abstract
In biological tissue, complex mechanisms of cellular response are closely linked to the mechanical environment that cells experience. The key to understanding these mechanisms may lie in measurement of local mechanical fields near living cells and in between cells. We have developed a novel optical measurement technique which combines the light elastically scattered from gold nanorods with digital image analysis to track local deformations that occur in vitro between cells, in real time, under darkfield optical microscopy. We find that measurable tension and compression exist in the intercellular matrix at the length scale of microns, as the cells assess, adapt and rearrange their environment.
It is well-established that cellular response to mechanical environment is critical to cell/tissue function.1-8 Studies have shown that physical cues, transmitted through the largely collagenous network of the extracellular matrix (ECM), are recognized by the cells and trigger complex, mechanical and biochemical responses (mechanotransduction) including adaptive remodeling.1-8 Many studies have examined the bulk mechanical response of tissues; others have focused on the properties and response of isolated cells under mechanical load, specifically adaptive changes to the cytoskeleton.1-9 In vivo, however, it is likely that characterization of the local mechanical environment experienced by cells, on the length scale of microns, may be needed to more clearly elucidate the complex mechanisms associated with mechanotransduction.10
Metallic nanoparticles that have at least one dimension in the 1-100 nm size regime are gaining increased usage in biological applications due to their small size and unique optical properties in the visible-near infrared region of the electromagnetic spectrum.11 Nanoscale metal particles exhibit brilliant colors in the visible that are due to the collective oscillation of electrons, termed plasmons, in the conduction band of the metal.11 Furthermore, the position and number of the plasmon bands of a metal can be tailored by rational control of particle size, shape, and aggregation state.12-15
In this paper we describe experiments in which gold nanorods are used to track local deformations between cells and within the ECM in real time. Previously, we have shown that this general approach correctly yields local deformation and strain data in manually stretched polyvinyl alcohol and poly(dimethylsiloxane) thin films, in which no local heterogeneity was expected.16 In this work, gold nanorods are embedded in cell-populated (neonatal cardiac fibroblasts) collagen films. Collagen gels or films are widely accepted as a material model for the ECM. The cell-collagen films undergo endogenous loading due to cell traction forces as the cells, through their physical attachments to the ECM network, test their environment. This assessment of the surrounding structure directs cell morphology, can potentially guide cell migration and can initiate adaptive remodeling of the ECM, including the production of additional collagen.1 The relatively short term results of this loading, however, are local deformations, as the cells tug on the collagen. As the collagen network is deformed by cell traction forces, the pattern of scattered light from the embedded nanorods also shifts and deforms. Digital image analysis can then be used to track the movement and deformation of the light pattern, and to calculate local material deformations. Simultaneous fluorescence imaging can also be used to identify cell locations, in order to associate strain fields with the relevant cell spatial positions, morphologies and orientations.
Gold nanorods (376 ± 105 nm, 26 ± 5 nm) were prepared in aqueous solution using a seed-mediated surfactant-directed approach previously described and purified by centrifugation and washing.17-19 The overall reaction is one in which HAuCl4 is reduced to elemental gold in the presence of a cationic surfactant, cetyltrimethylammonium bromide (CTAB). The nanorods are coated with a bilayer of the cationic surfactant CTAB, which renders them water-soluble and highly positively-charged.20,21 We have previously shown that CTAB bound to small gold spheres is not cytotoxic to human cells.22
Collagen thin films were prepared by adding 250 μL of a solution containing 100 μL 0.2N HEPES buffer (pH 9.0), 100 μL 10X MEM, and 800 μL type I collagen to a square chamber slide.23 25 μL of nanorod solution was then added drop-wise to the top of the film and cured at approximately 40 °C for > 2 h. Subsequently, a second layer was added to the already cured collagen film, with only the top layer containing as-prepared rods, to increase the thickness of the film. These films were subsequently plated with 100,000 neonatal rat cardiac fibroblasts, and stained with a fluorescent dye, 5-chloromethylfluoresceindiacetate (CMFDA). Once plated, the films were incubated (5 % CO2, 37 °C) for approximately 5 h prior to imaging. All optical studies were performed on a Nikon Eclipse model ME600L microscope equipped with bright field, dark field, and fluorescent imaging capabilities. The excitation wavelength range for the fluorescence imaging was 450-490 nm.
Images were collected over a two-hour time interval between 5-7 h after cell plating. This time period allowed for the measurement of cell-induced deformations both locally, around individual cells, as well as collectively over multiple cell domains. The components of the imaging are shown in the three panels of Fig. 1; from left to right, the field of scattered light from the nanorods (darkfield image), with inset showing TEM image of nanorods; an overlay of the nanorods over the cells (darkfield and fluorescence); and the field of cells (fluorescence).
Figure 1.
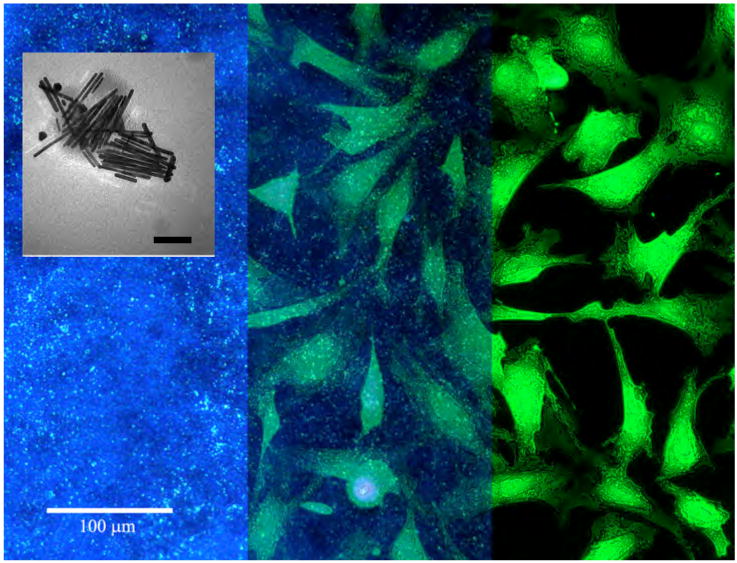
Darkfield optical micrograph of light scattered from gold nanorods (left panel); simultaneous fluorescence image of cardiac fibroblasts (right panel); the two images superimposed with some transparency (center panel). Fluorescent image has been enhanced by outlining the cells and increasing contrast for clarity in the overlay. Scale bar = 100 microns. Inset: Transmission electron micrograph of the gold nanorods. Scale bar (inset) = 100 nm.
To illustrate the degree of cell extension movement, fluorescence images of the stained cells taken at the beginning and at the end of the time sequence used in this work are shown in Figure 2. Changes in cell morphology and motion of cell extensions are visible. The reader is referred to the online movie accompanying this paper for a more clear and compelling visualization of this process.
Figure 2.
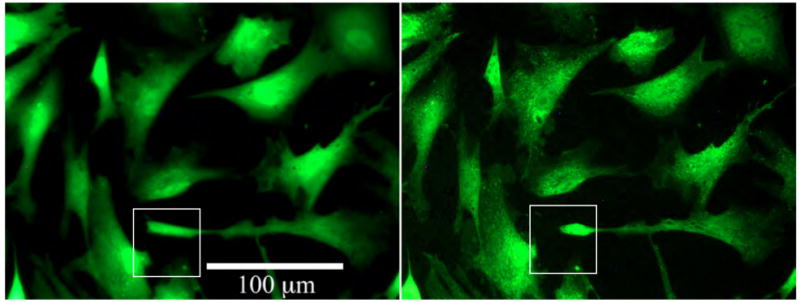
Fluorescence images of stained fibroblast cells at t = 5 h (left) and t = 7 h (right). Cells show changes in morphology as they mechanically adjust to their environment.
Many of these visible cell motions will result in a corresponding deformation of the underlying and surrounding collagen network. Since cells attach at discrete points, through focal adhesions, the application of the load may not be uniformly distributed along the outline of the cell and not all cell motion will result in deformation of the collagen. It has also been well established that at the micron scale, the collagen network itself does not behave as a homogenous material, and its varying stiffness and density will result in spatially different responses under the same loads.24 Tracking these locally varying displacement and strain fields was done using the image correlation software VIC-2D©, developed at the University of South Carolina.25 This software maps spatial locations in an undeformed reference state to locations in images taken at various stages of deformation by comparing (correlating through an optimization algorithm) pixel gray scale intensities in a sequence of small sub areas of the full digital image. In our case, the spatial locations correspond to the light scattered from gold nanorods at different places in the image, and pixels are either gray (no nanorods in that spot) or white (nanorods are in that spot). As the nanorods move in concert with the collagen in which they are embedded, the positions of the scattered light “pixels” are displaced. Displacements are measured directly from this mapping. The software then constructs a smooth surface through the displacement field and approximates strains, which are gradients of displacements and are dimensionless, by differentiating this surface. The Lagrangian (non-linear) strains, , (summed over k) where γij are the components of the strain tensor in the plane, u = x − X is the displacement vector, defined as the change between the deformed position x = (x1,x2,x3) and the reference position X = (X1,X2,X3) are calculated, which makes the method appropriate for biological materials which are likely to experience large strains; small (linearized) strain theory approximation would be less accurate.
Contour maps of the normal strain in the horizontal (x-axis) direction at the time points 320, 400 and 420 minutes are shown in Figure 3. The scale of the strain fields in all three images is the same.
Figure 3.

Cells and corresponding strain field maps. Row 1: t = 320 minutes; Row 2: t = 400 minutes; Row 3: t = 420 minutes. In each row, left to right, are the fluorescently tagged cells, a transparent overlay of strain fields on cells, and strain fields. Violet indicates the maximum compressive strain, red the maximum tensile strain. Color scale at the bottom runs from violet -0.0015(compressive) to 0.0038 (tensile) strain.
By convention, compressive strains are labeled as negative and tensile strains positive. In Figure 3, strains run from a maximum magnitude of compressive strain of 0.0015 (violet) to a maximum tensile strain (red) of 0.0038. Visually, zero strain is the middle green. Improper focusing might lead to apparent strain fields. Inconsistent focusing might generate apparent strains in addition to the true planar fields. We performed control experiments in which we deliberately focused and unfocused the microscope, and from the resulting “displacements” of the nanorods, calculated strain fields. The strains resulting from refocusing a single image were on the order of 0.00002 (0.002%), far smaller than the strains measured when cells were actually moving.
Under the conditions of these tests, cellular response would be expected to vary with film thickness, collagen concentration and cell density. These experiments are in progress. However, it is possible to see in the data already presented the progression of tension followed by relaxation corresponding to the movement of the cell extensions. Movies showing the cell motion (as per Fig. 2), and the complete set of fields evolving over time for the horizontal strains (as per Fig. 3), as well as for the vertical strains, are provided online as a Web-enhanced object.
A purely qualitative examination based on Fig. 3 suggests a visual form of the correlation between the patterns of tensile and compressive strains and the patterns in cell spatial arrangement. Further quantitative analysis can be done using the software to extract data from specific regions for more specific comparisons to cell shape, locations, or orientations, etc. For example, Figure 4 plots axial strains as a function of position along a horizontal line across one region of the digital image (Figure 4 insert). Clearly, at different times, a given region of the cell-collagen composite material might experience a transient 6-fold increase in strain (at arbitrary position pixel 72), or 3-fold decreases in strain (at position pixels 50-60).
Figure 4.
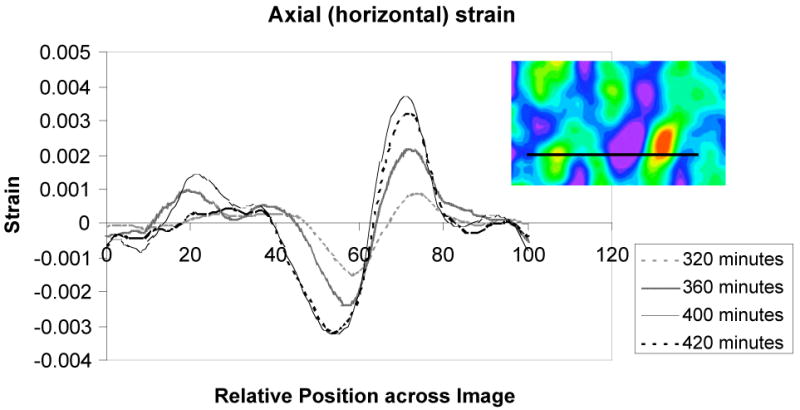
Axial strains as a function of position through one slice of the data (inset) for various times: light dashed line, 320 minutes; thick solid line, 360 minutes; thin solid line, 400 minutes; dark dashed line, 420 minutes.
Over this relatively short time span, we observed small, for a polymeric material, maximum absolute axial tensile strains (∼ 0.3%). Strains which result from cell traction forces, however, have the potential to be fairly large. In comparison, Vanni et al have used the pattern provided by the collagen network itself as an in situ strain gauge.26 Over a period of 4 to 60 hours, they observed strains in sparsely populated collagen gels (∼100-500 cells) in the range of 0.20 – 0.36 (20% - 36%). Wang et al tracked cells on polyacrylamide gels embedded with fluorescent beads.9 They measured displacements on this relatively stiff substrate of about 3 microns resulting from cell spreading. Our displacements, in a much more compliant medium, are on the order of 18 microns. Light scattering from metal nanoparticles, in comparison to fluorescence methods with dyes, does not suffer from photobleaching effects;28 and fluorescence resonance energy transfer between fluorescent donors and acceptors are capable only of inferring relative positions on much smaller scales, from ∼1 to ∼10 nm, which are not as relevant for full-scale cellular motion.
Understanding the complex mechanisms involved in mechanotransduction requires methods of quantifying local mechanical effects at relevant length scales and within more realistic model systems. In particular, since it has been clearly established that cell response is significantly different in a more three-dimensional environment, as compared to flat planar substrates,27 methods of making measurements within 3-D environments are critical. Our results, demonstrated in thick films, show the potential of using gold nanorods to facilitate local deformation measurements in real time within soft tissue and ultimately in thicker gels. Our data also illustrates the capability of this technique to measure subtle strain fields within the context of a relatively large field of view, offering a method whereby multi-cell measurements at sub-cell length scales can be accessed.
Other investigators have used the light elastically scattered from metal nanoparticles to detect biological molecules, to image transport processes into cells, and to infer metal nanorod rotation in solution.28-34 Based on the data presented here, it is clear that the potential exists to perform these kinds of chemical studies in concert with mechanical studies, providing a more complete picture of the multiple environments experienced by living cells – all enabled by the optical properties of biocompatible metal nanoparticles.
Supplementary Material
Three movies are available for viewing (Quicktime preferred): CellMov.mov, which shows a fluorescence microscopy image of cells as a function of time, to show cell movement; exx.mov, which shows the horizontal axial strains, corresponding to the deformations shown in CellMov.mov; and eyy.mov, which shows the vertical axial strains, corresponding to the deformations shown in CellMov.mov.
Acknowledgments
We would like to thank Professor Chris Robinson (USC Department of Art) for help with the figures and visualization techniques, Mary Morales (USC School of Medicine) for help with the tissue cultures, and Dr. Chris Orendorff (currently at Sandia National Laboratory) for significant scientific contributions to the above work. This work was supported by NIH Grant Number P20 RR-016461 from the National Center for Research Resources, NIH Grant Number HL73937 from the Heart, Lung and Blood Institute, and by the National Science Foundation Grant No. CMS-0555329.
References
- 1.Humphrey JD. J Biomech Eng, Trans ASME. 2001;123:638–641. doi: 10.1115/1.1406131. [DOI] [PubMed] [Google Scholar]
- 2.Roeder BA, Kokini K, Robinson JP, Voytik-Harbin SL. J Biomech Engr Trans ASME. 2004;126:699–708. doi: 10.1115/1.1824127. [DOI] [PubMed] [Google Scholar]
- 3.Costa KD, Holmes JW, McCulloch AD. Phil Trans R Soc Lond A. 2001;359:1233–1250. [Google Scholar]
- 4.Grinnell F. Trends Cell Biol. 2003;13:264–269. doi: 10.1016/s0962-8924(03)00057-6. [DOI] [PubMed] [Google Scholar]
- 5.Ingber DE. Circulation Res. 2002;91:877–887. doi: 10.1161/01.res.0000039537.73816.e5. [DOI] [PubMed] [Google Scholar]
- 6.Swartz MA, Tshumperlin DJ, Kamm RD, Drazen JM. Proc Natl Acad Sci USA. 2001;98:6180–6185. doi: 10.1073/pnas.111133298. [DOI] [PMC free article] [PubMed] [Google Scholar]
- 7.Bao G, Suresh S. Nature Materials. 2003;3:715–725. doi: 10.1038/nmat1001. [DOI] [PubMed] [Google Scholar]
- 8.Zhu C, Bao G, Wang N. Annu Rev Biomed Engr. 2000;2:189–226. doi: 10.1146/annurev.bioeng.2.1.189. [DOI] [PubMed] [Google Scholar]
- 9.Wang N, Ostuni E, Whitesides GM, Ingber DE. Cell Motil Cytoskel. 2002;52:97–106. doi: 10.1002/cm.10037. [DOI] [PubMed] [Google Scholar]
- 10.Pederson JA, Swatz MA. Ann Biomed Engr. 2005;33:1469–1490. doi: 10.1007/s10439-005-8159-4. [DOI] [PubMed] [Google Scholar]
- 11.El-Sayed MA. Acc Chem Res. 2001;34:257–264. doi: 10.1021/ar960016n. [DOI] [PubMed] [Google Scholar]
- 12.Feldheim DL, Foss CA., Jr . Metal Nanoparticles: Synthesis, Characterization and Applications. Marcel Dekker; New York: 2002. [Google Scholar]
- 13.Kelly KL, Coronado E, Zhao LL, Schatz GC. J Phys Chem B. 2003;107:668–677. [Google Scholar]
- 14.Sosa IO, Noguez C, Barrera RG. J Phys Chem B. 2003;107:6269–6275. [Google Scholar]
- 15.van der Zande BMI, Pages L, Hikmet RAM, van Blaaderen A. J Phys Chem B. 1999;103:5761–5767. [Google Scholar]
- 16.Orendorff CJ, Baxter SC, Goldsmith EC, Murphy CJ. Nanotechnology. 2005;16:2601–2605. [Google Scholar]
- 17.Jana NR, Gearheart L, Murphy CJ. Adv Mater. 2001;13:1389–1393. [Google Scholar]
- 18.Jana NR, Gearheart L, Murphy CJ. J Phys Chem B. 2001;105:4065–4067. [Google Scholar]
- 19.Murphy CJ, Sau TK, Gole AM, Orendroff CJ, Gao J, Gou L, Hunyadi SE, Li T. J Phys Chem B. 2005;109:13857–13870. doi: 10.1021/jp0516846. [DOI] [PubMed] [Google Scholar]
- 20.Nikoobakht B, El-Sayed MA. Langmuir. 2001;17:6368–6374. [Google Scholar]
- 21.Sau TK, Murphy CJ. Langmuir. 2005;21:2923–2329. doi: 10.1021/la047488s. [DOI] [PubMed] [Google Scholar]
- 22.Connor EE, Mwamuka J, Gole A, Murphy CJ, Wyatt MD. Small. 2005;1:325–327. doi: 10.1002/smll.200400093. [DOI] [PubMed] [Google Scholar]
- 23.Bell E, Ivarsson B, Merill C. Proc Natl Acad Sci U S A. 1979;76:1274–1278. doi: 10.1073/pnas.76.3.1274. [DOI] [PMC free article] [PubMed] [Google Scholar]
- 24.Birk D, Frederick H, Trelstad RL, Trelstad S. Cell Biology of the Extracellular Matrix. 2nd. Plenum Press; New York and London: 1991. pp. 221–249. [Google Scholar]
- 25.Sutton MA, Wolters WJ, Peters WH, Ranson WF, McNeill SR. Image Vision Computing. 1983;1:133–139. [Google Scholar]
- 26.Vanni S, Lagerholm C, Otey C, Taylor LD, Lanni F. Biophysical J. 2003;84:2715–2727. doi: 10.1016/s0006-3495(03)75077-2. [DOI] [PMC free article] [PubMed] [Google Scholar]
- 27.Pankov CE, Stevens DR, Yamada KM. Science. 2001;294:1708–1712. doi: 10.1126/science.1064829. [DOI] [PubMed] [Google Scholar]
- 28.Schultz S, Smith DR, Mock JJ, Schultz DA. Proc Natl Acad Sci. 2000;97:996–1001. doi: 10.1073/pnas.97.3.996. [DOI] [PMC free article] [PubMed] [Google Scholar]
- 29.Xu XHN, Chen J, Jeffers RB, Kyriacou S. NanoLett. 2002;2:175–182. [Google Scholar]
- 30.McFarland AD, Van Duyne RP. NanoLett. 2003;3:1057–1062. [Google Scholar]
- 31.Raschke G, Kowarik S, Franzl T, Sonnichsen C, Klar TA, Feldmann J, Nichtl A, Kurzinger K. NanoLett. 2003;3:935–938. [Google Scholar]
- 32.Xu XHN, Brownlow WJ, Kyriacou SV, Wan Q, Viola JJ. Biochemistry. 2004;43:10400–10413. doi: 10.1021/bi036231a. [DOI] [PubMed] [Google Scholar]
- 33.El-Sayed IH, Huang X, El-Sayed MA. NanoLett. 2005;5:829–834. doi: 10.1021/nl050074e. [DOI] [PubMed] [Google Scholar]
- 34.Sonnichsen C, Alivisatos AP. NanoLett. 2005;5:301–304. doi: 10.1021/nl048089k. [DOI] [PubMed] [Google Scholar]
Associated Data
This section collects any data citations, data availability statements, or supplementary materials included in this article.
Supplementary Materials
Three movies are available for viewing (Quicktime preferred): CellMov.mov, which shows a fluorescence microscopy image of cells as a function of time, to show cell movement; exx.mov, which shows the horizontal axial strains, corresponding to the deformations shown in CellMov.mov; and eyy.mov, which shows the vertical axial strains, corresponding to the deformations shown in CellMov.mov.