Abstract
High power ultrasound (20 kHz) was used to encapsulate a solution of perchlorotriphenylmethyl triester (PTM-TE, a stable organic free radical) dissolved in hexamethyl disiloxane (HMDS) into a polymerized shell of bovine serum albumin (BSA). The size distribution of the microspheres was between 0.5 to 3 μm with a maximum at approximately 1.2 μm. The electron paramagnetic resonance spectrum of PTM-TE consists of a single, sharp line which is sensitive to the surrounding concentration of oxygen. It was found that the technique of encapsulating a solution of PTM-TE dissolved in HMDS into the BSA microspheres resulted in an overall loss of EPR signal intensity from the washed suspension of microspheres. However, the encapsulated PTM-TE/HMDS solution remained sensitive to the partial pressure of oxygen in the surrounding environment. The microspheres were found to be useful for determining the partial pressure of oxygen in the muscle and tumor tissue of mice.
Keywords: Sonochemistry, oximetry, perchlorotriphenylmethyl radical, hexamethyl disiloxane, tumor
1. Introduction
Sonochemistry results from the ultrasound-induced formation, growth and fast, almost adiabatic collapse of cavitation bubbles in a liquid 1,2. Extremely high temperatures and pressures prevail in the microscopic region of bubble collapse, known as the “hot spot” and in aqueous solutions the thermal dissociation of water vapor in hot spots produces hydroxyl radicals and hydrogen atoms 3. In the presence of air, hydrogen atoms can react with oxygen to form the perhydroxyl radical which at neutral pH dissociates to form the superoxide radical anion 4. Furthermore, when aqueous sonolysis is conducted in the presence of organic solutes, a number of chemical 5–9 and biological 10–12 effects can arise, depending on the physical and chemical nature of the solute.
Recently, we have been developing a new series of particulate spin probes based on alkali metal derivatives of phthalocyanines. Lithium phthalocyanine (LiPc) 13–17 and lithium naphthalocyanine (LiNc) 18,19 and its derivative 20–23 were synthesized and their properties studied in detail. The materials were characterized as crystalline solids composed of stacks of neutral free radical molecules 24. The crystalline solids exhibit a highly exchange-narrowed single line EPR spectrum, whose width is sensitive to the partial pressure of molecular oxygen (pO2) in the environment. The structure and properties of these materials can be modified using a combination of low and high frequency ultrasound 25. We are also developing soluble spin probes for in vivo applications of EPR oximetry and imagining. However, some probes of interest, such as perchlorotriphenylmethyl triester (PTM-TE), are highly hydrophobic in nature and need to be injected using organic solvents that are not so compatible with the organism. We have therefore investigated the use of ultrasonically synthesized proteinaceous microspheres, following the work of Suslick and co-workers 26–29.
Proteinaceous microspheres have previously been synthesized using high power ultrasound operating at a frequency of 20 kHz 26–29. Typically, human or bovine serum albumin (BSA) dissolved in aqueous solution is irradiated in the presence of another immiscible organic solvent in which a solute of interest can be dissolved. As described recently, proteinaceous microspheres have a wide variety of potential biomedical applications 30. Suslick, Swartz and their co-workers 28,29 have successfully encapsulated nitroxides dissolved in an organic liquid and have used these nitroxide-filled microspheres for in vivo determination of temperature and oxygen concentrations using EPR spectroscopy. Nitroxides are stable free radicals and therefore possess an unpaired electron which can be observed using EPR spectroscopy. Since the electron is in close vicinity to the nitrogen atom, the absorption line of the electron is split into three equivalent lines by the nitrogen nucleus. These lines become broadened in the presence of oxygen due to Heisenberg exchange between molecular oxygen and the nitroxide, so that line broadening of the nitroxide signal can be used as a measure of oxygen concentration 28. Though there are a variety of soluble EPR spin probes, such as nitroxides and triaryl methane radical (TAM) that are suitable for oximetry, they lack the sensitivity required to obtain reliable oxygen measurements especially in the most desired pathophysiological oxygen range (0–76 mmHg) 31.
Unlike nitroxides, the EPR spectrum of PTM-TE under anoxic conditions consists of a single, sharp line (peak-to-peak line-width, LW = 0.4 G) which broadens up to a maximum of 4.1 G as the partial pressure of oxygen is increased to that of oxygen in air at atmospheric pressure (i.e., 760 mmHg). Since PTM-TE exhibits a single line in the EPR spectrum, it should be easier to detect at lower concentrations in vivo, compared to nitroxides. Thus it was of interest in the current study to encapsulate PTM-TE dissolved in HMDS into sonochemically synthesized BSA microspheres and to test their oxygen sensitivity in vitro and in vivo, i.e., in the tumor and muscle tissue of the hind leg of a mouse.
2. Experimental Section
2.1 Chemicals
BSA (Fraction V, 99%) was purchased from Sigma-Aldrich, USA. Hexamethyl disiloxane (HMDS, ≥ 98% purity) was purchased from Acros Organics (New Jersey). Perchlorotriphenylmethyl triester (PTM-TE) was synthesized as reported 32. All solutions were made up using Milli-Q filtered water (conductivity < 10−6 S cm−1).
2.2 EPR measurements
EPR measurements were performed using a Bruker ER300 spectrometer with TM110 cavity operating at X-band (9.78 GHz). The spectral acquisitions were carried out using software developed in house. Unless mentioned otherwise, the EPR line-widths (LW) reported are peak-to-peak width of the first derivative spectra. The EPR line-width versus partial pressure of oxygen was recorded from X-band EPR measurements on LiPc equilibrated with oxygen/nitrogen gas mixture as reported previously 18.
2.3 Microsphere preparation – sonication procedure
An aqueous solution of bovine serum albumin (1.5 mL, 5% w/v) was placed in a glass vial (I.D. = 1.2 cm, H = 3.5 cm) to which was added PTM-TE (1 mL, 5 mM) dissolved in HMDS. The two solutions were immiscible and since the BSA solution is of a higher density compared to HMDS, the HMDS was in the upper layer. A titanium microtip (d = 2 mm) was then inserted into the center of the glass vial and positioned at the interface of the two immiscible solutions. Sonolysis was then conducted at a frequency of 20 kHz for various lengths of time and under various ultrasound intensities. It was found that a power setting of 20% on the generator that was supplied by Branson (digital sonifier 250) and a time of 60 s sonolysis with the sample in an ice bath to prevent the temperature from rising during sonolysis were the best conditions for producing PTM–TE/HMDS filled protein microspheres suspended in water. The microsphere suspension was of a relatively small size distribution (d = 0.5 to 3 μm) with a mean particle diameter of approximately 1.2 μm.
2.4 EPR linewidth time response to nitrogen exposure
A small amount of the microsphere suspension (20 μL) was encapsulated in a gas-permeable Teflon tube (i.d. = 0.8 mm; Zeus Industrial Products, Orangeburg, SC) and the tube was sealed at both ends as described previously 20,23. The sealed sample was inserted into a 3 mm quartz EPR tube with both ends open. 100% N2 gas (Praxair, Los Angeles, CA) was delivered into the EPR tube through gas- impermeable silicon tubing. The EPR tube was placed into the TM110 microwave cavity (X-band) in such a way that the sample was at the center of the active volume of the resonator. The flow rate of nitrogen gas was maintained at 2 L/min. The total pressure inside the EPR tube was maintained at 760 mmHg (atmospheric pressure), since the other end of the EPR tube was open to the atmosphere.
2.5 Particle size analysis
The particle size analyzer was from Malvern Instruments (model; Zetasizer, nano-s) with the capability to characterize particle sizes ranging from 0.6 nm to 10 μm. Following sonolysis, the particle suspensions were immediately transferred to a cuvette (Plastibrand, volume = 1.5 ml) and the particle-size distribution was determined.
2.6 Microscopy
Images of microspheres suspended in aqueous solution were performed using inverted light Nikon TE-2000U optical microscope. The aqueous microsphere suspension was injected into a drop of an aqueous mounting medium on a glass microscope slide. A cover slip was then placed on top of the drop and images were acquired with 630x magnification.
Transmission electron microscopy (TEM) images were acquired using a Philips CM12 microscope operating at 80 kV. Sonochemically prepared microspheres containing HMDS in their core were adsorbed to a standard Formvar-coated grid by applying a drop of the microsphere suspension to the grid. Following 3 min, the drop was carefully adsorbed onto a piece of filter paper. The grid was allowed to dry in room air and the images were then acquired.
For scanning electron microscopy (SEM) the microspheres were synthesized using olive oil instead of HMDS as the core. Olive oil was a very suitable solvent since it is of very low volatility and therefore the microspheres do not deform under the low pressures required to image using SEM.
2.7 Animals
Female C3H mice were obtained from the Frederick Cancer Research Center, Animal Production Facility (Frederick, MD, USA). The animals were housed five per cage in a climate- and light-controlled room. Food and water were allowed ad libitum. The animals were 50 days old and weighed about 25 g at the time of the experiment. The mice were anesthetized with ketamine (200 mg/kg b.w.) and xylazine (4 mg/kg b.w.) by intraperitoneal injection. All animals were used according to the Public Health Services Policy, the Federal Welfare Act, and ILACUC procedures and guidelines.
Radiation-induced fibrosarcoma-1 (RIF-1) (1×10⁶) cells were injected subcutaneously into the upper portion of the right hind limb of C3H mice and grown as a solid tumor. The size of the tumor was measured using a digital Vernier caliper. The tumor volume was determined from the orthogonal dimensions (d1, d2, d3) using the formula (d1*d2*d3)* π/6. All measurements were performed on tumors of a size 200–300 mm3.
2.8 Measurements of oxygen partial pressure in tissues
A 15–20 μL solution containing PTM-TE/HMDS encapsulated into proteinaceous microspheres that were suspended in PBS solution was injected intramuscularly (n=3) or intratumoraly (n=3) at a depth of about 2 mm using a 30 gauge needle while the mice were under ketamine/xylazine anesthesia. Tumor volume was about 200–300 mm3 on the day of the experiment. The oxygen concentration in the normal and tumor tissue was measured using an L-band (1.2 GHz) EPR spectrometer with a loop coil (Magnettech, Germany). The peak-to-peak linewidth of the EPR spectra of the probe in the tissue was used to determine pO2. The value of pO2 in the tissue was obtained from a standard curve of the EPR linewidth versus the oxygen concentration (for example, see Figure 3 in reference 20.
3. Results and Discussion
The ultrasound exposure conditions were examined in detail in order to derive at conditions that would be most efficient for encapsulating the largest volume of PTM-TE/HMDS solution into BSA microspheres. To do this, we studied the effect of sonolysis temperature, time, and power on the intensity and linewidth of the EPR spectrum of sonochemically encapsulated PTM-TE/HMDS in microspheres and compared this to that of a pure PTM-TE/HMDS solution, as shown in Table 1. It is clear that under all conditions of sonolysis, encapsulated PTM-TE/HMDS solutions remained sensitive to the oxygen concentration outside of the microspheres. The EPR linewidth of a pure PTM-TE/HMDS solution under aerobic conditions was 4.11 G. Under anoxic conditions (i.e., 100% nitrogen) the linewidth decreased to a value of 0.39 G. As can be seen in Table 1, the change in linewidth for PTM-TE/HMDS solutions encapsulated in BSA microspheres is similar to that of pure PTM-TE solutions.
Table 1.
Effect of the sonochemical† induced encapsulation of PTM-TE/HMDS solution (5 mM) into proteinaceous microspheres on the sensitivity of the EPR linewidth (LW) to air.
| Sonolysis
TC/t (s)/P (%) |
LW (G)
Air |
LW (G)
100% N2 |
ΔLW (G) | Intensity (a.u.) |
|---|---|---|---|---|
| PTM-TE* | 4.11 | 0.39 | 3.72 | 100 |
| 0/30/30 | 4.40 | 0.41 | 3.99 | 11.0 |
| 0/60/30 | 4.07 | 0.43 | 3.64 | 10.4 |
| 0/120/30 | 4.08 | 0.43 | 3.65 | 12.8 |
| 0/180/30 | 4.10 | 0.43 | 3.67 | 16.4 |
| 0/30/20 | 4.51 | 0.41 | 4.10 | 6.0 |
| 0/60/20 | 4.70 | 0.43 | 4.27 | 16.8 |
| 0/120/20 | 4.29 | 0.42 | 3.87 | 17.1 |
| 20/30/20 | 4.39 | 0.41 | 3.98 | 15.1 |
| 20/60/20 | 4.12 | 0.40 | 3.72 | 9.4 |
| 20/120/20 | 4.45 | 0.41 | 4.04 | 6.7 |
Conditions of sonolysis were; f = 20 kHz; pH = 7.1. The sonochemical power input from the generator is denoted as P (%). 0°C indicates that sonolysis was conducted with the sample in an ice bath.
A solution of PTM-TE in HMDS; i.e., not encapsulated.
Compared to the pure PTM-TE in HMDS solution (Table 1), the intensity of the EPR line following sonolysis and formation of microspheres was at best approximately 6 times lower then the EPR line intensity of a pure solution of PTM-TE (5 mM) in HMDS. This indicates that not all of the PTM-TE is encapsulated during sonolysis and secondly, there is a possibility that some PTM-TE is lost through the chemical effects of ultrasound. Nevertheless, given the intensity measurements shown in Table 1, it was concluded that a sonolysis time of 60 s in an ice bath and at an ultrasound power of 20% were an optimum set of conditions for producing BSA microspheres filled with PTM-TE/HMDS using our ultrasound exposure system.
Suslick and Grinstaff 26 have proposed that the mechanism for the sonochemical formation of microspheres made of BSA (filled with various organic liquids) involves the formation of a microemulsion of “oil” droplets in the aqueous phase stabilized by the protein molecules which are in turn oxidized by superoxide resulting in the cross-linking of the cysteine residues of the surrounding protein molecules. If this is the case, then the formation and stabilization of a microemulsion consisting of droplets of HMDS (with solubilized PTM-TE) in aqueous BSA solution, prior to the polymerization step, should depend on the pH of the BSA solution. Like any protein, BSA consists of both amine and carboxylic groups, the charge on which will be determined by the pH of the aqueous solution, which in turn will also influence the stability of the microemulsion 33.
The effect of pH of the aqueous BSA solution on the formation of HMDS-filled microspheres is shown in Figure 1a for a given set of ultrasound exposure conditions. Under the conditions of sonolysis in Figure 1 (i.e., t = 60 s, f = 20 kHz; P = 20%), microspheres formed at a pH of 5.5 and 9.1 were relatively large in size (mean particle diameter of 1.8 and 2.1 μm, respectively) compared those formed at either pH 4.3, 7.1 or 8.0. Sonolysis at a pH of 8.0 produced the most narrow size distribution of all pH conditions (size range from 0.5 to 2 μm; mean particle diameter = 1 μm). However, throughout the course of this study, it was decided to conduct all experiments at a pH of 7.1 since this is the natural pH of an aqueous BSA solution (5% w/v) and the resulting size distribution at pH = 7.1 ranged from 0.5 to 3 μm with a mean particle diameter of 1.2 μm, as shown in Figure 1a. An optical microscopic image of the HMDS-filled microspheres suspended in aqueous solution is shown in Figure 1b following sonolysis at pH 7.1. The image shows that the microspheres are spherical in shape when suspended in aqueous solution.
Figure 1.
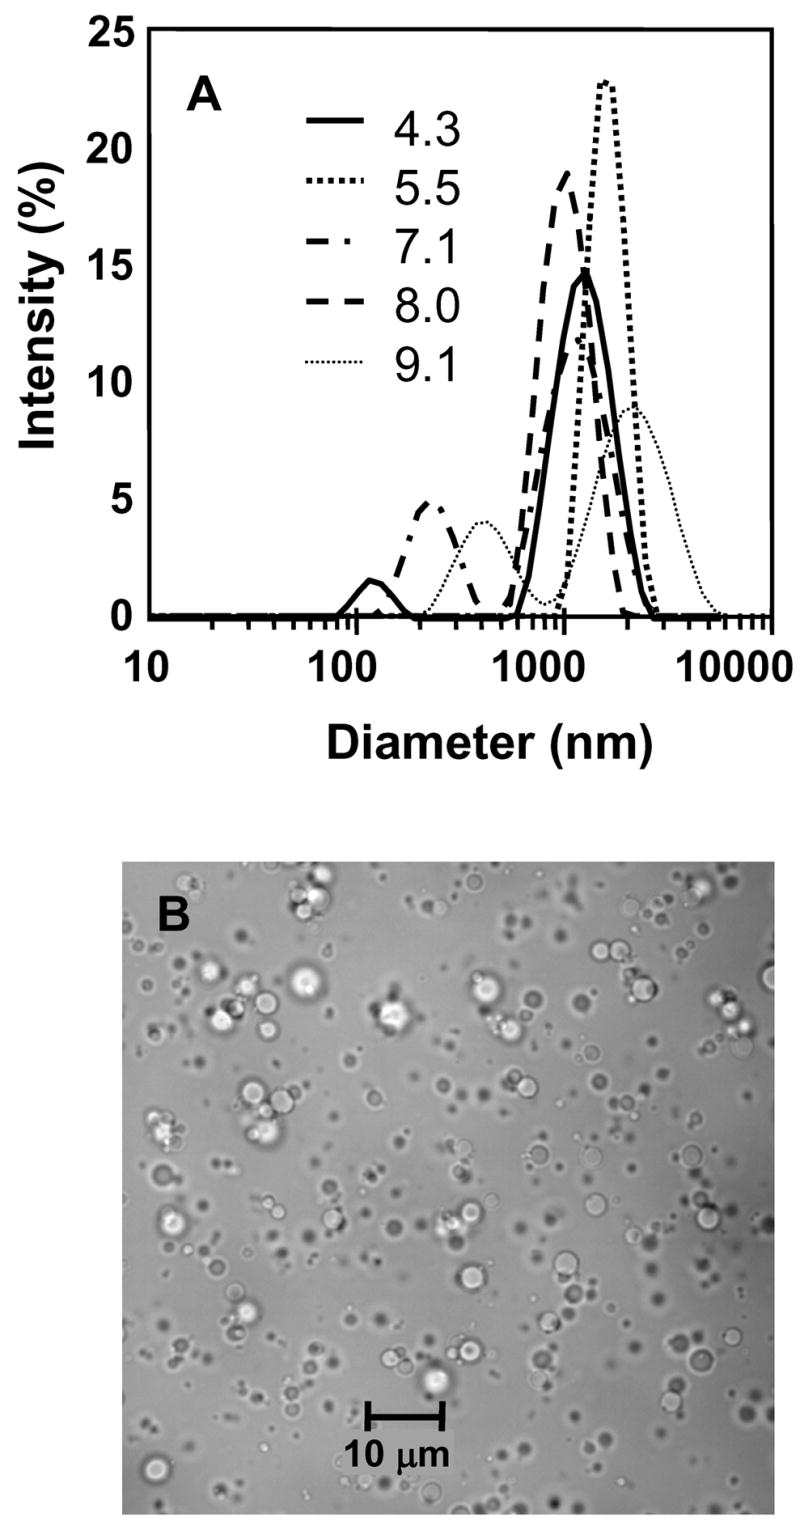
Proteinaceous microspheres formed following sonolysis of a suspension of aqueous BSA solution (5 % w/v, 1.5 ml) and HMDS (1 ml); (A) the effect of solution pH on size distribution and (B) optical microscopy of spheres suspended in water at pH = 7.1. Conditions of sonolysis were; t = 60 s; f = 20 kHz; P = 20%.
TEM and SEM images of the microspheres formed at pH = 7.1 are shown in Figure 2. Spherically shaped microspheres with a diameter of 2 μm or less can be observed in this particular TEM micrograph (Figure 2a). Furthermore, what appears to be a shell can be observed surrounding the microspheres, although it is not certain whether this is the polymerized shell or simply unpolymerized BSA protein adsorbed to the surface of the microspheres. The high resolution SEM micrograph of microspheres filled with HMDS (Figure 2b) shows that the outer surface of the microspheres is extremely rough in nature. However, we found that this surface roughness phenomenon was an artifact of the SEM procedure, which is conducted under a vacuum of 0.4 mmHg. At this pressure, since HMDS is a volatile solute, its evaporation from the microsphere core results in the rough surface structure observed. To test this hypothesis, we synthesized microspheres in the same way but used olive oil as the organic liquid. Olive oil has no volatility and as can be seen in Figure 2c, the true surface of the BSA microspheres appears relatively smooth. A similar effect was observed in an earlier study by Suslick et al. 26.
Figure 2.
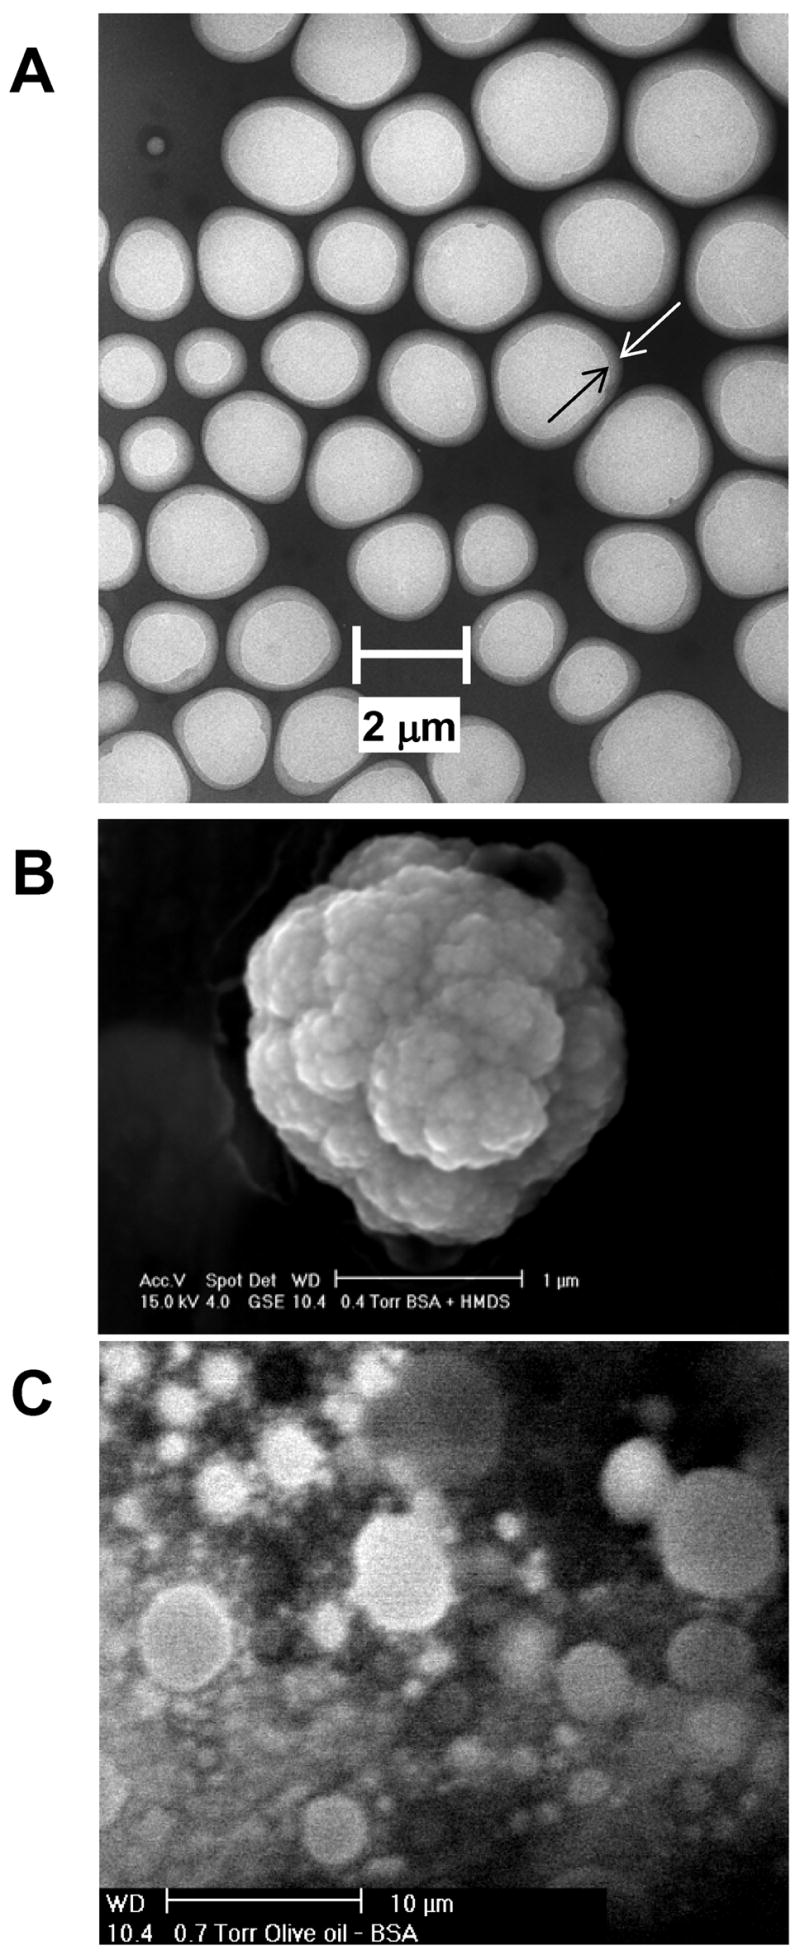
Microspheres formed following sonolysis of an aqueous solution of BSA (5 % w/v; 1.5 ml) and HMDS (1 ml). Conditions of sonolysis were; t = 60 s; f = 20 kHz; P = 20%; pH = 7.1. (A) Transmission electron microscopy image (× 6000 magnification); (B) scanning electron microscopy image (× 26000 magnification) and (C) scanning electron microscopic image of microspheres filled with olive oil, in place of HMDS (× 2200 magnification).
It was of importance to test the time-response of encapsulated PTM-TE/HMDS solutions to variations in environmental oxygen concentration, as shown in Figure 3. To do this, a solution of encapsulated PTM-TE/HMDS that was exposed to the atmosphere was flushed with 100% nitrogen gas. From the time point at which 100% nitrogen gas was introduced to the microspheres (i.e., the arrow in Figure 3), it took approximately 6 minutes for the EPR linewidth to decrease from that observed in air to that observed in the absence of oxygen. This time-response is similar to that observed previously for nitroxide-filled microspheres 28 and indicates that the microspheres formed in the current study are highly porous to oxygen.
Figure 3.
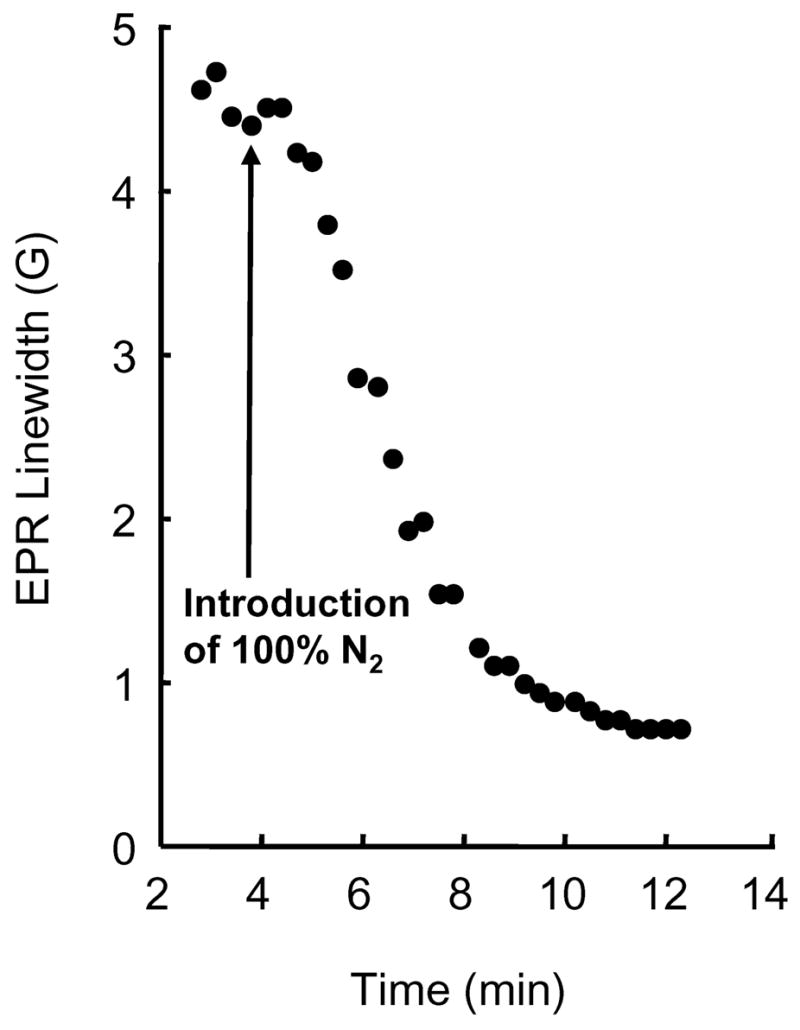
Time response for the change in EPR linewidth observed when air exposed PTM-TE/HMDS-filled BSA microspheres are flushed with 100% nitrogen. The arrow indicates the time point at which flushing with 100% nitrogen gas begins. Proteinaceous microspheres were formed following sonolysis of a suspension of aqueous BSA solution (5% w/v, 1.5 ml) and PTM-TE (5 mM in 1 ml HMDS). Conditions of sonolysis were; t = 60 s, f = 20 kHz; P = 20 %, pH = 7.1.
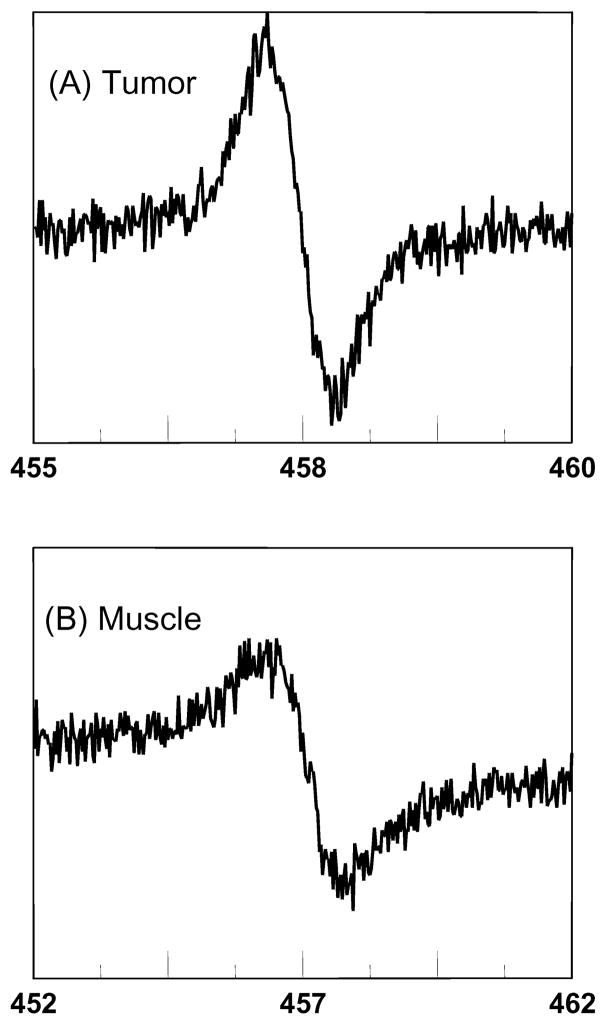
In order to examine the applicability of PTM-TE/HMDS encapsulated microspheres for EPR oximetry in vivo, we measured the EPR signal obtained following intramuscular (left hind limb) and intratumoral (RIF-1, right hind limb) injection of the microspheres into female C3H mice. The mice were 50 days old and weighed about 25 g at the time of the experiment. Following anesthetization with ketamine (200 mg/kg b.w.) and xylazine (4 mg/kg b.w.) by intraperitoneal injection, a 15–20 μL solution containing proteinaceous microspheres suspended in PBS solution was injected intramuscularly (n=3) or intratumorally (n=3) at a depth of about 2 mm using a 30 gauge needle. Figure 4 shows the EPR spectrum observed 20 minutes following injection of microspheres into the muscle and tumor tissue. The choice of 20 minutes was determined from an investigation of the change in linewidth of the EPR spectrum following injection into the tumor or muscle tissue, as shown in Figure 5. It is clear that immediately after injecting the microsphere preparation into either muscle or tumor tissue, there is an initial sharp decrease in the linewidth within the first 5 to 10 min. of injection, followed by an extremely stable linewidth up to a total of 120 minutes following injection. The initial drop in linewidth is due to the microspheres initially being exposed to air in the syringe, where the air exposed microspheres have a linewidth of over 4 G (see Table 1). The microspheres equilibrate with their surroundings in the tissue relatively quickly, as evidenced by the steady linewidth observed following the 5 to 10 min equilibration time.
Figure 4.
EPR spectra observed (A) 10 min after intratumoral and (b) 14 min after intramuscular injection of PTM-TE/HMDS filled microspheres into the (A) right and (B) left hind leg of a female C3H mouse; age = 50 days, weight ≈ 25 g, anesthetization with ketamine (200 mg/kg b.w.) and xylazine (4 mg/kg b.w.) by intraperitoneal injection. Proteinaceous microspheres; 15–20 μL solution in PBS. Conditions of sonolysis were; t = 60 s, f = 20 kHz; P = 20 %, pH = 7.1.
Figure 5.
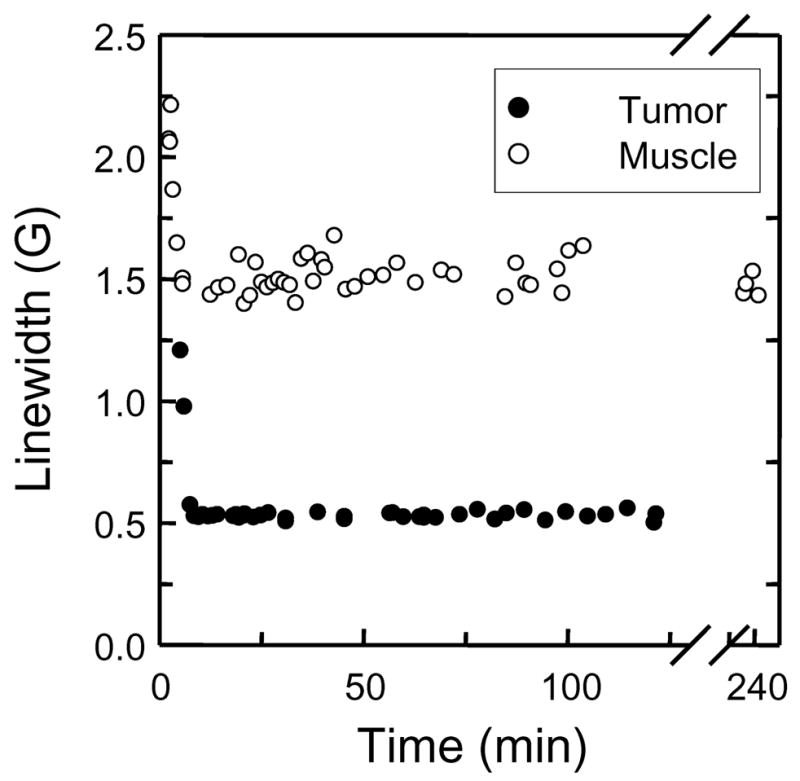
EPR linewidth from PTM-TE/HMDS filled microspheres following intramuscular and intratumoral injection of into the left and right hind leg of female C3H mice, respectively; age = 50 days, weight ≈ 25 g, anesthetization with ketamine (200 mg/kg b.w.) and xylazine (4 mg/kg b.w.) by intraperitoneal injection. Proteinaceous microspheres; 15–20 μL solution in PBS. Conditions of sonolysis were; t = 60 s, f = 20 kHz; P = 20 %, pH = 7.1.
The linewidths from the two EPR spectra shown in Figure 4 were 1.16 and 0.7 G for the muscle tissue and tumor, respectively. This indicates that the microsphere preparation is sensitive to oxygen. The average linewidth determined from three separate such injections into three different mice was used to determine the partial pressure of oxygen in the tumor and muscle tissue. The tumor was found to contain an average pO2 of 9 ± 6 mmHg (mean ± SD; n = 3) whereas the pO2 for the muscle tissue was determined to be 40 ± 8 mmHg (mean ± SD; n = 3). The pO2 measurement for muscle tissue in the current study is comparative to earlier studies 20 and, more importantly there is a clear difference between the muscle and tumor pO2.
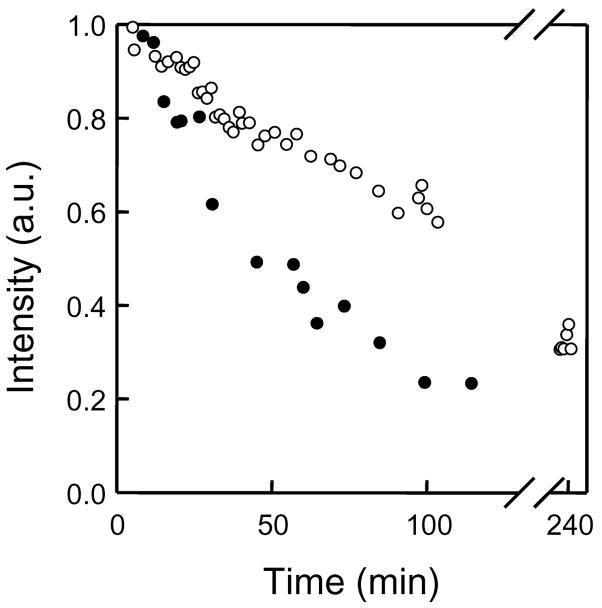
Finally, the loss of EPR signal intensity was also determined from the same injection experiments used in Figure 5, as shown in Figure 6. Note that the signal intensity (determined from double integration of the EPR line) is dependent on the concentration of PTM-TE, and not the partial pressure of oxygen; oxygen only affects the EPR line width. It is clear that following injection, the EPR intensity decreases more rapidly in the tumor tissue compared to the muscle tissue. It is known that a tumor readily consumes albumin from the blood serum 34. Therefore, it is possible that the faster decay of the EPR signal from tumor tissue could be due to faster destruction of the microspheres compared to normal tissue, resulting in the release and metabolism of PTM-TE by tumor cells.
Figure 6.
Decay of the EPR signal intensity following intramuscular and intratumoral injection of PTM-TE/HMDS filled microspheres into the left and right hind leg of female C3H mice, respectively; age = 50 days, weight ≈ 25 g, anesthetization with ketamine (200 mg/kg b.w.) and xylazine (4 mg/kg b.w.) by intraperitoneal injection. Proteinaceous microspheres; 15–20 μL solution in PBS. Conditions of sonolysis were; t = 60 s, f = 20 kHz; P = 20 %, pH = 7.1.
4. Conclusions
Sonolysis of a separated mixture of aqueous BSA solutions and PTM-TE dissolved in HMDS results in the formation of stable microspheres that can be used for EPR oximetry. The EPR spectrum of PTM-TE consists of a single, sharp line so this probe is more sensitive for oxygen detection compared to nitroxides, which exhibit a three line EPR spectrum due to splitting of the paramagnetic electron signal by the nitrogen atom. The PTM-TE/HMDS filled microspheres could be re-suspended in aqueous PBS solution at natural pH, and their potential use for the in vivo measurement of oxygen concentration in tissues was shown to be viable. Using a tumor mouse model, it was possible to determine a distinct difference between normal tissue (muscle) and tumor pO2.
Acknowledgments
The authors acknowledge the support of Kathleen S. Wolken of the OSU Campus Microscopy and Imaging Facility for the T.E.M. images and Cameron Begg of the OSU, Campus Electron Optics Facility for the SEM images. This work was supported by the National Institutes of Health grant EB004031
References
- 1.Suslick KS, Hammerton DA, Cline RE. J Am Chem Soc. 1986;108:564–642. [Google Scholar]
- 2.Henglein A. Ultrasonics. 1987;25:6–16. [Google Scholar]
- 3.Makino K, Mossoba MM, Riesz P. J Am Chem Soc. 1982;104:3537–3539. [Google Scholar]
- 4.Bielski BHJ, Cabelli DE, Arudi RL, Ross AB. J Phys Chem Ref Data. 1985;14:1041. [Google Scholar]
- 5.Gutierrez M, Henglein A, Fischer CH. Int J Radiat Biol. 1986;50:313–321. doi: 10.1080/09553008614550691. [DOI] [PubMed] [Google Scholar]
- 6.Henglein A, Gutierrez M. J Phys Chem. 1988;92:3705–3707. [Google Scholar]
- 7.Sostaric JZ. Department of Chemistry. The University of Melbourne; Melbourne, Australia: 1999. [Google Scholar]
- 8.Sostaric JZ, Riesz P. J Am Chem Soc. 2001;123:11010–11019. doi: 10.1021/ja010857b. [DOI] [PubMed] [Google Scholar]
- 9.Sostaric JZ, Riesz P. J Phys Chem B. 2002;106:12537–12548. [Google Scholar]
- 10.Miyoshi N, Sostaric JZ, Riesz P. Free Radic Biol Med. 2003;34:710–719. doi: 10.1016/s0891-5849(02)01428-4. [DOI] [PubMed] [Google Scholar]
- 11.Rosenthal I, Sostaric JZ, Riesz P. Ultrason Sonochem. 2004;11:349–363. doi: 10.1016/j.ultsonch.2004.03.004. [DOI] [PubMed] [Google Scholar]
- 12.Sostaric JZ, Miyoshi N, Riesz P, DeGraff WG, Mitchell JB. Free Radic Biol Med. 2005;39:1539–1548. doi: 10.1016/j.freeradbiomed.2005.07.020. [DOI] [PubMed] [Google Scholar]
- 13.Ilangovan G, Li HQ, Zweier JL, Kuppusamy P. J Phys Chem B. 2001;105:5323–5330. [Google Scholar]
- 14.Afeworki M, Miller NR, Devasahayam N, Cook J, Mitchell JB, Subramanian S, Krishna MC. Free Radic Biol Med. 1998;25:72–78. doi: 10.1016/s0891-5849(98)00039-2. [DOI] [PubMed] [Google Scholar]
- 15.Turek P, Petit P, Andre JJ, Simon J, Even R, Boudjema B, Guillaud G, Maitrot M. J Am Chem Soc. 1987;109:5119–5122. [Google Scholar]
- 16.Ilangovan G, Zweier JL, Kuppusamy P. J Phys Chem B. 2000;104:9404–9410. [Google Scholar]
- 17.Ilangovan G, Zweier JL, Kuppusamy PJ. Phys Chem B. 2000;104:4047–4059. [Google Scholar]
- 18.Ilangovan G, Manivannan A, Li HQ, Yanagi H, Zweier JL, Kuppusamy P. Free Radic Biol Med. 2002;32:139–147. doi: 10.1016/s0891-5849(01)00784-5. [DOI] [PubMed] [Google Scholar]
- 19.Manivannan A, Yanagi H, Ilangovan G, Kuppusamy PJ. Magn Magn Mater. 2001;233:L131–L135. [Google Scholar]
- 20.Pandian RP, Parinandi NL, Ilangovan G, Zweier JL, Kuppusamy P. Free Radic Biol Med. 2003;35:1138–1148. doi: 10.1016/s0891-5849(03)00496-9. [DOI] [PubMed] [Google Scholar]
- 21.Pandian RP, Kutala VK, Parinandi NL, Zweier JL, Kuppusamy P. Arch Biochem Biophys. 2003;420:169–175. doi: 10.1016/j.abb.2003.09.008. [DOI] [PubMed] [Google Scholar]
- 22.Pandian RP, Dang V, Manoharan PT, Zweier JL, Kuppusamy P. J Magn Reson. 2006;181:154–161. doi: 10.1016/j.jmr.2006.04.004. [DOI] [PubMed] [Google Scholar]
- 23.Pandian RP, Kim YI, Woodward PM, Zweier JL, Manoharan PT, Kuppusamy P. J Mater Chem. 2006;16:3609–3618. [Google Scholar]
- 24.Turek P, Andre JJ, Giraudeau A, Simon J Chem Phys Lett. 1987;134:471–476. [Google Scholar]
- 25.Sostaric JZ, Pandian RP, Weavers LK, Kuppusamy P. Chem Mat. 2006;18:4183–4189. [Google Scholar]
- 26.Suslick KS, Grinstaff MW. J Am Chem Soc. 1990;112:7807–7809. [Google Scholar]
- 27.Grinstaff MW, Suslick KS. Proc Natl Acad Sci U S A. 1991;88:7708–7710. doi: 10.1073/pnas.88.17.7708. [DOI] [PMC free article] [PubMed] [Google Scholar]
- 28.Liu KJ, Grinstaff MW, Jiang JJ, Suslick KS, Swartz HM, Wang W. Biophys J. 1994;67:896–901. doi: 10.1016/S0006-3495(94)80551-X. [DOI] [PMC free article] [PubMed] [Google Scholar]
- 29.Eckburg JJ, Chato JC, Liu KJ, Grinstaff MW, Swartz HM, Suslick KS, Auteri FP. Journal of Biomechanical Engineering-Transactions of the Asme. 1996;118:193–200. doi: 10.1115/1.2795959. [DOI] [PubMed] [Google Scholar]
- 30.Toublan FJJ, Boppart S, Suslick KS. J Am Chem Soc. 2006;128:3472–3473. doi: 10.1021/ja0544455. [DOI] [PubMed] [Google Scholar]
- 31.Swartz HM, Glockner JF. Measurements of oxygen by EPRI and EPRS. CRC press, Inc; Boca Raton, FL: 1991. [Google Scholar]
- 32.Ballester M, Riera J, Castaner J, Rovira C, Armet O. Synthesis. 1986:64–66. [Google Scholar]
- 33.Hunter RJ. Foundations of colloid science. Vol. 1 Clarendon Press; Oxford: 1995. [Google Scholar]
- 34.Stehle G, Sinn H, Wunder A, Schrenk HH, Stewart JC, Hartung G, Maier-Borst W, Heene DL. Crit Rev Oncol Hematol. 1997;26:77–100. doi: 10.1016/s1040-8428(97)00015-2. [DOI] [PubMed] [Google Scholar]


