

Abstract
Stable DNA triple helical structures are normally restricted to homopurine sequences. We have described a system of four heterocyclic bases (TRIPsides) that when incorporated into oligomers (oligoTRIPs) can recognize and bind in the major groove to any native sequence of DNA [Li et al., J. Am. Chem. Soc. 2003]. To date, we have reported on triple forming oligomers composed of two of these TRIPsides, i.e., antiTA and antiGC, and their ability to form intramolecular triplexes at mixed purine/pyrimidine sequences. In the present study, we describe the synthesis and characterization of the antiCG TRIPside and its use in conjunction with antiTA and antiGC to form sequence specific intra- and/or inter-molecular triplex structures at mixed purine/pyrimidine sequences that require as many as four major groove crossovers.
Introduction
The formation of triple helical DNA structures represents, from a conceptual standpoint, a relatively straightforward approach to sequence specifically target native DNA for a variety purposes, including the treatment and diagnosis of diseases.1–5 If the duplex target is > 17 nucleotides long, formation of the triplex can be gene specific.6 There are numerous successful in vitro and in vivo examples of triplex formation at homopurine targets in double-strand DNA.7–15 However, triplex forming oligomers (TFO) in the Pyrimidine- or Purine-motifs stringently require homopurine targets.3,4 This is because the TFO cannot traverse back and forth across the major groove as it would need to in order to simultaneously read purine Hoogsteen H-bond information on complementary strands. In addition, simultaneous recognition of purines on complementary strands would require that the TFO, which binds either parallel (Pyrimidine-motif)7 or anti-parallel (Purine-motif)16–18 to the purine containing strand, would have to continually switch its polarity relative to the duplex. The restriction for purine stretches has been a major barrier to the exploitation of TFO’s.4
We have previously described a strategy to overcome the limitation for homopurine sequences using four heterocyclic-based C-glycosides (TRIPsides) that when incorporated into oligomers (oligoTRIPs) can distinguish between the four potential Hoogsteen H-bonding patterns in native DNA at G:C, C:G A:T and T:A (Scheme 1).19 Because the oligoTRIPs recognize hetero-purine/pyrimidine sequences in double-strand DNA (even though only the purine base is read), we have arbitrarily defined the orientation of the oligoTRIPs relative to double-strand DNA using the following convention: right-handed DNA is viewed into the major groove with the strand on the viewer’s left running 5′ to 3′ going from top to bottom. Using this nomenclature the complementary oligoTRIP strand runs anti-parallel, i.e., 3′→5′, against the left strand of the duplex that runs 5′→3′. Because the oligoTRIPs target duplex DNA, there are two unique oligoTRIPs that can bind to any sequence based upon the orientation (Scheme 2).
Scheme 1.

Structures of the TRIPsides associated with their respective duplex targets.19
Scheme 2.
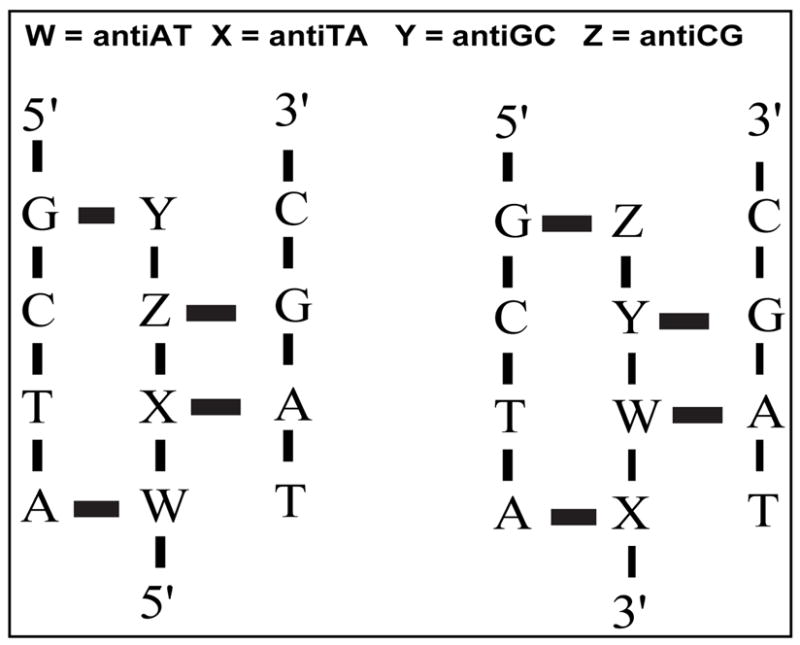
Nomenclature used to describe how oligoTRIPs associate with duplex DNA: two unique TFO’s recognize the same sequence in opposite orientation: W, antiAT; X, antiTA; Y, antiGC; Z, antiCG.
We have shown that oligomers composed of antiGC and antiTA subunits can form stable intramolecular triplexes at mixed purine/pyrimidine sequences and with high specificity according to the proposed recognition scheme.19,20 We describe herein the synthesis of antiCG, the third TRIPside, its incorporation into oligomers and the sequence specific formation of intra- and intermolecular triplexes at mixed purine/pyrimidine sequences at physiological pH using a combination of experimental approaches. It is demonstrated that an oligoTRIP can sequence selectively bind to a 19 bp duplex target that requires four major groove crossovers to read the purine Hoogsteen H-bond information.
Materials and Methods
General
All 1H-NMR were recorded on a Varian 500 MHz instrument. Mass spectral analyses were performed at the Midwest Center for Mass Spectroscopy at the University of Nebraska-Lincoln (Lincoln, NE) or at the Washington University Mass Spectroscopy Source (St. Louis, MO). All reagents were of the highest purity and used as purchased unless specified otherwise.
Syntheses
The syntheses of antiTA and antiGC, and their incorporation into oligomers have been previously described.19,20 Oligomers where purified by reverse phase HPLC and the composition confirmed by MALDI-TOF MS.
5-Chlorocarbostyril (3)
A mixture of 2,4,4-trimethyl-2-oxazoline (22.6 g, 0.2 mol), 1,3- dichlorobenzaldehyde (35 g, 0.2 mol) and 2 g of KHSO4 in 100 mL of N-methylpyrrolidinone and 60 mL of xylene was stirred in a 500 mL of flask. The flask was equipped with a 4 mL of Dean-Stark trap, which was pre-loaded with 4 mL of 2,4,4-trimethyl-2-oxazoline. The reaction was heated at 180–240 °C with continuous release of the distillate from the Dean-Stark trap. Approximately 130 mL of distillate was drained during 2.5 h. The reaction was cooled down and then 300 mL of water was added. After stirring for 5 min, the water was decanted off and 85 mL of CH2C12 added. The mixture was refluxed for 30 min, allowed to cool, and filtered. The collected light yellow needles were washed with 20 mL of CH2C12, and recrystallized from MeOH to give white needles (16.11 g, 45% yield), m.p. 288–289 °C (lit.21 m.p. 289–291 °C), 1H NMR (DMSO-d6): δ 6.69 (d, 1 H, J = 15), 7.29 (m, 2 H), 7.48 (t, 1 H, J = 12.5), 8.84 (d, 1 H, J = 15); HRMS (FAB) m/z 179.01336 (M+), 179.01379 (calcd).
2,5-Dichloroquinoline (4)
3 (1.8 g, 0.01 mol) was refluxed in 20 mL of POCl3 for 3.5 h and then the solution concentrated in vacuo. To the residue was added 30 mL of Et2O, followed by the careful addition of 100 mL of saturated NaHCO3. The organic layer was separated, dried over Na2SO4, and the solvent removed. The residue was recrystallized from hexanes to give white needles (1.79 g, 91% yield), m.p. 76–77 °C (lit.21 m.p. 78–78.5 °C), 1H NMR (CDC13): δ 7.49 (d, 1 H, J = 15.2), 7.65 (m, 2H), 7.96 (d, 1 H, J = 11.5), 8.53 (d, 1 H, J = 15.2); HRMS (FAB) m/z 197.98801 (MH+), 196.97990 (calcd).
2-Amino-5-chloroquinoline (5)
A mixture of 2,5-dichloroquinoline (1.97 g, 0.01 mol), K2CO3 (6.9 g, 0.05 mol) and acetamide (12.0 g, 0.20 mol) was heated at 200 °C with stirring for 1.5 hours. The reaction was cooled and 300 mL of water added. The solid that formed was collected and recrystallized from CH2C12 and Et2O to give white needles (1.28 g, 72% yield), m.p. 164–166 °C (lit.22 m.p. 176–178 °C), 1H NMR (CDC13): δ 4.80 (s, 2 H, NH2), 6.80 (d, 1 H, J = 8.2), 7.31 (d, 1 H, J = 6.9), 7.48 (t, 1 H, J = 6.9), 7.59 (d, 1 H, J = 6.9), 8.30 (d, 1 H, J = 8.2); HRMS (FAB) m/z 179.03728 (MH+), 178.02978 (calcd).
(2′-R)-cis-5-[2′,5′-Dihydro-4′-(tert-butyldiphenylsilyl)oxy-2′-furanyl]-2-aminoquinoline (6)
5 (1.78 g, 0.01 mol) and 1,4-anhydro-2-deoxy-3-O-(tert-butyldiphenylsilyl)-D-erythro-pent-1-enitol23 (3.89 g, 0.011 mol) were dissolved in dioxane (200 mL) under N2. Then a catalytic amount of bis(dibenzylideneacetone)Pd(0) (0.6 g) and tri-(tert-butyl)phosphine (0.6 mL) were added to the reaction. After the reaction has been purged with N2 for 5 min, dicyclohexylmethylamine (0.4 mL) was added. The final mixture was then refluxed for 5 days under N2. The reaction was cooled, filtered and the filtrate concentrated under reduced pressure. The residue was subjected to flash chromatography (EtOAc to EtOAc/MeOH 50:1) to furnish a yellow foam as the final product (3.0 g, 61% yield): 1H NMR (CDC13): δ 1.10 (s, 9H), 3.78 (dd, 2 H, J = 7.2, 15.0, C5′H, C5″H), 4.45 (bs, 1 H, C4′H), 4.83 (bs, 3 H, C5′OH and NH2 overlapped), 6.20 (bs, 1 H, C2′H), 6.58 (d, J = 14.8, 1 H), 6.69 (d, J = 13.5, 1 H, C1′H), 7.25 (t, J = 12.6, 1 H), 7.43–7.54 (m, 8 H), 7.77–7.90 (m, 4 H), 8.24 (d, J = 14.8, 1 H); HRMS (FAB) m/z 497.22402 (MH+), 496.21822 (calcd).
5-(β-D-Glyceropentofuran-3′-ulos-1′-yl)-2-aminoquinoline (7)
Tetrabutylammonium fluoride (6 mL, 1 M in THF) and 0.1 mL of HOAc were added to a cooled solution of 6 (2.48 g, 5 mmol) in 10 mL of THF, and the reaction stirred at 0 °C for 30 min. The reaction solution was concentrated in vacuo and the residue obtained was applied to a silica gel column using CH2Cl2/MeOH/Et3N (100:0:1 to 100: 17:1) to give the desired desilylated (ketone) nucleoside, which was recrystallized from CH2Cl2/iPrOH as an off-white solid (1.24 g, 96% yield), m.p. 164– 166 °C, 1H NMR (CDCl3): δ 2.72 (dd, 1 H, J = 14.0, 11.5, C2′-H), 2.95 (dd, 1 H, J = 14.0, 11.5, C2″-H), 3.98 (bs, 2 H, C5′-H, C5″-H), 4.13 (t, J - 3.5, 1 H, C4′-H), 4.89 (bs, 2 H, NH2), 5.74 (dd, J = 11.5, 4.5, 1 H, C1′-H), 6.78 (d, J = 9.5, 1 H), 7.45 (d, J = 9.0, 1 H), 7.56 (t, J = 9.0, 1 H), 7.66 (d, J = 9.0, 1 H), 8.23 (c, J = 9.5, 1 H); HRMS (FAB): m/z 259.1074 (MH+), 258.10044 (calcd).
5-(2′-Deoxy-β-D-threo-pentofuranosyl)-2-aminoquinoline (8)
7 (1.29 g) was dissolved in 120 mL of AcOH:CH3CN (1:1) and stirred under N2 at −23 °C. Then NaHB(OAc)3 (1.5 g) was added to the cooled solution and the mixture stirred for 75 min. The reaction was concentrated and the product obtained by silica gel chromatograph with CH2Cl2/MeOH/Et3N (100:0:1 to 100: 35:1). The product was recrystallized from CH2Cl2/iPrOH as a white powder (1.11 g, 85% yield), m.p. 74–78 °C, 1H NMR (DMSO-d6/CDCl3): δ 2.03 (m, 1 H, C2′-H), 2.38 (m, 1 H, C2″-H), 3.76 (m, 2 H, C5′-H, C5″-H), 4.07 (m, 1 H, C4″-H), 4.38 (m, 1 H, C3′-H), 564 (bs, 2 H, NH2), 5.68 (dd, J = 10.0, 4.5, 1 H, C1′-H), 6.82 (d, J = 9.5, 1 H), 7.45–7.50 (m, 3 H), 8.17 (d, J = 9.5, 1 H); HRMS (FAB): m/z 261.12300 (MH+), 260.11609 (calcd).
N2-Isobutyryl-5-[2′-deoxy-β-D-threo-pentofuranosyl]-2-aminoquinoline (9)
8 (1.30 g, 5 mmol) was dissolved in dry pyridine (80 mL) and cooled in an ice bath under N2. Then TMS-Cl (6 mL) was added and the reaction stirred at 0 °C for 30 min at which time isobutyric anhydride (3.75 mL) was added. The reaction was stirred for 2 h at room temperature under N2. The reaction was cooled in an ice bath and cold water (16 mL) added. The reaction mixture was stirred for another 15 min, then conc. NH4OH (16 mL) was added to give a solution approximately 2 M in ammonia. The final mixture was stirred for another 30 minutes in ice bath then concentrated in vacuo to afford an oil, which was chromatographed on silica gel with CH2Cl2/MeOH/Et3N (100:0:1 to 100:9:1). The product obtained was recrystallized from CH2Cl2/Et2O as a white powder (1.40 g, 85% yield), m.p. 102–104 °C, 1H NMR (DMSO-d6): δ 1.12 (d, J = 7.0, 6 H), 1.84–1.90 (m, 1 H, C2′H), 2.26–2.32 (m, 1 H, C2″H, 2.78–2.86 (m, 1 H), 3.46–3.60 (m, 2 H, C5′H, C5″H), 3.89 (m, 1 H, C4′H), 4.23 (bs, 1 H, C3′H), 4.82 (t, J = 2.5, 1 H, C5′OH), 5.14 (d, J = 4.0, 1 H, C3′OH), 5.66 (dd, J = 10.0, 4.5, 1 H, C1′H), 7.60–7.70 (m, 3 H), 8.30 (d, J = 9.5, 1 H), 8.50 (d, J = 9.5, 1 H) 10.73 (s, 1 H); HRMS (FAB): m/z 331.16541 (MH+), 330.15796 (calcd).
N2-Isobutyryl-5-[2′-deoxy-,-D-threo-pentofuranosyl-5′-O-(4,4′-dimethoxytrityl)]-2-aminoquinoline (10)
9 (0.66 g, 2 mmol) was dissolved in dried pyridine (30 mL) under N2. Then 4,4′-dimethoxytrityl chloride (DMTr-Cl) (0.70 g) and Et3N (1 mL) were added to the solution at room temperature. An additional aliquot of DMTr-Cl and Et3N were added after 3 h. The reaction was stirred under N2 at room temperature for a total of 4 h. Then the reaction was concentrated, the residue dissolved in CHCl3 (30 mL), washed three times with saturated NaHCO3 solution (30 mL), and then three times with water (30 mL). The solution was concentrated and the residue chromatographed on silica gel with CH2Cl2/MeOH/Et3N (100:0:1 to 100:5:1). The product was recrystallized from Et2O/hexanes as a white powder (0.92 g, 73% yield), m.p. 61–63 °C, 1H NMR (CDC13): δ 1.12 (d, J = 7.0, 6 H), 2.12–2.18 (m, 1H, C2′H), 2.42–2.49 (m, 1 H, C2″H), 2.58–2.67 (m, 1 H), 3.36–3.46 (m, 2 H, C5′H, C5″H, C5″H), 3.78 (s, 6 H), 4.14 (m, 1 H, C4′H), 4.48 (bs, 1 H, C3′H), 5.80 (dd, J = 10.0, 4.5, 1 H, C1′H), 6.82–6.90 (m, 3 H), 7.20–7.64 (m, 15 H), 8.44 (s, 1 H); HRMS (FAB): m/z 633.29435 (MH+), 632.28864 (calcd).
N2-Isobutyryl-5-[2′-deoxy-β-D-threo-pentofuranosyl-3′-O-(2-cyanoethoxy)(diisopropylamino)phosphino-5′-O-(4,4′-dimethoxytrityl)]-2-aminoquinoline (11)
10 (0.316 g, 0.5 mmol) was dissolved in dry CH2C12 (10 mL) under N2 and cooled in an ice bath. Hunig base (0.8 mL) was added followed by 2-cyanoethyl-N,N-diisopropylphosphoramidite (0.76 mL). The reaction was stirred at 0 °C for 10 min then continued to stir at room temperature for 75 min. The final reaction was concentrated, the residue dissolved in CHCl3 (30 mL), washed three times with saturated NaHCO3 solution (30 mL) and three times with water (30 mL). The volatiles were removed, and the residue chromatographed on silica gel with CH2Cl2/hexane/Et2O/Et3N (100:200:300:6). The final product is a pale yellow powder (0.37 g, 88% yield), 1H NMR (CDCl3): δ 1.09–1.32 (m, 14 H), 1.54 (d, J = 7.0, 6 H), 2.1–2.18 (m, 1 H, C2′-H), 2.46–2.68 (m, 3 H, C2″-H), 3.38–3.46 (m, 2 H, C5′-H, C5″-H), 3.58–3.62 (m, 1 H), 3.78 (bs, 6 H), 4.26 (bs, 1 H, C4′-H), 4.60 (bs, 1 H, C3′-H), 5.76 (m, 1 H, C1′-H), 6.78–6.86 (m, 3 H), 7.24–7.80 (m, 15H), 8.08 (s, 1 H); HRMS (FAB): m/z 833.40221 (MH+), 832.39650 (calcd).
Determination of the pKa value of antiCG nucleoside (8)
An aqueous 1.22 mM solution of antiCG nucleoside was prepared as a standard solution. NaOAc buffer at different pH values (pH = 4.27, 5.26, 5.66, 6.02, 6.63, 7.72, 7.25, 7.44, 7.59, 8.17, 9.38, 9.54) were prepared by adjusting the pH value with HOAc or NaOH. 1 mL of the antiCG nucleoside standard solution was diluted with buffer solution to 25 mL, and the pH value of the final solution measured again to verify that the pH value did not change. Then the UV-visible spectrum of the diluted solutions were recorded from 200–400 nm. The UV-visible spectra from all the ten buffer solutions were plotted and analyzed. The pKa value of the antiCG nucleoside was determined to be 7.2. At pH 7, room temperature, the extinction coefficient is 4626 and 2956 at 330 and 350 nm, respectively.
NMR conformational studies
The conformational analysis of the antiCG (8) TRIPside was determined by 1H NMR on a Varian INOVA 500-MHz Spectrometer using NOESY with presaturation field strength γB1 of 50 Hz and a mixing time of 0.4 sec at 25 °C in 10 mM sodium phosphate buffer (pH 7.0) in D2O containing 50 mM NaCl. The sample concentration was 18.4 mM, and the relaxation delay for the NOESY experiment was 2.2 sec.
Oligonucleotide synthesis and purification
The synthesis of the oligomers were performed on a 200 nmol scale using standard solid phase phosphoramidite chemistry on an ABI 394 instrument. The oligoTRIP was cleaved from the column and deprotected with 1 mL of conc. NH4OH, placed in a sealed bottle and maintained at 55 °C for 8 h. The 5-DMTr-oligoTRIPs were purified by HPLC: flow rate, 4 mL/min; solvent, 0.1 M TEAA (pH 7.0)/CH3CN (9:1) for 10 min, to 0.1 M TEAA (pH 7.0)/CH3CN (3:2) over 15 min, and then to 100% CH3CN over 5 min. The HPLC fractions containing the oligomer were combined, lyophilized and the residue detritylated with 80% HOAc solution (30 μL per OD) at room temperature for 20 min. The final product was purified on a Sephadex G-25M column and the products analyzed by MALDI-MS.
UV-visible melting curves
Absorbance vs. temperature profiles were measured simultaneously at 250 nm and 330 nm with a thermoelectrically controlled AVIV 14 UV/Vis spectrophotometer (Lakewood, NJ). The absorbance was monitored in the temperature range of 0–110 °C, by increasing the temperature at a rate of ~0.4 °C/min. In these experiments, the 330 nm wavelength is used to monitor the absorbance changes of the C-glycoside bases of the oligoTRIPs, while the 250 nm follows the changes of the nucleobases of the Watson-Crick duplex. Shape analysis of the resulting melting curves, using procedures described earlier, yielded transition temperatures, TM, and model-dependent van’t Hoff enthalpies, δHvH.24
Methylation protection
An individual strand was 5′-end-labeled25 and purified by PAGE. The purified 5′-[32P]oligomers were heated to 95 °C for 3 min in 10 mM sodium phosphate buffer (pH 7.0) containing 1 M NaCl, and then slowly cooled to room temperature. The oligoTRIP (0–3 equivalents) was added and the incubation maintained at 10 °C overnight. The solution was cooled to 8 °C and the G, G+A and C sequencing lanes run as previously described.25–27 The dimethyl sulfate (DMS) methylation reactions involved treatment of the [32P]DNA (in the absence or presence of the oligoTRIP) with 1 μL of DMS in a total volume of 200 μL of buffer (10 mM sodium phosphate buffer, pH 7.0 containing 1 M NaCl) for 10 min at 8 °C. The reaction was stopped and the DNA precipitated by the addition of 1.5 M NaOAc (pH 7.0), 0.1 mM EDTA and 25 μg/mL of tRNA and 750 μL 100% EtOH. The resulting DNA pellet was washed with 75% EtOH and then 100 μL of 10% piperidine was added and the solution heated for 3 min at 90 °C. The solution was lyophilized to dryness, and then 30 μL of water added and the solution lyophilized to dryness. This was repeated one more time to remove all of the piperidine. Loading buffer (12 μL), containing 80% (v/v) formamide, 50 mM TRIS-borate (pH 8.3), 1 mM EDTA, 1% (w/v) xylene cyanol and 1% bromphenol blue, was added to the DNA pellet. A 1 μL aliquot was removed for scintillation counting and the remaining 11 μL were denatured at 90 °C for 3 min and chilled in ice. The appropriate volume of solution was added to each lane of a 20% denaturing polyacrylamide gel (7.7 M urea)), which was typically run at 50 W for 2.5 h. After drying, the gel was visualized and the bands quantified on a phosphorimager by determining the radioactivity associated with each individual G-band relative and the total amount of radioactivity in the lane.
Differential Scanning Calorimetry (DSC)
Heat capacity functions of the helix-coil transition of the DNA complexes, triplex and duplex, were measured with a Microcal VP-DSC (Northampton, MA) differential scanning calorimeter. The instrument consists basically of two 0.5 mL cells that are filled with appropriate solutions that are heated from 0 to 100 °C at a rate of 0.75 °C/min, under nearly adiabatic conditions. Two types of scans are executed: in the first type, the sample cell is filled with a ~50 μM DNA solution (in duplex or duplex + oligoTRIP) and scanned against the reference cell filled with buffer solution, while in the second type both cells are filled with the same buffer solution, this scan is used as the natural baseline of the instrument. Both scans are normalized by the heating rate, and the buffer vs buffer scan is subtracted from the sample vs. buffer scan; the resulting curve is then normalized by the concentration of the DNA complex. The resulting thermographs yield the TM and standard thermodynamic unfolding profiles:ΔHcal, ΔScal and ΔG°(T), for the unfolding of each complex. Thermodynamic profiles are determined by the following relationships assuming a ΔCp = 0 between the initial and final states: ΔHcal = +∫ΔCpadT and ΔScal =∫(ΔCpa/T)dT, where ΔCpa represents the anomalous heat capacity during the unfolding process.24 The free energy at any temperature, ΔG°(T), is obtained with the Gibbs equation: ΔG°(T)= ΔHcal − TScal.
Results and Discussion
Synthesis and Characterization of antiCG TRIPside (8)
The synthesis of antiCG using a Heck-type coupling of 2-amino-5-chloroquinoline to the suitably protected glycal follows a scheme similar to that previously described for antiTA and antiGC.19,20 The incorporation of the antiCG TRIPside into oligomers followed standard solid phase synthesis. The preference of the antiCG heterocycle for the anti-conformation with respect to the glycoside bond was demonstrated by NOE 1H-NMR experiments. The anti-rotomers have been previously observed for antiTA and antiGC.20 The pKa of antiCG was determined by measuring changes in its UV absorbance at 241 and 330 nm as a function of pH (data not shown). The pKa of antiCG was calculated to be 7.2 using either wavelength. This value is the same as reported for antiGC20 and close to that reported for 2-aminoquinoline.28
Analysis of Triplex Formation
The quinoline and quinazoline TRIPside heterocycles have λmax close to 330 (antiCG and antiGC) and 350 nm (antiTA) so their unstacking from a triplex structure can be conveniently followed at these wavelengths where the natural nucleobases do not absorb. It should be noted that there is spectral overlap between the quinazoline and quinoline chromophores making it impossible to spectroscopically isolate stacking changes at antiGC and antiCG from those at antiTA. The TRIPsides are intrinsically fluorescent and an increase in fluorescent intensities, as well as a decrease in quenching as a function of temperature, has been observed when the oligoTRIPs are stacked in a triplex.19,20,29,30 Finally, the presence of the oligoTRIP in the major groove can be probed using dimethyl sulfate (DMS) that methylates DNA in the major groove at N7-G, a position that is sterically blocked if a TFO is present.31,32
Intramolecular Formation of Triplex with antiCG
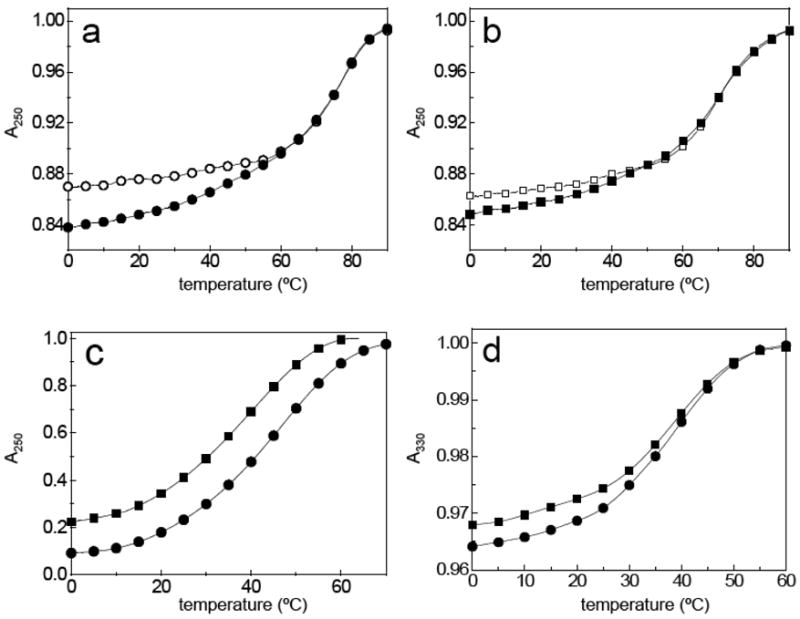
OT-1, which is predicted to form a stable triplex (Scheme 4), exhibits a temperature-dependent hyperchromicity at 250 nm (Figure 1a) and 330 nm (Figure 1b) with a TM of approximately 86 °C at both wavelengths. The hyperchromicity at 330 nm is 15%. The data are consistent with a two-phase transition involving the triplex structure melting in one transition to a random coil. This is what has been observed for other oligoTRIPs composed of antiTA and/or antiGC,19,20 and for natural intramolecular triplexes.33 Three phase melts are observed only if there is a mismatch between the oligoTRIP and the duplex,19,20 or if the duplex segment is selectively stabilized, as is the case if netropsin is added.19,33,34
Scheme 4.

Potential intramolecular structures for OT’s 1–5.
Figure 1.

UV-visible melting curves for intramolecular triplexes OT’s 1–4 (structures shown in Scheme 4). Absorbance normalized to 1.0 at elevated temperature: (a) OT-1 (■) and OT-2 (○) at 250 nm; (b) OT-1 (■) and OT-2 (○) at 330 nm; (c) OT-3 (■) and OT-4 (○) at 250 nm; (d) OT-3 (■) and OT-4 (○) at 330 nm.
The TFO can initiate association with its target duplex sequence from two different directions (Scheme 2); therefore, experiments were performed to determine if there was a relationship between the direction of nucleation and stability. The oligoTRIPs segment in OT-1 most likely nucleates from its 5′→3′ terminus with the duplex due to the way it is tethered to the duplex region. Based upon the same logic, OT-2 would initiate nucleation from 3′→5′. OT-2 shows a broad non-cooperative melt at 330 nm that has 6% hyperchromicity (Figure 1b). It was not possible to determine a TM for OT-2 at 330 nm (Figure 1b), but at 250 nm it is 75 °C (Figure 1a), which is attributed to the unfolding of the duplex. A nucleation preference has been reported for pyrimidine-purine-pyrimidine intramolecular triplex formation, which appears to be kinetically driven.35 In contrast, there is a clear thermodynamic difference between OT-1 and OT-2.
To determine the ability of antiCG to serve in the overall design of oligoTRIP mediated triplex formation, an intramolecular sequence requiring two major groove crossovers (OT-3) was constructed along with a similar sequence (OT-4) containing one mismatch between the duplex and oligoTRIP segment (Scheme 4). OT-3 unfolds with a TM of 68 °C and 6% hyperchromicity, while the mismatch melts with: (i) a TM that is 7 °C lower; (ii) less cooperativity; and (iii) 5% hyperchromicity (Figure 1). The melting studies suggest that the mismatch disrupts base stacking in the triplex structure but retains significant stability due to the residual five triplets. Previously we reported that OT-5, which is similar to OT-3 except for the substitution of one antiGC for an antiCG (Scheme 4), has a TM of 64 °C.20 This is consistent with an antiCG-C:G triplet being energetically equivalent to an antiGC-G:C triplet in the same flanking sequence context. The similarity between the unfolding melts for OT-3 and OT-5 also indicate that the oligoTRIP segment tracks Hoogsteen H-bong information on the purine simultaneously on both complementary strands regardless of the length of the purine track.
Intermolecular triplex formation at G/C rich sequences
While intramolecular DNA triplexes may form in sequences that can fold into H-DNA structures,36–38 the biological exploitation of triplex formation requires intermolecular complexes between the TFO and native DNA. TFO’s based upon the natural bases can bind to homopurine regions; however, there are additional limitations. The Pyrimidine-motif, which requires protonation of C’s in the TFO, is not able to effectively target extended runs of G because consecutive C’s in the TFO become more resistant to protonation at neutral pH.39–41 Multiple G’s in the TFO using the Purine-motif can also be problematic since the TFO can fold into a G-quartet.42,43 We have already reported that oligoTRIP can form stable intramolecular triplexes at G rich sequences.20
UV-visible temperature studies
To confirm the ability of oligoTRIPs to stably bind to G runs in an intermolecular triplex, we studied the interactions of OT-6 and OT-7 with their matched duplex targets (Scheme 5). The UV-visible melt of OT-6 in the presence of duplex-1 exhibits a temperature-dependent hyperchromicity at 330 nm with a TM near 45 °C that is attributed to the denaturation of the oligoTRIP from the duplex (Figure 2d). A second transition at 73.5 °C is observed at 250 nm for the unfolding of the duplex-1 to a random coil (Figure 2a). Substraction of the melting curve for the host duplex-1 from that of duplex-1 complexed to OT-6, provides the differential hyperchromicity due to the triplex structure at 250 nm, and the TM calculated (44 °C) is the same as that observed at 330 nm (Figure 2c).
Scheme 5.

Potential intermolecular structures for OT-6 + duplex-1 and OT-7 + duplex-2.
Figure 2.
UV melting curves in 10 mM phosphate buffer (pH 7.0) containing 1 M NaCl. Absorbance normalized to 1.0 at elevated temperature: (a) duplex-1 (○) and duplex-1 + OT-6 (●) at 250 nm, (b) duplex-2 ( ) and duplex-2 + OT-7 (■) at 250 nm; (c) curves are constructed by normalization of the absolute values resulting from the subtraction of the triplex (duplex + OT) curves at 250 nm from the corresponding duplex curves shown in (a) and (b); and (d) duplex-1 + OT-6 (●) and duplex-2 + OT-7 (■) at 330 nm.
Because of the topology of the major groove, the crossover distance, i.e., the distance between the point of C-glycoside attachment to the oligoTRIP and the N-glycoside attachment of the purine, in canonical B-DNA is calculated to be approximately 4.7 Å for a left to right cross (duplex-1) as compared with 5.9 Å for a right to left cross (duplex-2) (Scheme 5). The additional 1.2 Å could require some unfavorable distortion of the oligoTRIP’s backbone. Therefore, it was of interest to determine if the direction of the oligoTRIP crossover between complementary strands of the duplex impacted triplex formation. OT-7 (Scheme 5), which has the reverse polarity of OT-6, was prepared and its interaction with duplex-2 studied. OT-7 + duplex-2 shows evidence for triplex formation at 330 nm (Figure 2d). The TM of the triplex from OT-7 + duplex-2 is very close to that for OT-6 + duplex-1. The denaturation of duplex-2, without and with OT-7, is shown in Figure 2b. The differential melting curve for OT-7 + duplex-2 corrected for the melting curve of duplex-2 also shows hyperchromicity at 250 nm (Figure 2c) and the TM is the same as at 330 nm. The direction of the oligoTRIP crossover does not have a strong effect on stability based upon the UV-visible melting studies.
The introduction of a single mismatch between the oligoTRIPs and their target duplex causes a severe reduction in both the TM and hyperchromicity indicating that triplex formation is sequence specific (data not shown).
The unfolding cooperativity of these triplexes, measured from their van’t Hoff enthalpies, provides information about the size of their cooperative unit, i.e., the number of Hoogsteen base pairs melting simultaneously. We obtained heats of about 40 kcal/mol, for the removal of OT-6 and OT-7 from duplex-1 and -2, respectively, and ~72 kcal/mol for the unfolding of the two duplexes. The combined results clearly show triplex unfolding takes place sequentially in two bimolecular transitions (triplex → duplex → random coil); however, the first transition is somewhat cooperative while the second, as expected, is highly cooperative.
Fluorescence studies
The 2-aminoquinazoline and 2-aminoquinoline heterocycles that comprise the oligoTRIP bases are intrinsically fluorescent and we have previously shown that there is a clear relationship between fluorescence intensity and the stability of the triplex.19,20 The same phenomenon has been observed with intramolecular triplexes formed with “natural” TFO’s and has been attributed to the reduced rate of quenching when the TFO is docked in the major versus when it is exposed to solution.29,30 The temperature-dependent fluorescence of OT-6 with duplex-1 and OT-7 with duplex-2 relative to the single stranded oligoTRIPs gives an estimated TM of 42 °C (Figure 3), which mirrors the UV-visible studies (Figure 2).
Figure 3.
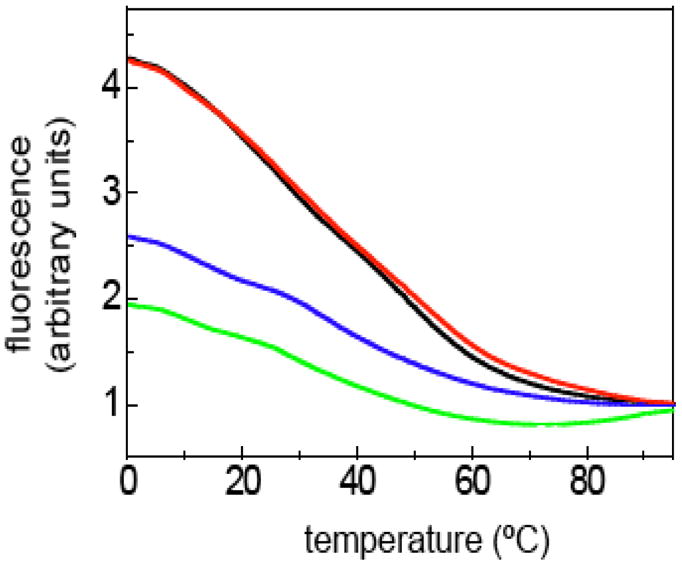
Fluorescence intensity versus temperature dependence for OT-6 (green), OT-7 (blue), OT-6 + duplex-1 (black) and OT-7 + duplex-2 (red).
Methylation protection
Additional confirmation that OT-6 and -7 are bound in the major groove to their complete duplex target sequence was obtained from DMS protection experiments using OT-6 + duplex-1 and OT-7 + duplex-2 (Figure 4). In the actual experiment, only one strand of either duplex was end-labeled and used to avoid having a mixture of duplexes: the individual complementary strands of duplex-1 can form a homo-strand duplex that is approximately as stable as the hetero-strand duplex. The same is true for complementary strands of duplex-2. The homo-strand duplex or homo-strand duplex + oligoTRIP was incubated with DMS at 4 °C in pH 7.0 buffer containing 1 M NaCl. These are the same incubation conditions used in the UV-vis melting experiments (Figure 2). Strand breaks at G were produced by direct treatment with hot piperidine, a reaction that selectively nicks the DNA at N7-methyl-dG.25 There is a strong DMS G-lane generated with both homo-strand duplexes that is diminished in the presence of the appropriate oligoTRIP. To account for differences in loading, quantification of the inhibitory effect was determined by calculating the % of counts in each G band relative to the total number of counts in each lane. Using 1:1 equivalents of homo-strand duplex-1 + OT-6, there is an average 67% inhibition in methylation at all of the G’s versus that observed with homo-strand duplex-1. Under the same conditions, the inhibition observed with homo-strand duplex-2 + OT-7 averaged 50%. The data indicate that with the matched duplex, OT-6 and OT-7 protect their entire binding sequence from methylation at N7-G, which is a Hoogsteen H-bond acceptor in triplex formation.
Figure 4.
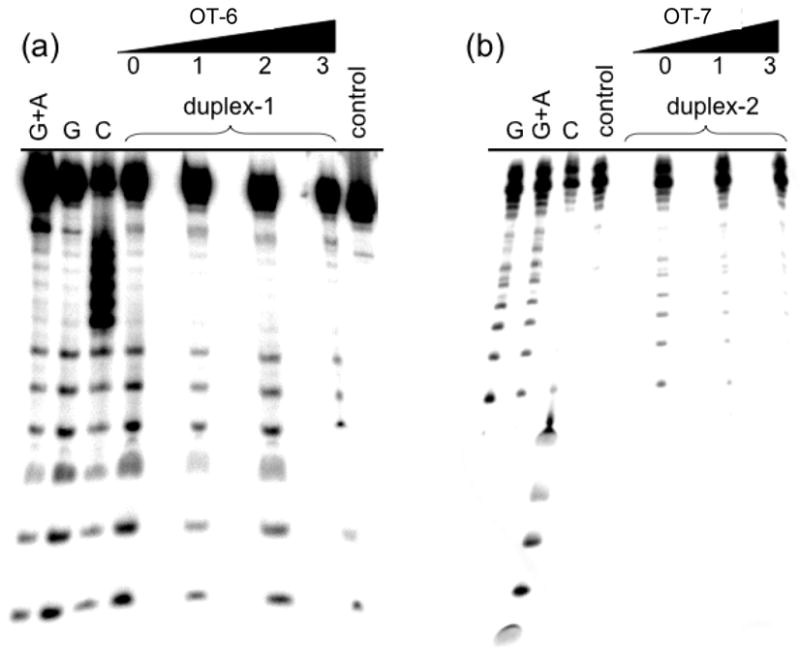
Effect of oligoTRIPs on the methylation of DNA by dimethyl sulfate: (a) duplex-1 + OT-6 and (b) duplex-2 + OT-7: number of equivalents of oligoTRIP relative to duplex is indicated.
Differential scanning calorimetry
To probe the thermodynamics of OT-6 triplex formation, differential scanning calorimetry (DSC) was performed (Figure 5). The temperature-dependent unfolding of duplex-1 (50 μM strand concentration) yields a monophasic transition (TM = 84.3 °C) while the unfolding of duplex-1 + OT-6 follows a biphasic behavior (TM’s of 60.8 and 83.3 °C); however, the higher TM transition overlaps with that of the duplex transition (Figure 5). This clearly indicates the sequential unfolding of triplex → duplex → random coils as suggested by the UV- visible melting studies (see above). The favorable formation of each molecule (negative free energy term) results from the characteristic compensation of favorable enthalpy and unfavorable entropy terms (Table 1). The favorable heat corresponds to contributions from base-pairing and base-stacking, while the unfavorable entropy terms results from the ordering of three strands (or two strands), and uptake of both counterions and water molecules. It should be noted that the TM’s calculated by UV-visible and DSC melts for the triplex → duplex and duplex → random coil transitions are significantly different (Table 1), which is not the case for intramolecular triplexes.20 The UV-vis and DSC melting experiments were done with a 1:1:1 stoichiometric concentrations of total strands: 2.5 μM (UV-vis) and 50 μM (DSC). In this range of strand concentrations, both the UV and DSC experiments show that the triplex formed from OT-6 + duplex-1 unfolds through biphasic transitions (triplex → duplex → random coil). However, the TM of the first transition (OT-6 melting) increases by 16–20 °C at the higher concentration, while the TM of the second transition (duplex melting) increases by ~10 °C. These differences are consistent with both the bimolecular nature of the transitions and the associated large unfolding enthalpies of 110 kcal/mol and 78 kcal/mol for the triplex and duplex, respectively.24
Figure 5.
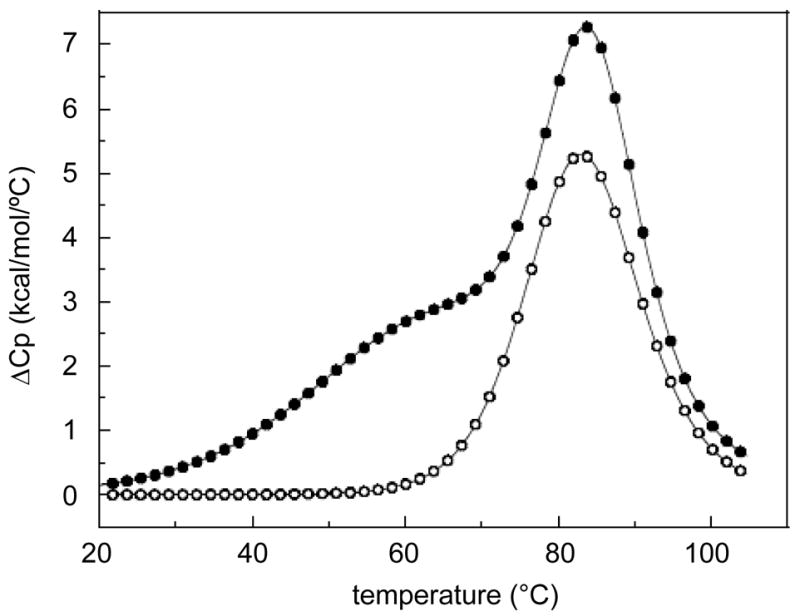
DSC melting curves of duplex-1 + OT-6 (●) and duplex-1 (○) in 10 mM sodium phosphate buffer (pH 7.0) with 1 M NaCl.
Table 1.
Thermodynamic profiles for the unfolding of duplex-1, duplex-1 + OT-6, duplex-2 and duplex-2 + OT-7 at 20 °C.a
| UV-melts (2.5 μM)
|
DSC melts (50 μM)
|
||||||
|---|---|---|---|---|---|---|---|
| TM (°C) | ΔHvH (kcal/mol) | TM (°C) | ΔHcal (kcal/mol) | ΔHvH (kcal/mol) | TΔS (kcal/mol) | ΔG°(20) (kcal/mol) | |
| duplex-1 | 73.7 | 74 | 83.3 | 106 | 101 | 87 | 18.8 |
| duplex-1 | 44.0 | 30 | 60.8 | 127 | 39 | 110 | 17.3 |
| + OT-6 | 73.7 | 75 | 84.3 | 95 | 91 | 78 | 17.1 |
| duplex-2 | 73.7 | 75 | 84.3 | 95 | 91 | 78 | 17.1 |
| duplex-2 | 42 | 29 | n.d.b | n.d. | n.d. | n.d. | n.d. |
| + OT-7 | 68.9 | 67 | |||||
All parameters are measured in 10 mM sodium phosphate buffer (pH 7.0) containing 1 M NaCl. The experimental uncertainties for DSC experiments are: TM (± 0.5 °C), ΔHcal (± 4%), TΔS (± 4%), ΔG° (± 6%) and ΔHvH (± 15%).
n.d., not determined.
Triplex unfolding of duplex-1 + OT-6 to the random coil state is accompanied by a total heat of 222 kcal, while duplex-1 yields a heat of 106 kcal/mol (Table 1); the difference of 116 kcal/mol is in good agreement with a heat of 95 kcal/mol, obtained by deconvolution of the duplex-1 + OT-6 DSC curve, and consistent with the formation of a triple helical structure. We also obtained ΔHvH/ΔHcal ratios of 0.31 for the triplex → duplex transition and 0.96 for the duplex → random coil transitions, indicating triplex unfolding takes place through the presence of intermediate states while duplex unfolding is two-state, i.e., no intermediates are present.24 These results are consistent with the broad melting behavior with intermolecular triplexes. Furthermore, if we assume that the three A:T base pairs at the ends of the duplex-1 are frayed, we estimate a contribution of 20.2 kcal/mol (222/11) per base triplet stack, which compares favorable with 21.7 kcal/mol for the unfolding of a natural C+GC/C+GC base-triplet stack.33
Triplex Formation at a Mixed Purine/Pyrimidine 19 Base Pair Target
To further test the limits of oligoTRIPs to read mixed and longer sequences, we synthesized OT-8 and measured its melting characteristics with duplex-3, which is designed to be a perfect match (Scheme 6). Binding of OT-8 to duplex-3 requires the TFO to move back and forth across (i.e., crossover) the major groove four times due to the four interruptions in the purine tracks in the duplex. The TM of OT-8 + duplex-3 is 40.2 °C at both 330 and 350 nm (Figure 6). The melting curve indicates significant cooperativity. The question remains whether the melt reflects triplex regions of different stabilities or a mixture of complexes resulting from partial triplex formation at different sequences, i.e., homopurine stretches in the duplex target.
Scheme 6.

Potential intermolecular structures for OT-8 with duplexes 3–8: X, antiTA; Y, antiGC; bold red X indicates a mismatch site. The color code for each intermolecular triplex structure correlates to the color code used in TM studies in Figure 6.
Figure 6.
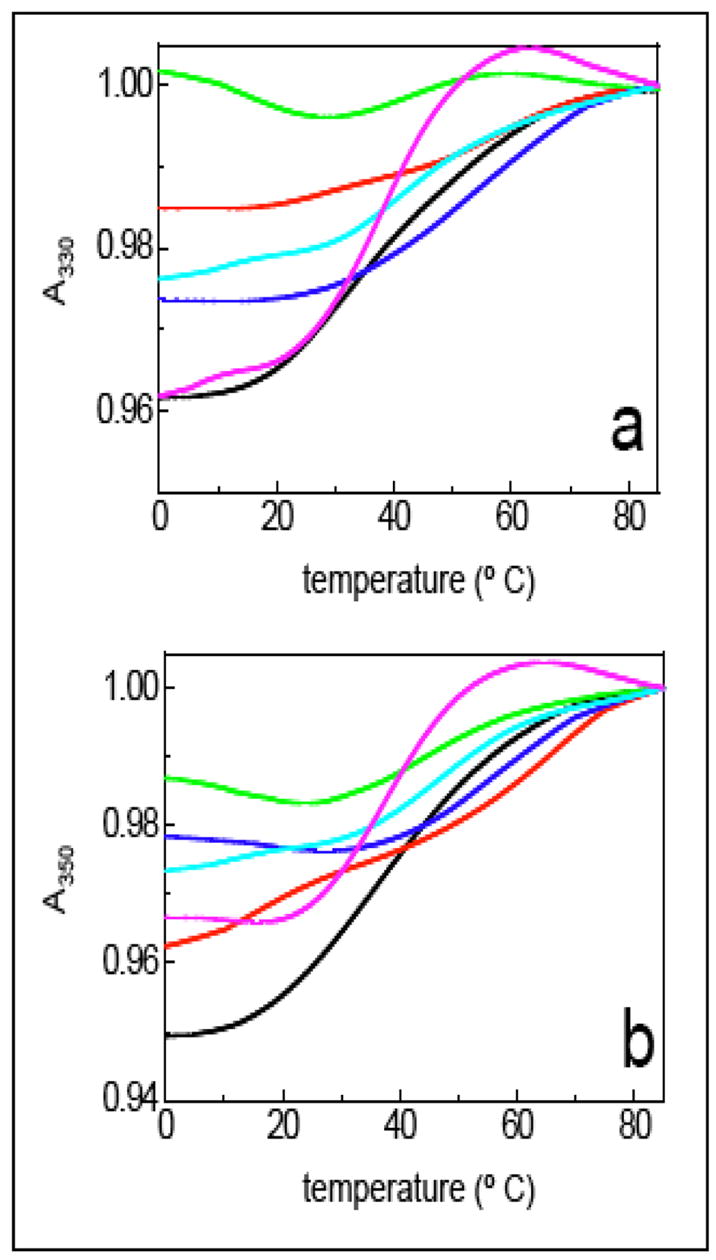
TM of OT-8 with matched duplex and duplexes with one or more mismatches between the TFO and duplex (see Scheme 6 for putative triplex structures): The UV-vis melting studies at (a) 330 nm and (b) 350 nm for OT-3 with duplex-3 (black), duplex-4 (red), duplex-5 (dark blue), duplex-6 (aqua), duplex-7 (magenta) and duplex-8 (green).
A series of duplexes that contain one or more mismatches with OT-8 were constructed to address this question (Scheme 6). The mismatch in duplex-4 is located at the 3′-G of the G rich strand. The UV-vis isotherm of OT-8 + duplex-4 shows a decrease in the hyperchromicity (4% to< 2%) at 330 nm which is the λmax for antiGC. At 350 nm, the λmax for antiTA, there is a smaller decrease in hyperchromicity (from 5 to 4%), and a two transition unfolding pathway is evident (Figure 6). Moving the mismatch to the 5′-A in the A2 sequence (duplex-5) slightly reduces the hyperchromicity to < 3% at 330 nm, and the calculated TM is 55 °C. At 350 nm (Figure 6), the mismatch reduces the hyperchromicity to 2% and the TM is also close to 55 °C. Disruption of the triplex at the central G in the G7 run (duplex-6) also reduces hyperchromicity (to < 3%) at 330 nm and the melt has a TM of 47 °C. At 350 nm hyperchromicity is reduced to < 3% and the TM is also47 °C. A mismatch at the 3′-G in the G2 region has only a modest effect on hyperchromicity, sharpens the cooperativity and results in no significant change in TM at both 330 and 350 nm (Figure 6). Finally, the introduction of two mismatches (at 3′-G of the G4 run and the 5′ A of the A3 run) between the duplex-8 and OT-8 virtually destroys all of the hyperchromicity at 330 nm, although there remains some vestige of a transition at 47 °C at 350 nm (Figure 6).
If OT-8 simply bound to isolated stretches of purine runs, the disruption induced by a single mismatch should be isolated to the purine stretch containing the mismatch. However, a mismatch between the oligoTRIP and the G5 run (duplex-4) almost eliminates the hyperchromicity at 330 nm and also has a significant effect on the unfolding cooperativity observed at 350 nm. This is despite the fact that there remains an intact G7 sequence in duplex-4 that the oligoTRIP could still bind to. The same global destabilization is observed when a G at the internal G7 run contains a mismatch (duplex-6). Even a mismatch at the short A2 sequence (duplex-5) significantly reduces overall stability as measured at 330 nm where the response is mainly due to changes in the environment at antiGC. The only mismatch that has minimal effect is the one at the terminal G2 sequence (duplex-7), which actually sharpens the melting curve and suggests that the formation of only two additional triplets at the terminus of the triplex structure may not be sufficiently stabilizing to make up for the penalty of an additional crossover. The data for OT-8 + duplex-3 are most consistent with semi-cooperative sequence selective binding of OT-8 to its target sequence.
Comparison of oligoTRIPs to other TFO’s
There are many examples of intermolecular triplex formation at homopurine sequences, but only a small number at mixed sequences and, in those cases, there is generally only one interruption in the purine run. OT-6 + duplex-1, which forms a 12 bp long triplex with one interruption of the purine tract, has a TM of 44 °C in 1 M NaCl at pH 7.0. OT-8 + duplex-3, with four interruptions in the purine sequence, forms a 19mer triplex structure that has a TM of 40.2 °C at neutral pH in 1 M NaCl. For comparison, the Pyrimidine-motif TFO, 5′-TCTTCTCTTTCT, which is also a 12mer, forms a triplex at its homopurine duplex target with a TM of < 30 °C under a variety of salt conditions.41 A 15mer TFO (5′-TTTTTCTCTCTCT) has a TM of 30 °C in solution containing > 300 mM salt.44 In 100 mM sodium cacodylate buffer (pH 5.6) containing 1 M NaCl a 13mer TFO (5′-CTTTTTZCTTCTC, where Z = T or C)) has a TM of approximately 38 °C with the appropriate homopurine duplexes; a single mismatch can destabilize the triplex by 11–27 °C.45 A 22mer TFO (5′-TTTCCTCCTCTTCTTCTTTTTT) binds with a TM of < 40 °C at pH 6.9 in 10 mM sodium cacodylate buffer (pH 6.9) containing 2 mM MgCl2.46 In comparison to natural TFO’s, the oligoTRIPs of the same length can form a triplex that is at least as stable and can also recognize heterogenous DNA sequences.
Summary
The formation of sequence specific intra- and intermolecular triplexes using antiCG, antiGC and antiTA is demonstrated. The results indicate that oligoTRIPs bind to mixed purine-pyrimidine sequences in intramolecular and intermolecular systems. Even a triplex that spans 19 bp’s of native DNA that has four interruptions in the purine information melts in a semi-cooperative manner. Further work is ongoing to synthesize the last of the four TRIPsides, antiAT, and to demonstrate that oligoTRIPs can be used to target any sequence of native DNA.
Scheme 3.

Synthesis of antiCG: a, KHSO4, N-methylpyrrolidinone, xylene, reflux; b, POCl3, reflux; c, K2CO3, CH3CONH2, 200 °C; d, 1,4-anhydro-2-deoxy-3-O-(tert-butyldiphenyl-silyl)-D-pent-1-enitol, Pd(dba)2, (t-Bu)3P, dicyclohexylmethylamine, dioxane, reflux; e, TBAF/HOAc; f, NaHB(OAc)3, −22 °C; g, TMS-Cl, (iPrCO)2O; h, DMTrCl, pyridine; i, 2-cyano-N,N, diisopropylphosphoramidite, Hunig base, CH2Cl2.
Acknowledgments
This work was supported by NIH Grant RO1 GM29088 and Cancer Center Support Grant P30 CA36727 from the National Cancer Institute. We are grateful to Greg Kubik of the Eppley Institute Molecular Biology Shared Resource for the synthesis of the oligoTRIPs.
References
- 1.Maher LJ, III, Wold B, Dervan PB. Antisense Res Dev. 1991;1:277–281. [PubMed] [Google Scholar]
- 2.Praseuth D, Guieysse AL, Hélène C. Biochim Biophys Acta. 1999;1489:181–206. doi: 10.1016/s0167-4781(99)00149-9. [DOI] [PubMed] [Google Scholar]
- 3.Fox KR. Curr Med Chem. 2000;7:17–37. doi: 10.2174/0929867003375506. [DOI] [PubMed] [Google Scholar]
- 4.Dervan PB. Bioorg Med Chem. 2001;9:2215–2235. doi: 10.1016/s0968-0896(01)00262-0. [DOI] [PubMed] [Google Scholar]
- 5.Kuan JY, Glazer PM. Meth Mol Biol. 2004;262:173–194. doi: 10.1385/1-59259-761-0:173. [DOI] [PubMed] [Google Scholar]
- 6.Unique sequence recognition, 1/(4n/2) will require an “n” of 17 nucleotides, assuming the mammalian genome is 4 × 10⁹ nucleotides.
- 7.Felsenfeld G, Davies DR, Rich A. J Am Chem Soc. 1957;79:2023–2024. [Google Scholar]
- 8.Moser HE, Dervan PB. Science. 1987;238:645–650. doi: 10.1126/science.3118463. [DOI] [PubMed] [Google Scholar]
- 9.Thuong NT, Hélène C. Angew Chem internat Ed Engl. 1993;32:666–690. [Google Scholar]
- 10.Postel EH, Flint SJ, Kessler DJ, Hogan ME. Proc Natl Acad Sci USA. 1991;88:8227–8231. doi: 10.1073/pnas.88.18.8227. [DOI] [PMC free article] [PubMed] [Google Scholar]
- 11.Vasquez KM, Narayanan L, Glazer PM. Science. 2000;290:530–533. doi: 10.1126/science.290.5491.530. [DOI] [PubMed] [Google Scholar]
- 12.Chan PP, Lin M, Faruqi AF, Powell J, Seidman MM, Glazer PM. J Biol Chem. 1999;274:11541–11548. doi: 10.1074/jbc.274.17.11541. [DOI] [PubMed] [Google Scholar]
- 13.McShan WM, Rossen RD, Laughter AH, Trial J, Kessler DJ, Zendegui JG, Hogan ME, Orson FM. J Biol Chem. 1992;267:5712–5721. [PubMed] [Google Scholar]
- 14.Kuznetsova S, Ait-Si-Ali S, Nagibneva I, Troalen F, Le Villian J-P, Harel-Bellan A, Svinarchuk F. Nucl Acids Res. 1999;27:3995–4000. doi: 10.1093/nar/27.20.3995. [DOI] [PMC free article] [PubMed] [Google Scholar]
- 15.Besch R, Giovannangeli C, Schuh T, Kammerbauer C, Degitz K. J Mol Biol. 2004;341:979–989. doi: 10.1016/j.jmb.2004.05.079. [DOI] [PubMed] [Google Scholar]
- 16.Cooney M, Czernuszewicz G, Postel EH, Flint SJ, Hogan ME. Science. 1988;241:456–459. doi: 10.1126/science.3293213. [DOI] [PubMed] [Google Scholar]
- 17.Pilch DS, Levenson C, Shafer RH. Biochemistry. 1991;30:6081–6088. doi: 10.1021/bi00239a001. [DOI] [PubMed] [Google Scholar]
- 18.Beal PA, Dervan PB. Science. 1991;251:1360–1363. doi: 10.1126/science.2003222. [DOI] [PubMed] [Google Scholar]
- 19.Li JS, Fan YH, Zhang Y, Marky LA, Gold B. J Am Chem Soc. 2003;125:2084–2093. doi: 10.1021/ja028033x. [DOI] [PubMed] [Google Scholar]
- 20.Li JS, Shikiya R, Marky LA, Gold B. Biochemistry. 2004;43:1440–1448. doi: 10.1021/bi035648d. [DOI] [PubMed] [Google Scholar]
- 21.Wehrmeister HL. J Heterocyclic Chem. 1976;13:61–63. [Google Scholar]
- 22.Ager IR, Barnes AC, Danswan GW, Hairsine PW, Kay DP, Kennewell PD, Matharu SS, Miller P, Robson Pl, Rowlands DA, Tully WR, Westwood R. J Med Chem. 1988;31:1098–1115. doi: 10.1021/jm00401a009. [DOI] [PubMed] [Google Scholar]
- 23.Farr RN, Davies GD., Jr Carbohydr Chem. 1990;9:653–660. [Google Scholar]
- 24.Marky LA, Breslauer KJ. Biopolymers. 1987;26:1601–1620. doi: 10.1002/bip.360260911. [DOI] [PubMed] [Google Scholar]
- 25.Maxam AM, Gilbert W. Methods Enzymol. 1980;65:499–560. doi: 10.1016/s0076-6879(80)65059-9. [DOI] [PubMed] [Google Scholar]
- 26.Liang G, Gannett P, Shi X, Zhang Y, Chen FX, Gold B. J Am Chem Soc. 1994;116:1131–1132. [Google Scholar]
- 27.Liang G, Gannett P, Gold B. Nucl Acids Res. 1995;23:713–719. doi: 10.1093/nar/23.4.713. [DOI] [PMC free article] [PubMed] [Google Scholar]
- 28.Perrin DD. Dissociation Constants of Organic Bases in Aqueous Solution. Butterworth Press; London: 1965. [Google Scholar]
- 29.Lyckell PO, Gräslund A, Claesens F, McLaughlin LW, Larsson U, Rigler R. Nucl Acids Res. 1987;15:9011–9025. doi: 10.1093/nar/15.21.9011. [DOI] [PMC free article] [PubMed] [Google Scholar]
- 30.Wu P, Nordlund TM, Gildea B, McLaughlin LW. Biochemistry. 1990;29:6508– 6514. doi: 10.1021/bi00479a024. [DOI] [PubMed] [Google Scholar]
- 31.Kato M, Kudoh J, Shimizu N. Biochem J. 1990;268:175–180. doi: 10.1042/bj2680175. [DOI] [PMC free article] [PubMed] [Google Scholar]
- 32.Shimizu M, Hanvey JC, Wells RD. J Biol Chem. 1989;264:5944–5949. [PubMed] [Google Scholar]
- 33.Soto AM, Loo J, Marky LA. J Am Chem Soc. 2002;124:14355–14363. doi: 10.1021/ja026952h. [DOI] [PubMed] [Google Scholar]
- 34.Plum GE, Breslauer KJ. J Mol Biol. 1995;248:679–695. doi: 10.1006/jmbi.1995.0251. [DOI] [PubMed] [Google Scholar]
- 35.Roberts RW, Crothers DM. J Mol Biol. 1996;260:135–146. doi: 10.1006/jmbi.1996.0388. [DOI] [PubMed] [Google Scholar]
- 36.Htun H, Dahlberg JE. Science. 1988;241:1791–1796. doi: 10.1126/science.3175620. [DOI] [PubMed] [Google Scholar]
- 37.Firulli AB, Maibenco DC, Kinniburgh AJ. Biochem Biophys Res Commun. 1992;185:264–270. doi: 10.1016/s0006-291x(05)80985-4. [DOI] [PubMed] [Google Scholar]
- 38.Raghavan SC, Chastain P, Lee JS, Hegde BG, Houston S, Langen R, Hsieh CL, Haworth IS, Lieber MR. J Biol Chem. 2005 doi: 10.1074/jbc.M502952200. Epub ahead of print. [DOI] [PubMed] [Google Scholar]
- 39.Wu P, Kawamoto Y, Hara H, Sugimoto N. J Inorg Biochem. 2002;91:277–285. doi: 10.1016/s0162-0134(02)00444-0. [DOI] [PubMed] [Google Scholar]
- 40.Leitner D, Schroder W, Weisz K. Biochemistry. 2000;39:5886–5892. doi: 10.1021/bi992630n. [DOI] [PubMed] [Google Scholar]
- 41.Sugimoto N, Wu P, Hara H, Kawamoto Y. Biochemistry. 2001;40:9396–9405. doi: 10.1021/bi010666l. [DOI] [PubMed] [Google Scholar]
- 42.Cheng AJ, Wang JC, Van Dyke MW. Antisense Nucl Acids Drug Dev. 1998;8:215–220. doi: 10.1089/oli.1.1998.8.215. [DOI] [PubMed] [Google Scholar]
- 43.Cheng AJ, Van Dyke MW. Gene. 1997;197:253–260. doi: 10.1016/s0378-1119(97)00269-2. [DOI] [PubMed] [Google Scholar]
- 44.Plum GE, Park YW, Singleton SF, Dervan PB, Breslauer K. J Proc Natl Acad Sci USA. 1990;87:9436–9440. doi: 10.1073/pnas.87.23.9436. [DOI] [PMC free article] [PubMed] [Google Scholar]
- 45.Mergny LL, Sun J-S, Montenay-Garestier T, Barcelo F, Chomilier J, Hélène C. Biochemistry. 1991;30:9791–9798. doi: 10.1021/bi00104a031. [DOI] [PubMed] [Google Scholar]
- 46.Protozanova E, Macgregor RB., Jr Anal Biochem. 1996;243:92–99. doi: 10.1006/abio.1996.0486. [DOI] [PubMed] [Google Scholar]