

Methane monooxygenase (MMO) catalyzes the energy dependent oxidation of methane to methanol in methanotrophic bacteria.1, 2 In these organisms two different methane monooxygenases have been identified, namely a membrane-associated or particulate MMO (pMMO) and a cytoplasmic or soluble MMO (sMMO). In methanotrophs that express both forms of the enzyme, the copper concentration during growth dictates which MMO is expressed.2–5 In cells cultured under a low copper/biomass ratio, the sMMO is predominately expressed, whereas cells cultured at higher copper/biomass ratios exclusively express the pMMO (sMMO is not transcribed).6–8 The sMMO is a well characterized three-component enzyme consisting of a hydroxylase, a reductase and a regulatory protein.9–12 Spectroscopic and X-ray crystallographic studies have established that the hydroxylase contains an oxygen bridged diiron cluster.13–16 Here we provide evidence that pMMO contains a diiron cluster as well.
Owing to the low specific activity and instability of most pMMO preparations,6, 17–20 comparatively little is known about the molecular properties of this enzyme. As isolated, pMMO is composed of three polypeptides with molecular masses of 45,000, 26,000, and 23,000 Da with a subunit structure of (αβγ)3. 6, 17, 18, 20–22 Most researchers agree that each αβγ contains 2 – 3 Cu atoms2, 6, 17–20, 23 although one group has suggested that 15 Cu atoms are arranged into catalytic and electron transfer trinuclear copper clusters.22, 24, 25 The 2.8 Å resolution crystal structure of pMMO revealed that each αβγ contained a dicopper site, a mononuclear copper site, and a third site occupied by zinc.21, 23 However, the preparation used for growing the crystal was inactive and did not contain zinc (which was added to the crystallization buffer).21, 23
The involvement of non-heme iron in methane oxidation by the pMMO has been proposed by some laboratories6, 17, 26–29 and disputed by others.22, 24, 30 In our laboratory at Iowa State University we have observed that preparations of pMMO showing highest specific activity contain 1–2 iron atoms.6 We therefore decided to employ Mössbauer spectroscopy to characterize the iron components. This technique is particularly well suited to explore iron environments that are EPR-silent and optically uninformative in the visible region, as is the spin-coupled diiron(III) center of the hydroxylation component of sMMO. It seemed reasonable to us to search for a similar diiron cluster because this is the only type of center known to oxidize methane to methanol at room temperature.
The 4.2 K Mössbauer spectrum of the antiferromagnetically coupled diiron(III) centers of sMMO consists of a doublet with quadrupole splitting ΔEQ = 1.12 mm/s for the M. capsulatus Bath enzyme15, 31 and ΔEQ = 1.02 mm/s for that of M. trichosporium OB3b13, 16 ; both enzymes have an isomer shift δ = 0.50 mm/s at 4.2 K (The clusters of the two enzymes yield broad absorption lines and equivalent fits have been obtained by assuming different ΔEQ values for the two iron sites; see ref 13, 15, 16, 31).
Table 1 lists analytical and activity data of our purified pMMO sample and of whole cells grown at high copper (80μM) and iron (40μM); the entries are discussed in the Supporting Information. Figure 1 shows 4.2 K Mössbauer spectra of purified pMMO. The central portion of the 45 mT spectrum (Figure 1A) exhibits two overlapping doublets with ΔEQ(1) = 1.05 mm/s, δ(1) = 0.50 mm/s (≈20% of total Fe) and ΔEQ(2) = 2.65 mm/s, δ(1) = 1.25 mm/s (≈18% of total Fe); the δ value of doublet 2 is characteristic of a high-spin Fe2+ with octahedral N/O coordination. The majority of the iron in the spectrum of Figure 1A, perhaps up to 60% of total Fe, belongs to a heterogeneous population of Fe3+ species exhibiting magnetic hyperfine structure with splittings up to 17 mm/s Doppler velocity. This Fe3+ fraction is EPR silent at X-band (Figure S3), and its ΔEQ and δvalues (0.63 mm/s and 0.51 mm/s at 120 K) are the same as those reported for mineralized nanoparticles (attributed to ferric phosphate) in mitochondria of yeast frataxin homolog (δyfh1) mutants.32 The ΔEQ and δ values of doublet 1 match those reported for the diiron(III) centers of sMMO. The solid line in Figure 1A is a spectral simulation representing two doublets 1 and 2, drawn such that their sum represents 38% of the total iron; the features of doublet 1 are indicated by the offset dashed line.
Table 1.
Properties of whole cells and purified pMMO Mössbauer samples.
| Whole Cells | PMMO | |
|---|---|---|
| αβγ (mM) | 0.56 | 1.06 |
| Total Fe (mM) | 5.2 | 1.2 |
| Fe in doublet 1 (mM) | 1.04 | 0.24 |
| Diiron(III)/αβγ | 0.93 | 0.11 |
| Activity (nmol · min−1 · mg pMMO protein−1) | ~1500 | 160 |
Figure 1.
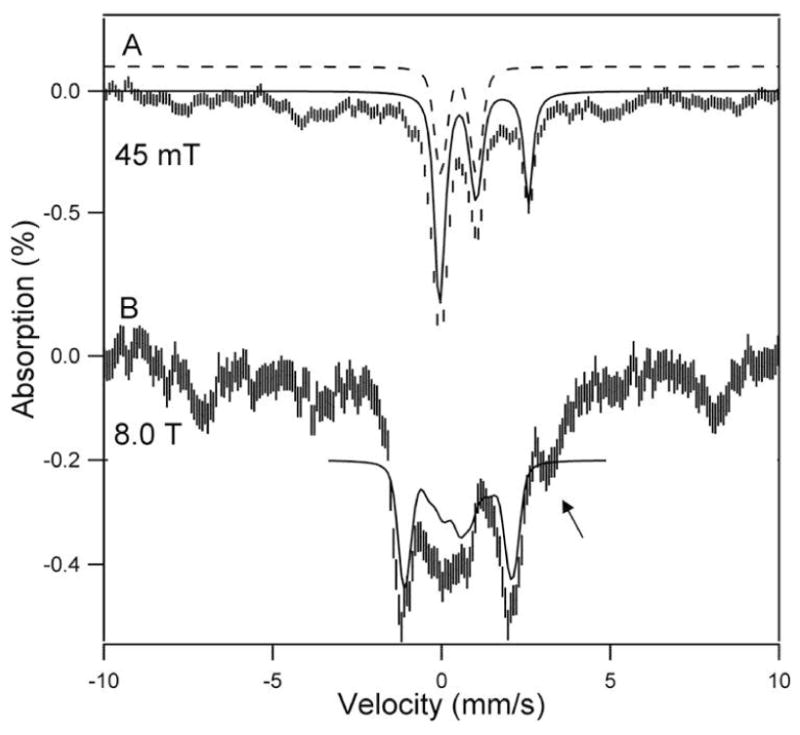
4.2 K Mössbauer spectra of anaerobically purified pMMO recorded in parallel applied fields of 45 mT (A) and 8.0 T (B). The solid line in (A) is a spectral simulation for doublet 1, assigned to a diamagnetic diiron(III) center (20% of Fe), and a high-spin Fe2+ (18%) component. The remainder of the absorption (magnetic components) belongs to various high-spin Fe3+ species. The dashed line outlines doublet 1. The solid line in (B) is a spectral simulation for the putative diiron(III) center, assuming S=0 and equivalent sites with ΔEQ = +1.05 mm/s, η = 0.8 and δ = 0.50 mm/s; η is the asymmetry parameter of the electric field gradient tensor. The arrow points at the high energy feature of the high-spin ferrous component. A second sample, exposed to oxygen after purification, gave identical spectra.
The spectrum of Figure 1B was recorded in an applied magnetic field of 8.0 T. Most interestingly, the 8.0 T spectrum shows that the iron of doublet 1 belongs to a diamagnetic (S=0) center, as demonstrated by the spectral simulation outlined by the vertically displaced solid line. The values of ΔEQ(1) and δ(1), together with the observed diamagnetism of this spectral component, strongly suggest that doublet 1 represents an antiferromagnetically coupled diiron(III) center similar to that found in sMMO.
Mössbauer spectroscopy is a very useful technique for the study of iron-containing proteins in whole cells, provided the concentration of the targeted proteins can be increased by overexpression33 or by employing special growth conditions. Since M. capsulatus Bath produces large amounts of pMMO (≈20% of whole cell protein) when grown at high copper and iron concentrations, we were curious whether doublet 1 would be observed in whole cells. We have found that maximal pMMO activity in cell free fractions requires the addition of approximately 40 μM iron in conjunction with 80 μM copper in the culture media. We have recorded Mössbauer spectra of whole M. capsulatus Bath cells grown on media high in copper and iron between 1.5 K and 120 K in applied fields up to 8.0 T. Figures 2B and 2D show two representative 4.2 K spectra. The signal strength of the Mössbauer spectrum of Figure 2B indicates that the cells contain roughly 5 mM 57Fe, in good agreement with the chemical analysis (5.2 mM). Ca. 40% of the iron belongs to a magnetic component of high-spin Fe3+ outlined by the solid line in (B); it yields a doublet with ΔEQ δ ≈ 0.6 mm/s and δ = 0.45 mm/s at 120 K (not shown). This component exhibits spectra typical of superparamagnetic nanoparticles,32, 34 probably composed of mineralized excess iron accumulated during aerobic growth at high Fe concentrations. Simulation of the 45 mT spectrum of the superparamagnetic component of Figure 2B is quite straightforward (but not unique); however, fitting the outer four lines fixes position and intensities of the two innermost lines of the six-line pattern. Subtraction of the simulated superparamagnetic component from the raw data yields a spectrum (Figure 2C) which exhibits doublet 1 (≈20%, solid line) with exactly the same parameters as observed in the purified enzyme. Also observed is a high-spin Fe2+ species with ΔEQ ≈ 3.00 mm/s and δ ≈ 1.25 mm/s. The solid line in the 8.0 T spectrum of Figure 2D is a spectral simulation showing that the iron of doublet 1, as in the purified protein, belongs to a diamagnetic center. The broad features, stretching from ca. – 9 mm/s to +9 mm/s Doppler velocity, belong to the superparamagnetic components35 and the Fe2+ species. Finally, Figure 2A shows a 4.2 K Mössbauer spectrum of cells grown at low Cu and 57Fe concentrations (each 5 μM ; pMMO < 5% of total cell protein) where pMMO expression is reduced four fold.6 Compared to the sample of Figure 2B the signal amplitudes have declined by at least a factor 15, showing that the iron observed in the spectra of Figure 2B and D accumulates when the cells are growing at high Cu and Fe concentrations.
Figure 2.

4.2 K Mössbauer spectra of M. capsulatus Bath cells grown at 5 μM Cu and 5 μM 57Fe (A) and at 80 μM Cu and 40 μM 57Fe (B-D). The spectra were recorded in parallel applied fields as indicated. The sample of (B) and (D) consisted of cells grown at 80 μM Cu and 40 μM 57Fe, then harvested, washed, and resuspended anaerobically. The solid line in (B), representing 40% of the 57Fe, is a simulation of the superparamagnetic component, obtained by superimposing four high-spin ferric spectra; the simulation was solely aimed at representing the spectral area of this species at one particular applied field. (C) Difference spectrum obtained by subtracting the simulated spectrum of (B) from the raw data of (B). The solid line represents doublet 1 (20% of 57Fe). (D) 8.0 T spectrum. The solid line is a simulation assuming that the iron of doublet 1 is diamagnetic.
The purified pMMO sample (1.06 mM αβγ) had an iron concentration of 1.2 mM. If we associate the iron of doublet 1 with a diiron(III) cluster, we obtain a site occupancy of ca. 11%, assuming that pMMO can accommodate one diiron center/αβγ. The cells of Figure 2B had 5.2 mM iron, yielding 0.2×5.2/2 = 0.52 mM diiron centers. In previous experiments we estimated that ca. 20% of the protein in cells cultured in media containing on 80 μM Cu and 40 μM Fe belongs to pMMO.6 Using this estimate, the sample of Figure 2B has 0.56 mM pMMO, suggesting that pMMO in thus cultured cells has η 0.93 diiron(III) center/αβγ. The above estimates agree quite well with the observation that we recover ca. 10% of activity after purification of the protein.
We have assigned doublet 1 to a diiron(III) center. The Mössbauer properties of doublet 1 are also compatible with those observed for some low-spin ferrous hemes, such as cytochromes c and b, and [4Fe-4S]2+ clusters. However, the UV/visible spectrum of the Mössbauer sample (Figure S2) indicates less than 0.005 hemes/αβγ, and the cellular concentration of heme in cells cultured in 5 μM Cu and 5 μM Fe is essentially identical to cells cultured in 80 μM Cu and 40 μM Fe.20 [4Fe-4S]2+ clusters can be excluded by observing that pMMO has only one cysteine residue, Cys 92 on the α subunit,21, 36 and that the presence of sulfide has not been reported by any laboratory.
The Fe2+ component(s) observed in whole cells have a larger ΔEQ than the Fe2+ species observed in Figure 1A, and thus represent a different type of Fe2+, plausibly iron bound to transporters and storage components. Perhaps as much as 60% of the iron observed in the purified pMMO sample of Figure 1 belongs to high-spin Fe.3+ The EPR spectra of Figure S3 are almost devoid of iron associated signals; the resonances at g ≈ 6 and 4.3 account each for at most 10 μM Fe3+, i. e. only 1% of the iron. We suspect that the EPR-silent Fe3+ represents remnants of the mineralized fraction observed in whole cells that copurify with the enzyme. We have observed similar EPR-silent Fe3+ fractions in other proteins studied in our laboratory; invariably, these fractions disappeared as purification procedures improved. The reader may wonder whether doublet 1 could represent a dimer fraction of a mineralized Fe3+. We have recently studied Mössbauer spectra of yah1-depleted mitochondria from aerobically grown S. cerevisiae. For this mutant (which lacks iron-sulfur proteins) all detectable iron (2–3 mM) could be assigned to Fe3+ nanoparticles, with no evidence for a diamagnetic dimer fraction (unpublished results).
Given the similarities of the Mössbauer parameters of doublet 1 with those observed in sMMO, it is reasonable to propose that pMMO has an active site consisting of a diiron cluster, and that this cluster is bound in the site occupied by Zn from the crystallization buffer, a possibility indicated by Lieberman and Rosenzweig.21 Interestingly, this site has two conserved His and two conserved carboxylate (His 160 and 173, Asp 156 and Glu 195). Moreover, the site has four additional nearby residues with carboxylates functions, Glu 69, Glu 176, Asp 166 and Asp 168, which are conserved in all known pMMO sequences. Thus, as shown in Figure 3A, the “Zn site” of pMMO has the requisite ligands to accommodate a sMMO type diiron center, and has suggestive similarities with the diiron site of sMMO, shown in Figure 3B. Placing the active site of pMMO into the “Zn site” is supported by the observation that exposure of the cells or purified pMMO to 14C-acetylene, a suicide substrate for pMMO, yields labeled β subunits (the copper sites of pMMO are located on α).20, 37–39 With a target spectral signature, the loss of iron during purification of pMMO can now be studied by recording Mössbauer spectra through the various steps of the purification procedure.
Figure 3.
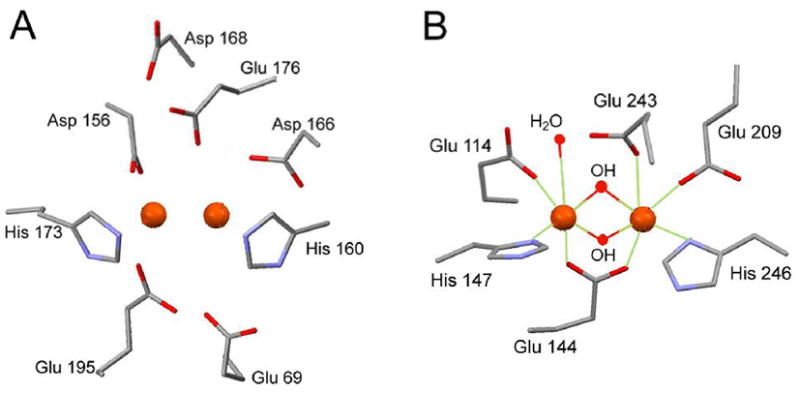
(A) Replacement of the mononuclear Zn by a diiron center in the X-ray structure of pMMO.21 (B) Environment of the diiron center in the sMMO from M. trichosporium OB3b.14
Supplementary Material
UV-visible and EPR spectra, analytical data and experimental details. This information is available free of charge via the internet at http://pubs.acs.org/.
Acknowledgments
This work was supported by the NIH grant EB-001475 and Department of Energy grant 96ER20237 and by the Office of Vice President for Research at The University of Michigan.
References
- 1.Anthony C. The Biochemistry of Methanotrophs. The Academic Press; london: 1982. [Google Scholar]
- 2.Dalton H. Phil Trans Royal Society of London, Series B: Biological Sciences. 2005;360:1207–1222. doi: 10.1098/rstb.2005.1657. [DOI] [PMC free article] [PubMed] [Google Scholar]
- 3.Dalton CPSD, Leak DJ, Stanley SH. Microbial Growth on C1 Compounds. 1984:75–82. [Google Scholar]
- 4.Prior SD, Dalton H. J Gen Microbiol. 1985;131:155–163. [Google Scholar]
- 5.Stanley SH, Prior SD, Leak DJ, Dalton H. Biotech Lett. 1983;5:487–492. [Google Scholar]
- 6.Choi DW, Kunz RC, Boyd ES, Semrau JD, Antholine WE, Han JI, Zahn JA, Boyd JM, de la Mora AM, DiSpirito AA. J Bacteriol. 2003;185:5755–5764. doi: 10.1128/JB.185.19.5755-5764.2003. [DOI] [PMC free article] [PubMed] [Google Scholar]
- 7.Murrell JC, McDonald IR, Gilbert B. Trends Microbiol. 2000;8:221–225. doi: 10.1016/s0966-842x(00)01739-x. [DOI] [PubMed] [Google Scholar]
- 8.Stolyar S, Franke M, Lidstrom ME. J Bacteriol. 2001;183:1810–1812. doi: 10.1128/JB.183.5.1810-1812.2001. [DOI] [PMC free article] [PubMed] [Google Scholar]
- 9.Fox BG, Froland WA, Dege JE, Lipscomb JD. J Biol Chem. 1989;264:10023–10033. [PubMed] [Google Scholar]
- 10.Green J, Dalton H. J Biol Chem. 1985;260:15795–15801. [PubMed] [Google Scholar]
- 11.Wallar BJ, Lipscomb JD. Chem Rev. 1996;96:2625–2657. doi: 10.1021/cr9500489. [DOI] [PubMed] [Google Scholar]
- 12.Wallar BJ, Lipscomb JD. Biochemistry. 2001;40:2220–2233. doi: 10.1021/bi002298b. [DOI] [PubMed] [Google Scholar]
- 13.Fox BG, Surerus KK, Münck E, Lipscomb JD. J Biol Chem. 1988;263:10553–10556. [PubMed] [Google Scholar]
- 14.Elango WA, Radhakrishman R, Froland WA, Wallar BJ, Earhart CA, Lipscomb JD, Olhendorf DH. Protein Sci. 1996;6:556–568. doi: 10.1002/pro.5560060305. [DOI] [PMC free article] [PubMed] [Google Scholar]
- 15.Liu KE, Valentine AM, Wang A, Huynh BH, Edmondson DE, Saligoflou A, Lippard SL. J Am Chem Soc. 1995;117:10174–10185. [Google Scholar]
- 16.Fox BG, Hendrich MP, Surerus KK, Andersson KK, Froland WA, Lipscomb JD, Münck E. J Am Chem Soc. 1993;115:3688–3701. [Google Scholar]
- 17.Basu P, Katterle B, Andersson KK, Dalton H. Biochem J. 2003;369:417–427. doi: 10.1042/BJ20020823. [DOI] [PMC free article] [PubMed] [Google Scholar]
- 18.Lieberman RL, Shrestha DB, Doan PE, Hoffman BM, Stemmler TL, Rosenzweig AC. PNAS. 2003;100:3820–3825. doi: 10.1073/pnas.0536703100. [DOI] [PMC free article] [PubMed] [Google Scholar]
- 19.Takeguchi M, Miyakawa K, Okura I. J Mol Cat A. 1998;132:145–153. [Google Scholar]
- 20.Zahn JA, DiSpirito AA. J Bacteriol. 1996;178:1018–1029. doi: 10.1128/jb.178.4.1018-1029.1996. [DOI] [PMC free article] [PubMed] [Google Scholar]
- 21.Lieberman RL, Rosenzweig AC. Nature. 2005;434:177–182. doi: 10.1038/nature03311. [DOI] [PubMed] [Google Scholar]
- 22.Nguyen HH, Elliott SJ, Yip JH, Chan SI. J Biol Chem. 1998;273:7957–7966. doi: 10.1074/jbc.273.14.7957. [DOI] [PubMed] [Google Scholar]
- 23.Hakemian AS, Rosenzweig AC. Ann Rev of Biochem. 2007;76:223–241. doi: 10.1146/annurev.biochem.76.061505.175355. [DOI] [PubMed] [Google Scholar]
- 24.Chan SI, Chen KHC, Yu SSF, Chen CL, Kuo SSJ. Biochemistry. 2004;43:4421–4430. doi: 10.1021/bi0497603. [DOI] [PubMed] [Google Scholar]
- 25.Chan SI, Wang VCC, Lai JCH, Yu SSF, Chen PPY, Chen KHC, Chen CL, Chan MK. Angew Chem Int Ed. 2007;46:1992–1994. doi: 10.1002/anie.200604647. [DOI] [PubMed] [Google Scholar]
- 26.Choi DW, Antholine WE, Do YS, Semrau JD, Kisting CJ, Kunz RC, Campbell D, Rao V, Hartsel SC, DiSpirito AA. Microbiology. 2005;151:3417–3426. doi: 10.1099/mic.0.28169-0. [DOI] [PubMed] [Google Scholar]
- 27.Myronova N, Kitmitto A, Collins RF, Miyaji A, Dalton H. Biochemistry. 2006;45:11905–11914. doi: 10.1021/bi061294p. [DOI] [PubMed] [Google Scholar]
- 28.Takeguchi M, Ohashi M, Okura I. BioMetals. 1999;12:123–129. [Google Scholar]
- 29.Tukhvatullin IA, Gvozdev RI, Andersson KK. Biochem Biophys Mol Biol. 2000;374:177–182. [PubMed] [Google Scholar]
- 30.Lieberman RL, Kondapalli KC, Shrestha DB, Hakemian AS, Smith SM, Telser J, Kuzelka J, Gupta R, Borovik AS, Lippard SJ, Hoffman BM, Rosenzweig AC, Stemmler TL. Inorg Chem. 2006;45:8372–8381. doi: 10.1021/ic060739v. [DOI] [PMC free article] [PubMed] [Google Scholar]
- 31.DeWitt JG, Bentsen JG, Rosenzweig AC, Hedman B, Green J, Pilkington S, Papaefthymiou GC, Dalton H, Hodgson KO, Lippard SJ. J Am Chem Soc. 1991;113:9219–9235. [Google Scholar]
- 32.Lesuisse E, Santos R, Matzanke BF, Knight SAB, Camadro JM, Dancis A. Hum Mol Gen. 2003;12:879–889. doi: 10.1093/hmg/ddg096. [DOI] [PubMed] [Google Scholar]
- 33.Vrajmasu VV, Bominaar EL, Meyer J, Münck E. Inorg Chem. 2002;41:6358–6371. doi: 10.1021/ic020508y. [DOI] [PubMed] [Google Scholar]
- 34.Long GL. Mossbauer Spectroscopy Applied to Inorganic Chemistry. Vol. 2 Plenum Press; New York: 1984. [Google Scholar]
- 35.The magnetic spectra of superparamagnetic particles are exceedingly complex as they depend on the size, shape and shape distribution of these particles, see ref. 34.
- 36.Semrau JD, Chistoserdov A, Lebron J, Costello A, Davagnino J, Kenna E, Holmes AJ, Finch R, Murrell JC, Lidstrom ME. J Bacteriol. 1995;177:3071–1379. doi: 10.1128/jb.177.11.3071-3079.1995. [DOI] [PMC free article] [PubMed] [Google Scholar]
- 37.DiSpirito AAGJ, Schiemke AK, Murrell JC, Lidstrom ME. Biodegradation. 1992;2:151–164. [Google Scholar]
- 38.Hyman MRADJ. J Biol Chem. 1992;267:1534–1545. [PubMed] [Google Scholar]
- 39.Prior SD, Dalton H. FEMS Microbiol Lett. 1985;29:105–109. [Google Scholar]
Associated Data
This section collects any data citations, data availability statements, or supplementary materials included in this article.
Supplementary Materials
UV-visible and EPR spectra, analytical data and experimental details. This information is available free of charge via the internet at http://pubs.acs.org/.