Abstract
The pH sensitive contrast agent, GdDOTA-4AmP (Gd1) has been successfully used to map tissue pH by MRI. Further studies now demonstrate that two distinct chemical forms of the complex can be prepared depending upon the pH at which Gd3+ is mixed with ligand 1. The desired pH sensitive form of this complex, referred to here as a Type II complex, is obtained as the exclusive product only when the complexation reaction is performed above pH 8. At lower pH values, a second complex is formed that, by analogy with an intermediate formed during preparation of GdDOTA, we tentatively assign this to a Type I complex where the Gd3+ is coordinated only by the appended side-chain arms of 1. The proportion of Type I complex formed is largely determined by the pH of the complexation reaction. The magnitude of pH dependent change in relaxivity of Gd1 was found to be less than earlier reported (S. Zhang, K. Wu, and A. D. Sherry, Angew. Chem., Int. Ed., 1999, 38, 3192), likely due to contamination of the earlier sample by an unknown amount of Type I complex. Examination of the NMRD and relaxivity temperature profiles, coupled with information from potentiometric titrations, shows that the amphoteric character of the phosphonate side-chains enables rapid prototropic exchange between the single bound water of the complex with those of the bulk water thereby giving Gd1 a unique pH dependent relaxivity that is quite useful for pH mapping of tissues by MRI.
Keywords: Lanthanides, MRI contrast agents, pH responsive, Stability constants
Introduction
The measurement of pH in vivo is an important goal in the diagnosis and aetiology of kidney disease and cancer.1–4 Although tissue pH can be measured using microelectrodes,2, 3 electrodes are invasive and can only provide a very low resolution distribution of tissue pH. Various NMR spectroscopic approaches have also been used in vivo but they generally suffer from low sensitivity and spatial resolution. Magnetic resonance imaging (MRI) on the other hand provides exquisite anatomical resolution because the MRI signal is largely derived from abundant tissue water so this might be the technique of choice for mapping tissue pH from organs deep with the body. Although MRI contrast agents have been used for over two decades,5,6 none of the clinically approved agents are sensitive to tissue pH. To be useful as a pH reporter, a contrast agent must meet several criteria. The complex must be thermodynamically stable and kinetically inert so that Gd3+ is not released in vivo,5 the complex itself must be non-toxic, the relaxivity of the complex should respond to changes in pH over the extremes of tissue pH (~pH 5–8)2,3 and, ideally, the relaxivity of the complex should not be sensitive to endogenous metal ions, anions or proteins.7 A number of agents that exhibit changes in relaxivity with pH have been reported8–12 and among them is Gd1 (GdDOTA-4AmP), an agent that displays a pH sensitive relaxivity profile that is nearly ideal for in vivo applications.13 Indeed, pH maps of mouse kidney and implanted tumors have been recorded by MRI using this agent.14–16 In this paper, we report studies that examined the relaxation and complexation properties of Gd1 (Chart 1) in more detail.
Chart 1.
Results and Discussion
Synthesis
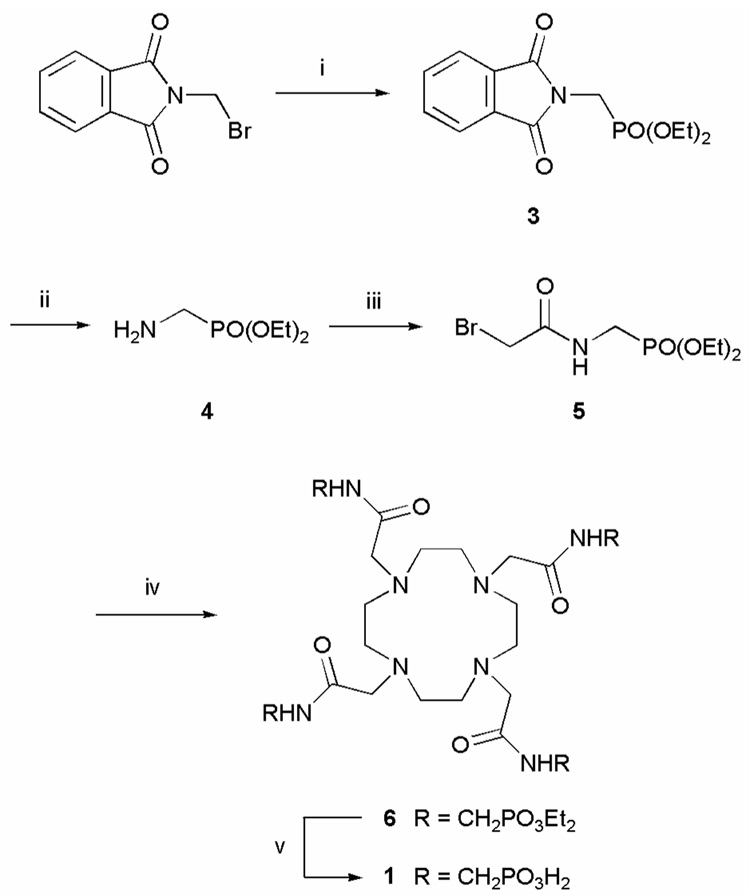
The ligand 1 was synthesized by the route described in Scheme 1. Diethyl phosphite and bromomethyl phthalimide were mixed and heated without solvent.17 The ethyl bromide that evolved during the reaction was removed by distillation to afford 3 in 99% yield. The phthalimide group was then removed with hydrazine in ethanol.17,18 After column chromatography over silica gel, the amine 4 was reacted with bromoacetyl bromide to afford the bromoacetamide 5. Alkylation of cyclen with the bromoacetamide 5 afforded the protected ligand 6 in 61% yield. The ethyl esters were removed using 30% HBr in acetic acid to liberate 1 in 30% overall yield.
Scheme 1.
Synthesis of 1. Reagents and conditions: i.) P(OEt)3 / Δ; ii.) N2H4 / EtOH; iii.) BrCH2COBr / K2CO3 / benzene; iv.) cyclen / K2CO3 / MeCN / 60°C; v.) 30% HBr / AcOH / RT.
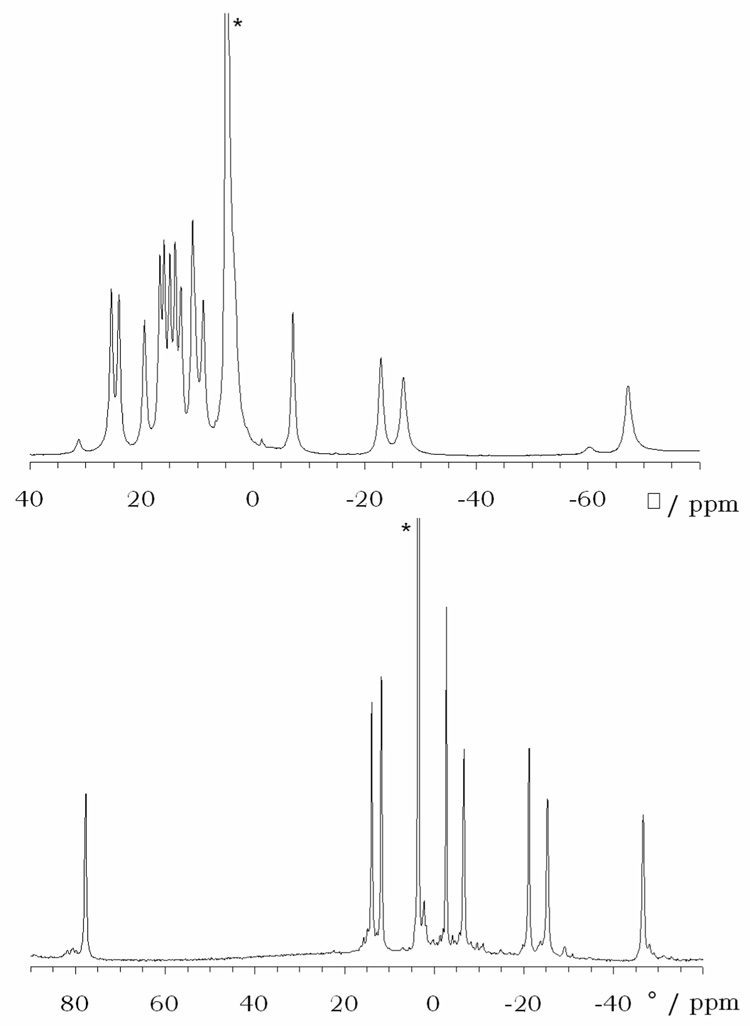
As a general rule, lanthanide complexes of simple DOTA-tetraamide ligands like DOTAM (Chart 1) are readily prepared in acetonitrile by mixing the unprotonated form of the ligand with a lanthanide triflate salt or in water by mixing the ligand with either a lanthanide triflate or lanthanide chloride salt.12,19,20 In aqueous media, the pH of the complexation reaction is an important consideration; lanthanides form insoluble hydroxides above pH ~621 while reactions run at lower pH values can be quite slow. As a consequence, complexation reactions in water are usually carried out under mildly acidic conditions, typically between pH 5–6.12,20 Since the ligand 1 is isolated as a hydrobromide salt using the method described in Scheme 1, the complexation reaction must be performed in water for solubility reasons. However, in this case, upon mixing a lanthanide salt with the ligand under acidic conditions, i.e. normal complexation conditions, the expected, symmetric, complex structure is not the predominant reaction product. If the reaction pH is low enough then a single structure of lower symmetry is formed exclusively. This is best illustrated by the 1H NMR spectrum of the ytterbium complex prepared at pH 1 (Figure 1a).
Figure 1.
The 1H NMR spectra of Yb1 complexes synthesized and recorded at a) pH 1, b) pH 9. The spectra were recorded in D2O at 296K and 270 MHz (the peaks arising from HOD are labelled with asterisks).
When the reaction is performed at higher pH values, an increasing amount of the desired, symmetric product is formed. Furthermore, in contrast to most complexation reactions involving lanthanides with DOTA-type ligand systems, raising the pH above ~6 does not result in the precipitation of the lanthanide.21 In fact, in this system, the pH can be raised above 10 without observable precipitation. This was an important observation because it is not until the pH of the reaction mixture exceeds 8 that the desired highly symmetrical complex is obtained as the exclusive product. This is seen in the 1H NMR spectrum of the ytterbium complex formed at pH 9 (Figure 1b). Similar results were obtained for other lanthanide complexes.
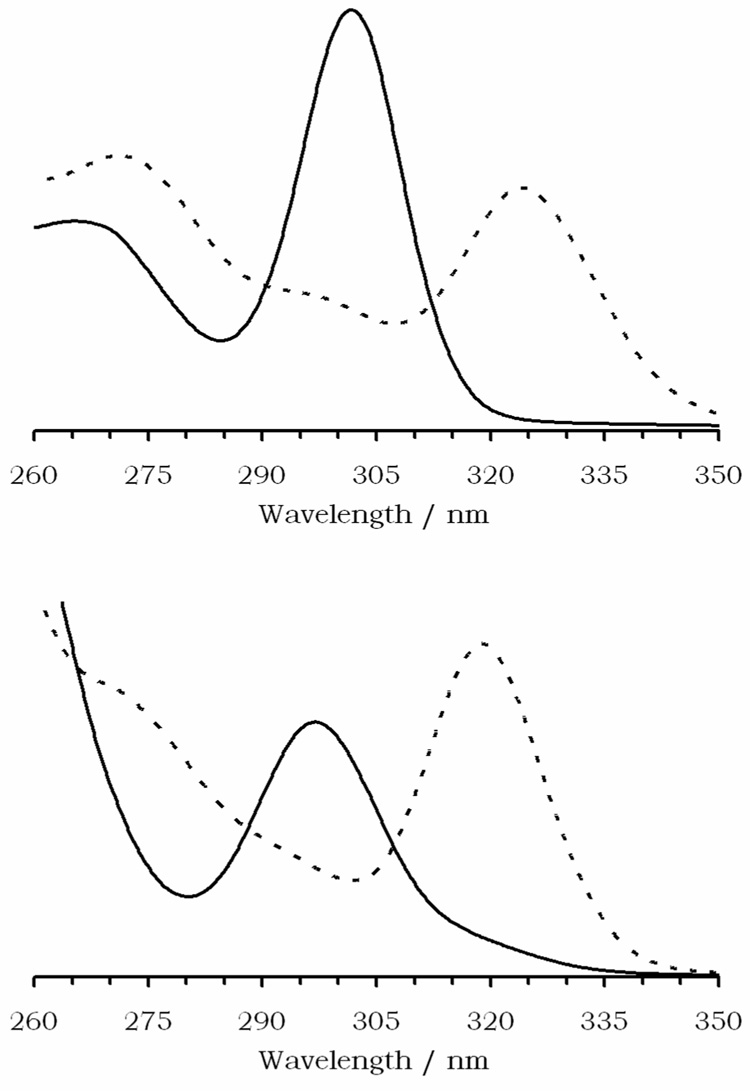
The difference between the NMR spectrum of the desired product and that of the complex formed under acidic conditions is marked. The desired product shows eight resonances of equal intensity, consistent with the expected C4-symmetry of the complex. Furthermore, the characteristic lanthanide induced shift (LIS) pattern of the DOTA-type framework22,23 is evident. In contrast, sixteen hyperfine shifted, relatively sharp resonances of equal intensity are evident in the 1H NMR spectrum of the structure formed at low pH, consistent with formation of a different, yet well-defined, complex with C2-symmetry. Although further studies will be required to determine the detail of this structure, it is postulated that this species has a structure similar to that of the intermediate formed during the synthesis of LnDOTA− complexes. In this intermediate, often referred to as a Type I complex, the lanthanide ion sits well above the cyclen ring coordinated only to the four appended carboxyl groups and several water molecules.24 The assignment of a Ln1 species formed at low pH to a Type I complex is supported by the absorption spectra of the cerium complexes prepared at pH 1 and pH 9. The 4f1 → 4f05d1 transition of the cerium ion is found to be extremely sensitive to the coordination environment of the cerium ion and has been reported to be a useful probe of the interconversion of Type I and Type II complexes.24,25 These spectra (Figure 2) show that the Ce1 complex formed at low pH has an absorption maximum similar to that of the Type I complex of CeDOTA so one can conclude that the Ce3+ ion is probably coordinated only by oxygen donors above the macrocyclic ring. The macrocyclic ring does not participate in coordination of the metal ion in this structure presumably because of electrostatic repulsion between the trivalent lanthanide ion and the protonated macrocyclic ring nitrogen atoms. Although usually very short-lived in solution, a crystal structure of a Type I complex of LnDOTAM has been obtained by Parker and co-workers in which the coordination shell of the lanthanide ion is completed by 4 water molecules.26 In the case of Ln1, it is reasonable to assume that the phosphonate groups of the pendant arms, which have a high affinity for hard metal ions like the lanthanide ions, are also involved in binding the metal ion to form a Type I complex. This results in a stable structure that, once formed, will persist in solution under acidic conditions for months. It is possible to convert the Type I structure to the more desirable, and more thermodynamically stable, Type II complex by raising the pH. These observations highlight the importance of controlling the reaction pH when synthesizing the lanthanide complexes of 1. To achieve the more highly desired pH sensitive, Type II complex, the reaction should be performed above pH 8 and preferably around pH 9.
Figure 2.
UV-visible absorption spectra of Ce1 (top) prepared at pH 1 (solid line) and pH 9 (dashed line). The absorption bands are similar to those observed for the Type I (solid line) and Type II (dashed line) complexes of CeDOTA (bottom).
pH responsive relaxometry studies
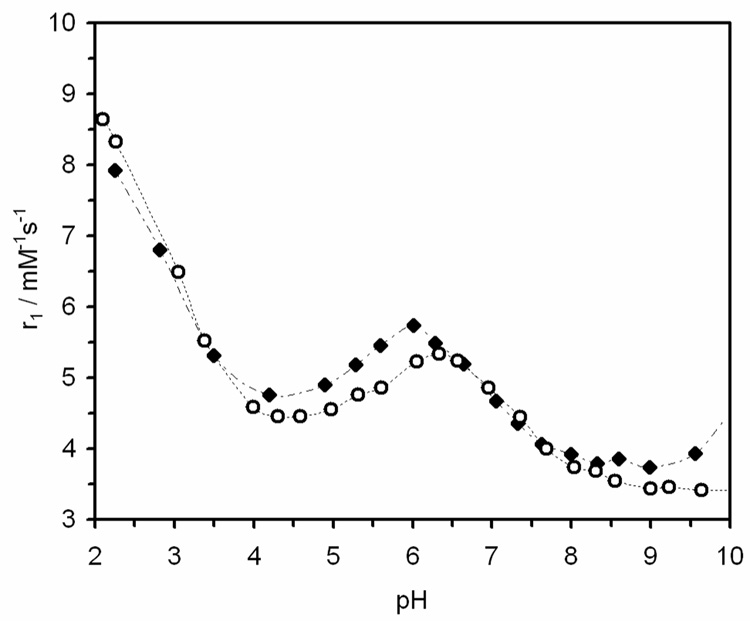
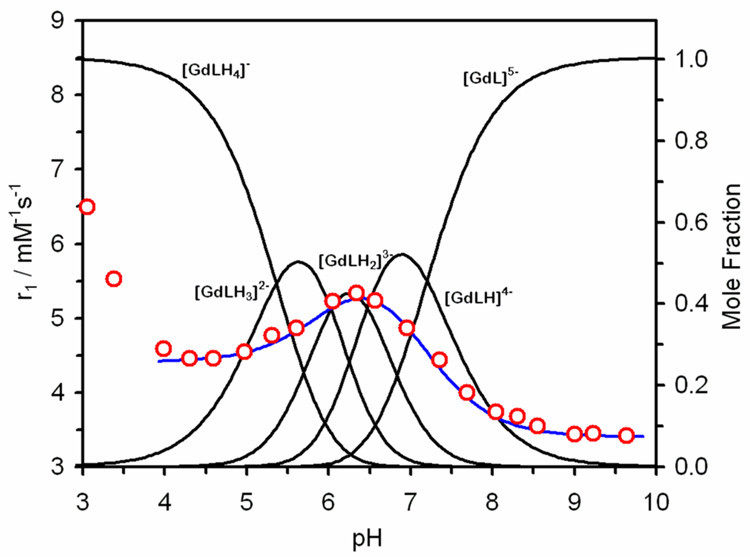
The pH dependent relaxivity curve of Gd1 is illustrated in Figure 3. These data were collected by starting with a 1 mM solution of the Type II complex prepared at pH 9, as described previously, adjusting the pH of the sample to ~2 by addition of hydrochloric acid, and, after each T1 measurement, the sample pH was raised by addition of small quantities of solid lithium hydroxide monohydrate. Lithium hydroxide was chosen for pH adjustment because the effect of the lithium ion on the complex was so small that it could not be detected by potentiometry (see below). The pH profile obtained this way retains many of the features of other pH profiles reported for simple tetraamide complexes.12,20 In particular, at low pH the relaxivity is high (8.5 mM−1s−1) but then falls off sharply as the pH is increased to pH 4.5 after which it begins to increase again (Figure 3). This is where the pH profile of Gd1 deviates from those of simpler tetraamide derivatives. Whereas the relaxivity of most other tetraamide derivatives minimizes around pH 3 and remains low up to pH ~9, the relaxivity of Gd1 rises from 4.4 mM−1s−1 at pH 4.5 and reaches a maximum of 5.3 mM−1s−1 at pH 6.3, then falls off again as the pH is raised above 6.3 until it reaches a minimum of 3.4 mM−1s−1 above pH 9.
Figure 3.
The effect of solution pH on the relaxivity of Gd1 (open circles), recorded at 25 °C and 20 MHz ([Gd1] = 1.0 mM). The effect of solution pH on the relaxivity of Gd1 in the presence of 135 mM NaCl, 5 mM KCl and 2.5 mM CaCl2 ([Gd1] = 1 mM) is also shown (filled diamonds). Profiles recorded at 15 °C and 35 °C are provided as supplementary material.
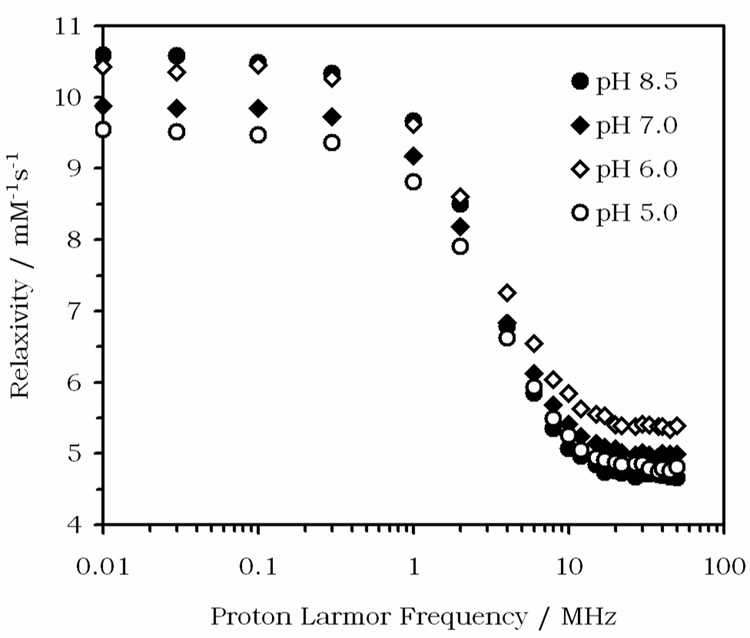
Although the pH profile shown in Figure 3 differs in the magnitude of the change in relaxivity from that originally reported for Gd1,13 it does retain the same broad characteristics. The accuracy of this new profile was independently verified by recording nuclear magnetic relaxation dispersion (NMRD) profiles of a different sample of carefully prepared Gd1 at three temperatures over the pH range 5 – 8.5 (Figure 4). The NMRD profiles recorded at 25°C show the same trend and relaxivity values with changing pH at 20 MHz as the pH profile reported in Figure 3. Furthermore, a profile corresponding to that previously published13 could be obtained by preparing a sample of Gd1 at a pH known to be too low to allow complete formation of the Type II complex. When the pH profile of a sample initially prepared at pH 4 was measured using a identical protocol as that described for Figure 3, the profile closely resembled the one previously reported.13 Presumably the Type I complex has a greater contribution to relaxation at the lower end of the pH scale. As the pH is increased, the complex is gradually converted into the Type II complex and thus the profiles display similar relaxivities by pH 9. It should be noted that the Type II complex was used to generate the in vivo maps of tissue pH using this compound as evidenced by the similarity of the pH dependent relaxivity curves published in those papers14–16 with those of Figure 3.
Figure 4.
Nuclear magnetic relaxation dispersion (NMRD) profiles for Gd1 at 25°C and pH 5 (open circles), pH 6 (open diamonds), pH 7 (closed diamonds) and pH 8.5 (closed circles). The pH for these experiments was maintained by using HEPES buffers.
Inspection of the NMRD profiles of Figure 4 provides further insights into this pH sensitive complex. The profiles display a general shape that is similar to other low molecular weight DOTA-type chelates of Gd3+. In the region of interest for imaging, i.e., above 10 MHz, the measured relaxivity can be affected by the hydration number (q), the water exchange rate (1/τM) and the rotational correlation time of the complex (τR).27–31 For typical low molecular weight chelates, rapid molecular reorientation largely determines the observed relaxivity. As molecular reorientation is slowed, the relaxivity near 20–30 MHz increases and this is typically seen in an NMRD profile as a characteristic high field “hump”.32,33 The absence of this “hump” in any of the NMRD profiles of Gd1 shows that the complex undergoes rapid molecular reorientation at all pH values. Thus, we may conclude that the pH responsive behaviour of Gd1 does not originate with changes in τR arising from pH dependent aggregation of the complex.33 Since q has also been shown to be pH independent in this complex (q = 1),13 the origin of the pH response at high fields must reflect changes in the water (or proton) exchange rate (1/τM) or changes in the second hydration sphere with changing pH.34 The relaxivity of this complex also displays a different temperature dependence at each pH value (discussed further below), a further indication that τM is the factor most influenced by changes in pH in this complex.
It is important to note that the rate of water molecule exchange as determined by variable temperature 17O NMR experiments on the Dy1 complex is unaffected by changes in pH.13 However, bulk water relaxation in this system does not require rapid molecular exchange when proton exchange would have the same effect on measured relaxivity values. This is indeed the case for Gd1. Given that the constitution of Gd1 is so important to the observed pH dependent relaxivity behaviour, and perhaps also the stability and safety of the complex, there is a clear need for a reliable assay of the products of the complexation reaction prior to use of this complex as a pH sensor. Since the electronic properties of gadolinium preclude the use of NMR for this purpose, an alternative technique was sought.
Potentiometric Studies
The protonation constants of the ligand 1 were determined by potentiometric titration, eight protonation steps were found in the pH range 1.7 – 12.5 (Table 1). Although the same number of protonation steps was observed in the presence of Me4N+ and K+, the protonation constants in KCl were significantly depressed relative to Me4NCl, especially K1H. This indicates that the K+ ion is not completely inert with respect to 1 and does in fact form a weak complex with the ligand.
Table 1.
The protonation constants of ligand 1 as determined by potentiometric titration at 25°C in either 1.0 M Me4NCl or KCl. The correlation coefficients of these determinations are examined in the Supplementary Information (S4).
| 1.0 M Me4NCl | 1.0 M KCl | |
|---|---|---|
| log K1H | 9.97 ± 0.03 | 8.78 ± 0.03 |
| log K2H | 7.84 ± 0.05 | 7.69 ± 0.03 |
| log K3H | 7.44 ± 0.04 | 7.21 ± 0.04 |
| log K4H | 7.01 ± 0.04 | 6.66 ± 0.04 |
| log K5H | 6.50 ± 0.04 | 6.17 ± 0.04 |
| log K6H | 5.91 ± 0.03 | 5.44 ± 0.04 |
| log K7H | 2.46 ± 0.04 | 2.17 ± 0.05 |
| log K8H | 1.92 ± 0.03 | 1.1 ± 0.1 |
When comparing these protonation constants with those of other DOTA-tetraamide derivatives,25,35 it is clear that the highest constant can be assigned to the first protonation of the cyclen ring. While the two highest protonation constants in systems such as these can typically be traced to macrocyclic nitrogen atoms,36–38 this system is less clear because at least four of the six highest protonation constants must correspond to four PO32− → PO3H− protonation steps, one on each of the four pendant arms.39 Thus, while the first six protonation steps can be assigned to two of the macrocylic amines and four phosphonates, the next two protonation steps are more difficult to assign. Only rarely is a third protonation step for the cyclen ring observed in this range25,35 and yet the log K values, 2.46 and 1.92, are in the range expected for further protonation of the macrocyclic ring. However, these two protonation constants are also in the range expected for a second phosphonate protonation step, PO3H− → PO3H239 so further studies will be necessary to delineate the exact microscopic sites of these final two protonation steps.
Further titrations of 1 were performed in the presence of variable amounts of Na+, K+ or Ca2+ in a constant ionic background of 1.0 M Me4NCl. The stabilities of complexes formed between these ions and 1 are summarized in Table 2. Although K+ forms the weakest complex of these three ions, its interaction with 1 is still significant. Among these three ions, Ca2+, not surprisingly, forms the most stable complex with 1, the magnitude of which is similar to that observed for other DOTA-tetraamide ligands.25,35 Unless a Type I complex is formed between Ca2+ and 1 that is particularly strong, a log KCaL value of 11.16 suggests that this reflects a Type II complex where the Ca2+ is bound by the macrocyclic ring as well as the amide oxygen atoms. This is supported by the observation that the pH was slow to stabilize after each addition of base, consistent with relatively slow formation kinetics of a Type II Ca1 complex since formation of a Type I complex would be expected to be rapid.
Table 2.
The thermodynamic stability constants of complexes formed between ligand 1 and sodium, potassium and calcium at 25°C in 1.0 M Me4NCl.
| Na+ | K+ | Ca2+ | |
|---|---|---|---|
| log KML | 3.72 ± 0.03 | 2.34 ± 0.09 | 11.16 ± 0.07 |
| log KMLH | 7.87 ± 0.06 | 8.86 ± 0.06 | 8.00 ± 0.07 |
| log KMLH2 | 7.77 ± 0.04 | – | 7.22 ± 0.07 |
| log KMLH3 | – | – | 6.70 ± 0.07 |
| log KMLH4 | – | – | 5.93 ± 0.04 |
| log KM2L | – | – | 2.76 ± 0.05 |
| log KM2LH | – | – | 7.60 ± 0.07 |
Although the coordination chemistry and size of the Ca2+ ion is similar to the lanthanide ions, potentiometric titrations of 1 in the presence of Gd3+ showed quite different behaviour from that of Ca2+. In this case, there was an initial rapid release of protons when Gd3+ was added to the ligand 1 under acidic conditions, presumably the result of release of phosphonate bound protons during formation of a Type I complex. We have already seen that the greater nuclear charge of the Gd3+ ion results in a strong interaction with the phosphonates under these conditions. Although the results of NMR and spectrophotometric experiments have shown that conversion to a Type II complex does occur as more base is added, this process is slow. Furthermore, as the Gd3+ ion drops into the ligand cage it ceases to bind to the phosphonate groups and these groups are then able to act as buffers to absorb protons released during movement of the Gd3+ ion into the macrocyclic ring. These two effects, in combination, explain why subsequent evolution of protons in the titration of 1 with Gd3+ was not observed. Since the release of protons from the macrocycle cannot be measured during this rearrangement, a stability constant for Gd1 cannot be determined by potentiometry alone. However, it is possible to approximate the stability constant for Gd1 by extrapolating from the value found for the Ca2+ system. In general, the log KGdL values for Gd3+ complexes in other DOTA-tetraamide systems are a factor of 1.3 – 1.4 greater than those measured for the corresponding Ca2+ complexes,25,35 so one can estimate with some confidence that the value of log KGdL for Gd1 lies between 14.2 and 15.6 based upon the log KCaL value measured here for Ca1 (Table 2). Given that pH changes are detected during formation of Ca1, this also lends support to the idea that Ca2+ does not form the same stable Type I complex with 1 as do the lanthanide ions.
The protonation constants of a sample of Gd1, prepared at pH 9 such that only the Type II complex was present, were also determined by potentiometric titration. The values of these protonation constants (Table 3) are in the same range as those determined by titration of the ligand alone. If the phosphonate groups of the ligand pendant arms are able to participate in metal ion binding, resulting in an unusually stable Type I complex with lanthanide ions, then the question of their involvement in metal binding once the complex with Gd3+ has been formed should also be addressed. Accordingly, potentiometric titrations of the Type II complex of Gd1 were performed also in the presence of Ca2+, Cu2+ and Zn2+. Each of these metal ions was found to form a Gd1·M complex with log KGdLM values ranging from 1.87 to 5.39 (Table 4). Although Ca2+ forms the weakest ternary complex of the three metal ions studied, the potential for interference by calcium is perhaps greatest because it is present in much higher concentrations in vivo than either Cu2+ or Zn2+. Although the total concentration of Zn2+ and Cu2+ in vivo are ≈16 µM and ≈18 µM, respectively, the concentrations of these ions available for exchange are even lower, [Zn2+] ≈ 10 µM, [Cu2+] ≈ 1.0 µM.40 In contrast the concentration of calcium in vivo can be as high as 2.5 mM.40 Binding of zinc or copper by Gd1 is unlikely to have any significant effect on the pH dependent relaxivity curve but the effect of calcium binding on a typical MRI contrast agent dose of 0.1 – 0.3 mmol kg−1 could be more severe. There are also significant concentrations of sodium and potassium ions present in vivo, however, in light of the small binding constant found for Ca2+ (Table 4) and given that the binding constants of Na+ and K+ with the free ligand were so much weaker than that of Ca2+, the formation of GdL·M complexes with these ions were not studied by potentiometry.
Table 3.
The protonation constants of the Type II complex of Gd1, 25°C,1.0 M KCl. The correlation coefficients of these determinations are examined in the Supplementary Information (S4).
| pKa | |
|---|---|
| log KGdLH1 | 7.20 ± 0.01 |
| log KGdLH2 | 6.47 ± 0.01 |
| log KGdLH3 | 6.03 ± 0.01 |
| log KGdLH4 | 5.36 ± 0.01 |
Table 4.
Stability constants (log KGdLM) and protonation constants (log KGdMLH) for the ternary complexes of Gd1 (25°C, 1.0M KCl).
| Equilibrium | M = Ca2+ | M = Zn2+ | M = Cu2+ |
|---|---|---|---|
| log KGdLM | 1.87 ± 0.04 | 5.28 ± 0.05 | 5.39 ± 0.04 |
| log KGdLMH | 6.94 ± 0.05 | 6.98 ± 0.02 | 6.18 ± 0.04 |
The effect of metal ions on relaxivity and the origins of the pH response
To assess whether Ca2+ or other endogenous metal ions might have an effect on the relaxivity of Gd1, the pH relaxivity profile was recorded in solutions that simulate the levels of these ions in vivo (135 mM NaCl, 5 mM KCl and 2.5 mM CaCl2). The relaxivity profile measured in the presence of these ions was similar to that obtained in the absence of these cations (Figure 3). The primary difference between the two profiles is a small shift in the relaxivity maxima from pH 6.3 to pH 6.0 in the presence of endogenous metal ions. This is presumably the result of a small reduction in the protonation constants of Gd1 resulting from the presence of the metal ions (compare the first protonation constants of Gd1 (7.20, Table 3) versus Gd1•Ca2+ (6.94, Table 4)). The concomitant shift in the relaxivity maxima and change in phosphonate group protonation constants indicates that the phosphonate groups are indeed responsible for the pH sensitive relaxivity of this complex. Thus, although it may be important to account for the effect of endogenous metal ions when using Gd1 to determine pH, the presence of these metal ions does not diminish the utility of Gd1 as a pH sensor in vivo.
The involvement of the phosphonate pendant arms in defining the relaxivity of Gd1 is further supported by the potentiometric data. From the protonation constants reported in the previous section, it is possible to generate a speciation diagram of the different protonation states of Gd1. When this speciation diagram is plotted on the same axis as the pH dependent relaxivity profile of Gd1, the significance of protonation of the phosphonate groups becomes immediately apparent (Figure 5). The relaxivity maximum at pH 6.3 is exactly coincidental with the maximum concentration of the diprotonated complex, GdLH23−, suggesting that it is this species that has the maximal effect on the measured relaxivity. A multiple regression fitting of these data to Eqn. 1 was performed to estimate the relaxivity of each protonated species and thus the contribution of each species to the observed relaxivity. For this analysis, it was assumed that the fully deprotonated species, GdL, the only species present above pH 9.5, represents the outer sphere contribution to the relaxivity at each pH value. With this assumption, r1is could be simplified to Eqn. 2. Statistically significant (α = 0.05) relaxivity values for each species were found with a regression coefficient (<r1os>2) of 0.96 (Table 5). The significance of protonation state of the phosphonates to the relaxivity of each species is immediately apparent. The highest relaxivities are observed for those species that contain a mixture of mono and unprotonated phosphonates, and the highest relaxivity is observed when these are balanced, i.e. for GdLH23−.
| (1) |
| (2) |
Figure 5.
The longitudinal relaxivity pH profile of Gd1 (25 °C, 20 MHz) (red circles) laid-over the speciation diagram of Gd1. The blue line is the overall relaxivity of the system calculated from the relaxivity of each species (Table 5) as determined by the regression analysis.
Table 5.
The calculated water relaxivities of each protonated Gd1 species (calculated from the data of Figure 5).
| Species | r1 / mM−1s−1 |
|---|---|
| GdL5− | 3.4 |
| GdLH4− | 5.50 ± 0.11 |
| GdLH23− | 5.57 ± 0.17 |
| GdLH32− | 4.77 ± 0.18 |
| GdLH4− | 4.42 ± 0.11 |
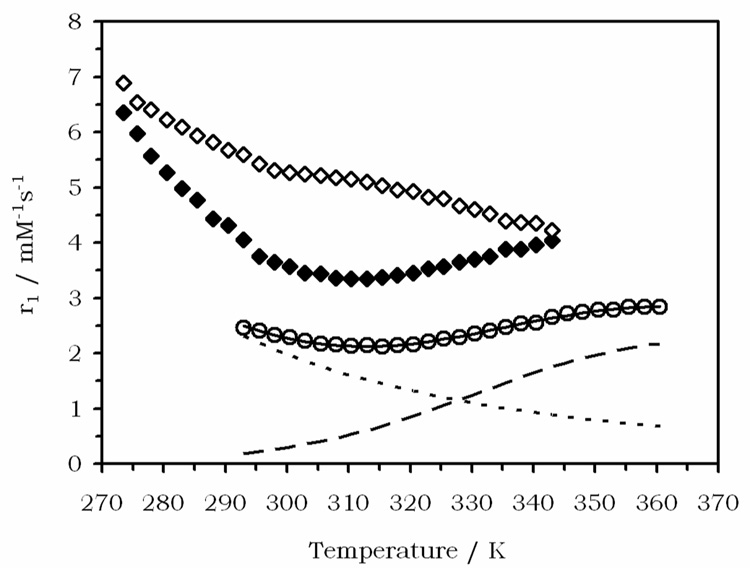
To investigate this further, variable temperature relaxivity (20 MHz) measurements of Gd1 were carried out at pH 6.2 (near the relaxivity peak at 25 °C) and at pH 8.3 (near the relaxivity minimum at 25 °C). These data are shown in Figure 6, along with previously published data for Gd2.41 There are three contributors to relaxivity: the contribution from an exchangeable inner-sphere water (r1is), the contribution from long lived (ps – ns) waters/protons in the second sphere (r1ss), and outer-sphere relaxation determined by the distance of closest approach and the water diffusion rate (r1os). Outer- and second-sphere relaxivity will always increase inversely with temperature; the correlation times for these processes are so short that the fast exchange condition is always met. For gadolinium complexes of the size of Gd1, the T1 of the coordinated water protons (T1M) is on the order of 1 – 10 µs. Lanthanide complexes of DOTA-tetraamide complexes have very slow inner-sphere water exchange rates with water residency times on the order of microseconds.12, 20, 41 The relaxivity of the GdDOTA-tetraamide complexes can therefore span the slow to intermediate to fast exchange regime over the liquid water temperature range. The result is that relaxivity first increases with temperature (slow exchange, τM > T1M) and then decreases (fast exchange, T1M > τM).
Figure 6.
The temperature dependence of the relaxivity of Gd1 at pH 6.2 (open diamonds) and pH 8.3 (closed diamonds). The temperature dependence of the relaxivity of Gd2 is shown for comparison (open circles), the calculated relaxivity (solid line), the outer-sphere contribution (dotted line) and the inner-sphere contribution (dashed line) are also shown.
Qualitatively the data in Figure 6 are quite revealing. The sample at pH 8.3 has high relaxivity at low temperature that decreases as temperature is increased until about 310 K when the relaxivity starts to increase. This is consistent with relaxivity dominated by outer-and second-sphere mechanisms at low temperatures, but with little contribution from the slow exchanging inner-sphere water protons. As temperature increases, these inner-sphere protons exchange more rapidly and contribute significantly to relaxivity. Going higher in temperature, one would expect relaxivity to peak and then decline as the inner-sphere exchangeable protons move out of the slow exchange regime. This behaviour has been observed in other systems, notably Gd2 (Figure 6). The temperature dependence of the sample at pH 6.2 is quite different in that the relaxivity always decreases with temperature, although this decline is not mono-exponential and there is a plateau of sorts between 300 – 320 K. One explanation for change in the temperature profile is more rapid exchange of the inner-sphere water protons at pH 6.2, moving the system out of slow exchange at a lower temperature. Another possibility is an increase in the 2nd sphere relaxivity of the complex due to phosphonate protons with long residence lifetimes at this lower pH.
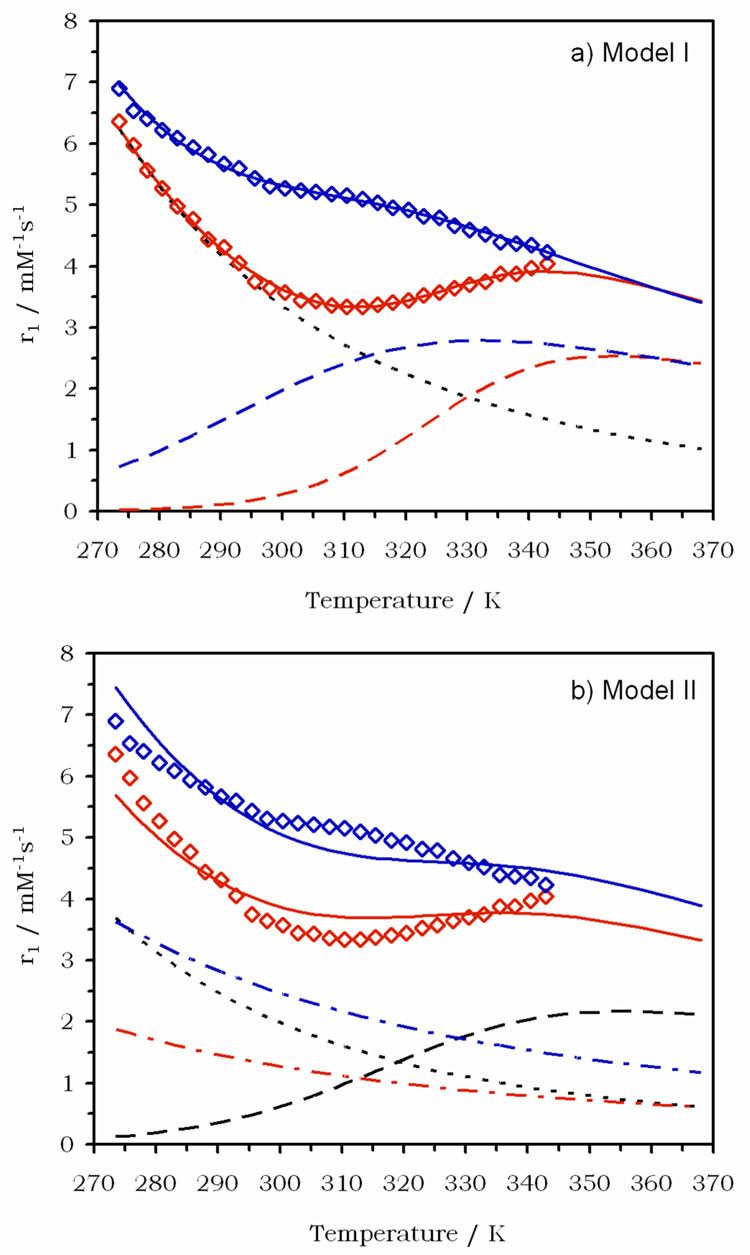
Comparing the relaxivity of Gd1 at low temperatures with that of Gd2 it is clear that a significant 2nd-sphere effect contributes to the relaxivity of Gd1. A similar second sphere contribution has been observed with other gadolinium-phosphonate complexes in which the phosphonate groups is bound directly to gadolinium.42–44 This second-sphere effect complicates any attempts to analyze the data in a quantitative sense and, given the complex speciation of Gd1 in solution (Figure 5), an unambiguous analysis of the data is impossible. Nevertheless, it was found to be instructive to model the temperature dependence of Gd1 to two simple models, each looking at a mechanistic extreme. In both models, it was assumed that only one species is present at each pH. Model I took the assumption that the outer- and second-sphere contributions to relaxivity at a given temperature were the same regardless of pH and that their sum (r1os + r1ss) followed an exponential dependence with temperature. It was also assumed that the correlation time for inner-sphere relaxation is the same at both pH values, i.e. that rotational diffusion and electronic relaxation do not change with pH, and that this correlation time has an exponential dependence with temperature. Model I tests whether the differences in r1 versus temperature for the two pH samples can be explained solely by a change in the exchange rate of the inner-sphere protons. The best fit of Model I to the experimental data obtained for Gd1 is shown in Figure 7a (model details and parameters can be found in supporting information). Also shown are the contributions from second- and outer-sphere relaxivity and the inner-sphere contributions at both pH values. From Figure 7a is can clearly be seen that this simple model explains the data well and supports the hypothesis that relaxivity differences are a result of different inner-sphere proton exchange rates.
Figure 7.
Fitting the temperature dependence of the relaxivity of Gd1 at pH 6.2 (blue) and pH 8.3 (red) to: a) a model that fixes the outer and second sphere contributions (dotted black line) and fits the data to changes in the inner sphere relaxivity (dashed lines). The fits are shown as solid lines. b) a model that assumes no change in inner-sphere relaxivity (dashed black line) and accounts for difference in relaxivity through changes in the second sphere contribution (dot-dash lines). The outer-sphere contribution (dotted black line) and fits (solid lines are also shown.
Model II takes the other extreme and assumes that the inner-sphere proton exchange rate is the same at both pH values. In this model, it was assumed that the outer-sphere relaxivity of Gd1 is the same at both pH values and is identical to that determined for Gd2. Model II considers a separate second-sphere component to relaxivity that is different at the two pH values. Model II tests whether the differences in r1 versus temperature for the Gd1 at two different pH values can be explained solely by second-sphere effects. The best fit to the data using Model II is shown in Figure 7b and clearly does not explain the data well. The only way to reproduce the "bulge" in the pH 6.2 data and the high temperature increase in the pH 8.3 data is with different inner-sphere proton exchange rates.
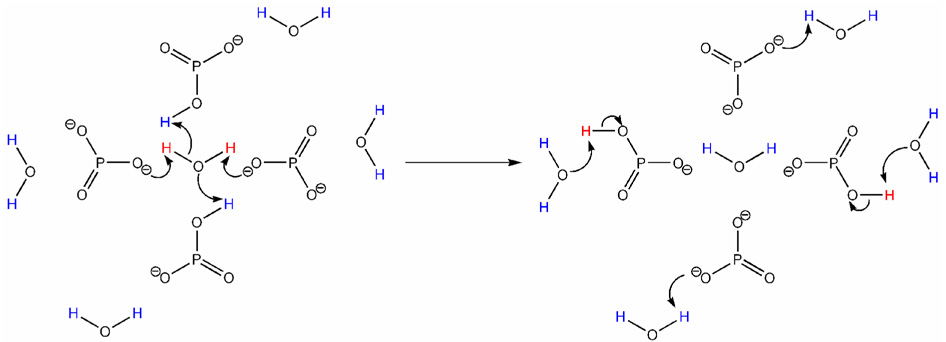
Since it is certain that Gd1 does have a second-sphere contribution to relaxivity the reality of the situation probably lies somewhere between these two models. However, it appears probable that inner-sphere water proton exchange is significantly faster at pH 6.2 than at pH 8.3. The rate of whole water exchange in Dy1 was found to be unaffected by changes in pH,13 thus it must be the rate of prototropic exchange in Gd1 that is altered by pH. Presumably GdLH23−, the predominant species in solution at pH 6.2, exhibits more rapid prototopic exchange of the coordinated water protons with those of the bulk solvent than do the other protonated states of the complex. The phosphonates in the GdLH23− species, two of which are completely deprotonated and two of which are monoprotonated, must be responsible for this rapid prototropic exchange. One can envision a situation in which the two deprotonated phosphonates located trans to one another in the complex are close enough to the coordinated water molecule to act as general bases for deprotonating the Gd3+-bound water molecule. The mono-protonated phosphonates then act as acids, simultaneously contributing protons to the coordinated water molecule as illustrated in Figure 8. The relaxed protons, once transferred from the water molecule to the phosphonate groups, may then be exchanged with protons in the bulk solvent resulting in transfer of the relaxation of the bulk solvent. In this scenario, the presence of two base and two acid equivalents, in a trans orientation, would be expected to be the most efficient configuration for promoting this proton exchange reaction. Thus, it is not surprising that the complex GdLH23− exhibits the highest relaxivity of all protonation species. The protonated forms, GdLH4− and GdLH32−, also exhibit high relaxivities because, while not as well balanced in terms of acidic and basic phosphonates as in GdLH23−, they are still both able to catalyze prototropic exchange through a mixture of acids and bases. Once the phosphonates are unable to supply either acidic or basic groups, catalysis by prototropic exchange ceases and relaxivity drops off to values similar to that observed for other DOTA-tetraamide derivatives.
Figure 8.
A schematic representation, viewed down the Gd-OH2 axis, of how the phosphonates in GdLH23− transfer protons between the coordinated water molecule and the bulk solvent. The relaxed protons of the coordinated water molecule (shown in red) are removed from the water molecule by the deprotonated phosphonates which act as bases. They are then replaced by unrelaxed protons from the bulk water (shown in blue) which are supplied by the monoprotonated phosphonates which are acting as acids.
Conclusions
Gd1 changes relaxivity over a pH range that is near ideal for measuring pH in vivo.14–16 Care must be taken when preparing samples of Gd1 because the ligand can form distinctly different complexes with Gd3+, the complex formed being strongly influenced by the initial pH at which the complexation reaction is run. The current study shows that the complexation reaction should be run at a pH no lower than 9 to produce only the desired pH sensitive, Type II product needed for imaging pH by MRI. A Type I complex formed under more acidic conditions has a higher relaxivity at lower pH values than the Type II complex so even small amounts of this product can affect the calibration curve needed for quantifying tissue pH. Other adventitious metal ions present in biological samples do bind with Gd1 to form GdL•M ternary complexes. Ca2+ offers the greatest potential for interference because the relaxivity versus pH curve is altered somewhat in the presence of this ion, although calibration curves run in the presence of Ca2+ should easily account for these differences. Potentiometric and relaxometric data for Gd1 at different pH values show that it is the phosphonates of the pendant arms that gives the complex its unique pH responsive behaviour. When the phosphonate groups of one complex are able to act in concert as acids and bases, catalysis of prototropic exchange results leads to an enhanced relaxivity over a pH range that is useful for biological pH imaging.
Experimental Section
General
1H NMR spectra were recorded on a JOEL Eclipse 270 spectrometer operating at 270.17 MHz, a Varian Mercury 300 spectrometer operating at 299.95 MHz and a Varian Inova 500 spectrometer operating at 499.95 MHz. 31P NMR spectra were recorded on a Varian Mercury 300 spectrometer operating at 121.47 MHz. Longitudinal relaxation times were measured using the inversion recovery method on a MRS-6 NMR analyzer from the Institut “Jožef Stefan”, Ljubljana, Slovenjia operating at 20 MHz. Relaxivity was determined by linear regression analysis of relaxation rates of six solutions (0.5 – 10 mM). The pH of samples for relaxivity measurements were adjusted by addition of either lithium hydroxide monohydrate or p-toluenesulfonic acid monohydrate in order to avoid dilution.
Synthesis
Diethyl phthalimidomethylphosphonate (3)17
Triethylphosphite (40.53 g, 243.9 mmol) and N-bromomethylphthalimide (48.8 g, 203.3 mmol) were heated, neat, to 90 °C for 3 hours. A distillation apparatus was then fitted and the reaction temperature increased to 105 °C until no more distillate was produced. The reaction was allowed to cool to room temperature and the residue dissolved in diethyl ether (300 mL). Hexanes (600 mL) were added and the resulting solution cooled to −20 C and the product allowed to crystallize. The crystals were recovered by filtration and dried under vacuum to afford the title compound as a colourless solid (59.7 g, 99 %).
mp = 63.5–64 °C; 1H NMR (300 MHz, CDCl3) δ 7.84 (2H, dd, 3JH-H = 6 Hz, 4JH-H = 3 Hz, Ar), 7.71 (2H, dd, 3JH-H = 6 Hz, 4JH-H = 3 Hz, Ar), 4.18 (4H, q, , 3JH-H = 7 Hz, CH2CH3), 4.07 (2H, d, , 2JH-P = 11 Hz, NCH2P), 1.30 (6H, t, 3JH-H = 7 Hz, CH2CH3); 13C NMR (300 MHz, CDCl3) δ 167.1 (C=O), 134.4 (Ar), 132.2 (Ar-CO), 123.7(Ar), 63.0 (d, 2JC–P = 6 Hz, OCH2), 33.5 (d, 1JC–P = 157 Hz, NCH2P), 16.5 (d, 3JC–P = 6 Hz, OCH2CH3); νmax / cm−1 (ATR) 2984, 2930, 1774 (C=O), 1716 (C=O), 1467, 1401, 1381, 1306, 1243, 1050, 1018, 968, 899, 718; m/z (ESMS, ES+) 242 (100%, [(M-2Et)+3H]+), 270 (25%, [(M-Et)+2H]+), 298 (21%, [M+H]+), 320 (24%, [M+Na]+); Anal. Found C = 52.5 %, H = 5.8 %, N = 4.6 %, C13H16NO5P·requires C = 52.5 % H = 5.4 % N = 4.7 %.
Diethyl aminomethylphosphonate (4)17, 18
Hydrazine (2.1 mL, 60 mmol) was added to a solution of the phthalimide 3 (16.05 g, 50 mmol) in absolute ethanol (200 mL). The reaction was stirred at room temperature overnight before being heated at reflux for 3 hours. The reaction mixture was then cooled to room temperature and then placed in the refrigerator for several hours. The precipitate that formed was collected by suction filtration and washed with CH2Cl2. The solvents were then removed under reduced pressure and the residue purified by column chromatography over silica gel eluting with MeOH:Et2O (1:2) to afford the title compound as a colourless oil (6.11 g, 73%).
Rf = 0.3 (1:2, MeOH:Et2O, SiO2); 1H NMR (300 MHz, CD3CN) δ 4.01 (2H, q, 3JH-H = 7 Hz, OCH2CH3), 3.98 (2H, q, 3JH-H = 7 Hz, OCH2CH3), 2.87 (2H, d, 2JH-P = 11 Hz, NCH2P), 2.28 (2H, s br, NH2), 1.21 (6H, t, 3JH-H = 7 Hz, CH2CH3); 13C NMR (300 MHz, CD3CN) δ 62.1 (d, 2JC-P = 7 Hz, OCH2), 37.2 (d, 1JC-P = 151 Hz, NCH2P), 16.2 (d, 3JC-P = 6 Hz, OCH2CH3); νmax / cm−1 (ATR) 3383 (NH), 3297 (NH), 2980, 2930, 2907, 1662 (NH), 1392, 1228, 1163, 1050, 1021, 960; m/z (ESMS, ES+) 139 (100%, [(M-Et)+2H]+), 168 (66%, [M+H]+)
Diethyl bromoacetamidomethylphosphonate (5)
The amine 4 (7.0 g, 42.0 mmol) was added dropwise to a mixture of bromoacetyl bromide (3.7 mL, 42.0 mmol) and potassium carbonate (7.0 g, 51.0 mmol) in benzene (50 mL), cooled to 0 °C in an ice bath, over 30 minutes. The reaction was allowed to warm to room temperature and then stirred for 18 h. The reaction mixture was filtered and the solvents removed under reduced pressure. The residue was purified by column chromatography over silica gel eluting with 10% MeOH in Et2O. The title compound was obtained as a colourless solid (9.6 g, 79 %).
Rf = 0.5 (10% MeOH in Et2O , SiO2); mp = 85–86.5 °C; 1H NMR (270 MHz, CDCl3) δ 7.46 (1H, s br, NH), 4.13 (2H, q, 3JH-H = 7 Hz, OCH2CH3), 4.10 (2H, q, 3JH-H = 7 Hz, OCH2CH3), 3.87 (2H, s, BrCH2CO), 3.70 (2H, dd, 3JH-H = 6 Hz, 2JH-P = 12 Hz, NCH2P), 1.31 (6H, t, 3JH-H = 7 Hz, CH2CH3); 13C NMR (270 MHz, CDCl3) δ 166.1 (d, 3JC-P = 6 Hz, C=O), 62.9 (d 2JC-P = 6 Hz, OCH2), 35.4 (d, 1JC-P = 157 Hz, NCH2P) 28.5 (BrCH2CO), 16.4 (d, 3JC-P = 6 Hz, OCH2CH3); νmax / cm−1 (ATR) 3254 (NH), 3058 (NH), 2983, 1669 (C=O), 1557, 1394, 1207, 1021, 979, 830; m/z (ESMS, ES-) 288 (100%, [M-H]−), the appropriate isotope pattern was observed; Anal. Found C = 29.6 %, H = 5.5 %, N = 4.8 %, C7H15BrNO4P·requires C = 29.2 % H = 5.3 % N = 4.9 %.
1,4,7,10-Tetraazacyclododecane-1,4,7,10- tetraacetamidomethylene-(diethyl)phosphonate (6)
Cyclen (0.43 g, 2.5 mmol) was dissolved in acetonitrile (10 mL). Potassium carbonate (1.5 g, 11.0 mmol) and the bromoacetamide 5 (2.88 g, 10.0 mmol) were added and the reaction mixture stirred for 6 h at 60 °C. The reaction mixture was filtered and the solvents removed under reduced pressure. The residue was taken up into chloroform and heated under reflux for 30 minutes. A precipitate formed that was isolated by filtration. The solids were dried under vacuum to afford the title compound as pale yellow solid (1.52 g, 61 %).
mp = 150–150.5 °C; 1H NMR (270 MHz, CDCl3) δ 7.67 (4H, s br, CONH), 3.87 (8H, q, 3JH-H = 7 Hz, OCH2CH3), 3.84 (8H, q, 3JH-H = 7 Hz, OCH2CH3), 3.46 (8H, dd, 3JH-H = 5 Hz, 2JH-P = 11 Hz, NCH2P), 2.92 (8H, s, NCH2CO), 2.49 (16H, s, ring CH2), 1.05 (24H, t, 3JH-H = 7 Hz, CH2CH3); 13C NMR (270 MHz, CDCl3) δ 170.9 (C=O), 62.3 (OCH2), 58.9 (NCH2CO), 53.8 (ring CH2), 34.2 (d, 1JC-P = 157 Hz, NCH2P), 16.3 (OCH2CH3); 31P NMR (300 MHz, D2O) δ 25.65; νmax / cm−1 (ATR) 3270 (NH), 2982, 2826, 1670 (C=O), 1540, 1226. 1050, 1023, 975; m/z (ESMS, ES+) 1002 (63%, [M+H]+), 1024 (100%, [M+Na]+); Anal. Found C = 41.6 %, H = 7.1 %, N = 10.7 %, C36H76N8O16P4·0.5HBr requires C = 41.5 % H = 7.4 % N = 10.8 %.
1,4,7,10-Tetraazacyclododecane-1,4,7,10- tetraacetamidomethylene phosphonic acid dihydrobromide (1)
The octaethyl ester 6 (0.8 g, 0.8 mmol) was dissolved in a 30% solution of HBr in acetic acid (8 mL). The resulting solution was stirred at RT for 18 h. The solvents were removed under reduced pressure and the residue taken up in EtOH (5 mL) the solvents were again removed under reduced pressure. The solid residue was then taken up into MeOH (5 mL) and the title compound precipitated by drop-wise addition of Et2O. The resulting precipitate was isolated, dissolved in water and freeze dried to afford a colourless solid (0.53 g, 86 %).
mp = 247 °C, decomposes; 1H NMR (300 MHz, D2O) δ 3.67 (8H, s br, NCH2CO), 3.47 (8H, d, 2JH-P = 12 Hz, NCH2P), 3.17 (16H, s br, ring CH2); 13C NMR (270 MHz, D2O) δ 170.7 (br, C=O), 55.0 (NCH2CO), 50.0 (br, ring CH2), 36.7 (d, 1JC-P = 150 Hz, NCH2P); νmax / cm−1 (ATR) 3235 (NH), 3070 (NH), 2966, 2860, 1672 (C=O), 1556, 1555, 1392, 1300, 1186, 1151, 1083, 990, 918; m/z (ESMS, ESI+) 478 (100%, [Na8L+2H]2+); Anal. Found C = 23.1 %, H = 5.7 %, N = 10.8 % C20H44N8O16P4·2.2HBr·4.6H2O requires C = 23.2 %, H = 5.4 %, N = 10.8 %
Potentiometric Titrations
Materials
Stock solutions of CaCl2, ZnCl2, CuCl2, and GdCl3 were prepared from analytical-grade salts (Aldrich and Sigma, 99.9%), all other solutions were prepared from the highest analytical grade materials commercially available, using HPLC grade water (Omni Solv). The concentrations of the stock solutions were determined by complexometric titration using a standardized Na2H2EDTA solution in the presence of calconcarboxylic acid (CaCl2), eriochrome black-T (ZnCl2), murexide (CuCl2), and xylenol orange (LnCl3) as an indicator. A stock solution of the ligand was prepared, and the ligand concentration was determined by pH potentiometry on the basis of the titration curves obtained in the absence and presence of excess CaCl2. Aliquots from the stock solution of 1 were diluted into 1.0 M solutions of Me4NCl and KCl and the pH adjusted to ~1.7 with HCl. These solutions were titrated with 0.2173M Me4NOH (Me4NCl) or 0.1679M KOH (KCl) to a final pH of ~12.5.
Measurements made using KCl for ionic strength
The potentiometric measurements were carried out with an automatic titration system. The pH was measured in each titration with a Ross semi-micro combination electrode (Orion) combined with a Thermo Orion IonAnalyzer EA 940. The samples were titrated using a model 665 Metrohm Dosimat autoburet. All potentiometric titrations were conducted under an argon atmosphere and the cell was maintained at a constant 25 ± 0.1 °C by using a circulating water bath. The titrated solutions (10 mL) were stirred. The electrode was calibrated by KH-phtalate (pH 4.005) and Na-tetraborate (pH 9.180) (Alfa Aesar). Titrations of each sample were performed over the pH range 1.7–12.5, the concentrations of the 1 and the Gd1 were 0.002 M in the samples and 1 M KCl was used to maintain the ionic strength. Hydrogen ion concentrations were calculated from the measured pH values using the method proposed by Irving et. al.45 The value of pKw used at I = 1.0 (KCl) was 13.81 which was determined experimentally under similar conditions to that used for the titrations.
Measurements made using Me4NCl for ionic strength were similar to that described previously except that the titrations were performed with a Radiometer PHM93 pH-meter, an ABU 80 autoburet, and Metrohm 6.0234.100 combined electrode and the volume of the titrated solutions were 5 mL. The value of the pKw at I = 1.0 (Me4NCl) was determined experimentally and found to be 14.06. Protonation constants were calculated from the potentiometric titrations curves using the program PSEQUAD.46
Supplementary Material
Electronic Supplementary Information. A comparison of the relaxivity profile recorded in this work and that previously recorded; NMRD profiles recorded at 15, 25 and 35 °C, the parameters and details used in Models I and II, an examination of the correlation coefficients of the protonation constant determinations of 1 and Gd1.
Acknowledgements
The authors thank the National Institutes of Health (EB-04285, MW) and (CA-115531 and RR-02584, ADS), the EMIL Project funded by the EC FP6 Framework Program (FKK, RK and EB) and the Robert A. Welch Foundation (AT-584) for financial support of this work.
References
- 1.Sennoune Souad R, Luo D, Martinez-Zaguilan R. Cell Biochem. Biophys. 2004;40:185. doi: 10.1385/CBB:40:2:185. [DOI] [PubMed] [Google Scholar]
- 2.Tannock IF, Rotin D. Cancer Res. 1989;49:4373. [PubMed] [Google Scholar]
- 3.Vaupel P, Kallinowski F, Okunieff P. Cancer Res. 1989;49:6449. [PubMed] [Google Scholar]
- 4.Wike-Hooley JL, Haveman J, Reinhold JS. Radioter. Oncol. 1984;2:343. doi: 10.1016/s0167-8140(84)80077-8. [DOI] [PubMed] [Google Scholar]
- 5.Caravan P, Ellison JJ, McMurry TJ, Lauffer RB. Chem. Rev. 1999;99:2293. doi: 10.1021/cr980440x. [DOI] [PubMed] [Google Scholar]
- 6.Lauffer RB. Chem. Rev. 1987;87:901. [Google Scholar]
- 7.Messeri D, Lowe MP, Parker D, Botta M. Chem. Commun. 2001:2742. [Google Scholar]
- 8.Woods M, Zhang S, Kovacs Z, Sherry AD. Adv. Supramol. Chem. 2003;9:1. [Google Scholar]
- 9.Aime S, Barge A, Botta M, Howard JAK, Kataky R, Lowe MP, Moloney JM, Parker D, de Sousa AS. Chem. Commun. 1999:1047. [Google Scholar]
- 10.Hovland R, Glogard C, Aasen AJ, Klaveness J. J. Chem. Soc., Perkin Trans. 2. 2001:929. [Google Scholar]
- 11.Lowe MP, Parker D. Chem. Commun. 2000:707. [Google Scholar]
- 12.Woods M, Zhang S, Von Howard E, Sherry AD. Chem. Eur. J. 2003;9:4634. doi: 10.1002/chem.200305159. [DOI] [PubMed] [Google Scholar]
- 13.Zhang S, Wu K, Sherry AD. Angew. Chem., Int. Ed. 1999;38:3192. [PubMed] [Google Scholar]
- 14.Raghunand N, Howison C, Sherry AD, Zhang S, Gillies RJ. Magn. Reson. Med. 2003;49:249. doi: 10.1002/mrm.10347. [DOI] [PubMed] [Google Scholar]
- 15.Garcia-Martin ML, Martinez GV, Raghunand N, Sherry AD, Zhang S, Gillies RJ. Magn. Reson. Med. 2006;55:309. doi: 10.1002/mrm.20773. [DOI] [PubMed] [Google Scholar]
- 16.Raghunand N, Zhang S, Sherry AD, Gillies Robert J. Acad. Radiol. 2002;9 Suppl 2:S481. doi: 10.1016/s1076-6332(03)80270-2. [DOI] [PubMed] [Google Scholar]
- 17.Yamauchi K, Imoto M, Kinoshit M. Bull. Chem. Soc. Jpn. 1972;45:2531. [Google Scholar]
- 18.Yamauchi K, Mitsuda Y, Kinoshita M. Bull. Chem. Soc. Jpn. 1975;48:3285. [Google Scholar]
- 19.Woods M, Sherry AD. Inorg. Chem. 2003;42:4401. doi: 10.1021/ic0300823. [DOI] [PubMed] [Google Scholar]
- 20.Aime S, Barge A, Bruce JI, Botta M, Howard JAK, Moloney JM, Parker D, de Sousa AS, Woods M. J. Am. Chem. Soc. 1999;121:5762. [Google Scholar]
- 21.Komiyama M, Takeda N, Shigekawa H. Chem. Commun. 1999:1443. [Google Scholar]
- 22.Di Bari L, Pescitelli G, Sherry AD, Woods M. Inorg. Chem. 2005;44:8391. doi: 10.1021/ic0511118. [DOI] [PMC free article] [PubMed] [Google Scholar]
- 23.Dickins RS, Parker D, Bruce JI, Tozer DJ. Dalton Trans. 2003:1264. [Google Scholar]
- 24.Toth E, Brucher E, Lazar I, Toth I. Inorg. Chem. 1994;33:4070. [Google Scholar]
- 25.Baranyai Z, Bruecher E, Ivanyi T, Kiraly R, Lazar I, Zekany L. Helv. Chim. Acta. 2005;88:604. [Google Scholar]
- 26.Stenson PA, Thompson AL, Parker D. Dalton Trans. 2006:3291. doi: 10.1039/b605876k. [DOI] [PubMed] [Google Scholar]
- 27.Bloembergen N. J. Chem. Phys. 1957;27:572. [Google Scholar]
- 28.Bloembergen N, Morgan LO. J. Chem. Phys. 1961;34:842. [Google Scholar]
- 29.Bloembergen N, Purcell EM, Pound RV. Phys. Rev. 1948;73:679. [Google Scholar]
- 30.Solomon I. Phys. Rev. 1955;99:559. [Google Scholar]
- 31.Solomon I, Bloembergen N. J. Chem. Phys. 1956;25:261. [Google Scholar]
- 32.Aime S, Fasano M, Terreno E. Chem. Soc. Rev. 1998;27:19. [Google Scholar]
- 33.Caravan P, Cloutier NJ, Greenfield MT, McDermid SA, Dunham SU, Bulte JWM, Amedio JC, Jr, Looby RJ, Supkowski RM, Horrocks WD, Jr, McMurry TJ, Lauffer RB. J. Am. Chem. Soc. 2002;124:3152. doi: 10.1021/ja017168k. [DOI] [PubMed] [Google Scholar]
- 34.Botta M. Eur. J. Inorg. Chem. 2000:399. [Google Scholar]
- 35.Pasha A, Tircsó G, Brücher E, Sherry AD. Unpublished Data. 2006 [Google Scholar]
- 36.Andre JP, Bruecher E, Kiraly R, Carvalho RA, Maecke H, Geraldes CFGC. Helv. Chim. Acta. 2005;88:633. [Google Scholar]
- 37.Burai L, Fabian I, Kiraly R, Szilagyi E, Brucher E. J. Chem. Soc., Dalton Trans. 1998:243. [Google Scholar]
- 38.Kumar K, Jin TZ, Wang XY, Desreux JF, Tweedle MF. Inorg. Chem. 1994;33:3823. [Google Scholar]
- 39.Popov K, Rónkkömäk H, Lajunen LJ. Pure Appl. Chem. 2001;73:1641–1677. [Google Scholar]
- 40.May PM, Linder PW, Williams DR. J. Chem. Soc., Dalton Trans. 1977:588. [Google Scholar]
- 41.Zhang S, Wu K, Biewer MC, Sherry AD. Inorg. Chem. 2001;40:4284. doi: 10.1021/ic0003877. [DOI] [PubMed] [Google Scholar]
- 42.Avecilla F, Peters JA, Geraldes CFGC. Eur. J. Inorg. Chem. 2003:4179. [Google Scholar]
- 43.Aime S, Batsanov AS, Botta M, Dickins RS, Faulkner S, Foster CE, Harrison A, Howard JAK, Moloney JM, Norman TJ, Parker D, Royle L, Williams JAG. J. Chem. Soc., Dalton Trans. 1997:3623. [Google Scholar]
- 44.Aime S, Batsanov AS, Botta M, Howard JAK, Parker D, Senanayake K, Williams G. Inorg. Chem. 1994;33:4696. [Google Scholar]
- 45.Irving HM, Miles MG, Pettit LD. Anal. Chim. Acta. 1967;38:475. [Google Scholar]
- 46.Zékány L, Nagypál I. In: Computational Methods for Determination of Formation Constants. Legget DJ, editor. New York: 1985. [Google Scholar]
Associated Data
This section collects any data citations, data availability statements, or supplementary materials included in this article.
Supplementary Materials
Electronic Supplementary Information. A comparison of the relaxivity profile recorded in this work and that previously recorded; NMRD profiles recorded at 15, 25 and 35 °C, the parameters and details used in Models I and II, an examination of the correlation coefficients of the protonation constant determinations of 1 and Gd1.


