

Abstract
The genomic region encoding the miR-17−92 microRNA (miRNA) cluster is often amplified in lymphoma and other cancers, and miRNAs within this cluster are expressed in high amounts in cancer cells carrying this amplification. Retroviral expression of miR-17−92 accelerates cMyc-induced lymphoma development, but precisely how elevated miR-17−92 expression promotes lymphomagenesis remains unclear. Here we generated mice with elevated miR-17−92 expression in lymphocytes. These mice developed lymphoproliferative disease and autoimmunity, and died prematurely. Lymphocytes from these mice showed increased proliferation and reduced activation-induced cell death. miR-17−92 miRNAs suppressed expression of the tumor suppressor Pten and the pro-apoptotic protein Bim. This mechanism likely contributed to the lymphoproliferative disease and autoimmunity observed in miR-17−92 transgenic mice, and to lymphoma development in patients carrying amplifications of the miR-17−92 coding region.
INTRODUCTION
Upon antigen engagement, antigen receptors on lymphocytes trigger signaling pathways involving the transcription factor NF-κB, phosphtidylinositol-3-kinase (PI3K), the serine-threonine kinases Akt, mitogen-activated protein kinases (MAPK), the c-Myc proto-oncogene, and the Bcl-2 family of regulators of apoptosis. These pathways lead to lymphocyte activation, proliferation and survival1. Studies over the last decades have revealed that alterations of these molecular pathways play critical roles in the development of autoimmune diseases and lymphomas 1,2. Pten, an inhibitor of the PI3K pathway, is frequently mutated in human lymphomas, and this mutation predisposes humans to both autoimmunity and cancer 3-5. In mice with T lymphocyte-specific loss of Pten, both central and peripheral tolerance are compromised, and the animals develop autoimmunity and T cell lymphoma with a latency of a few weeks 6. Bim, a BH3-only pro-apoptotic member of the Bcl-2 family, is another example of a molecule at the crossroad of autoimmunity and lymphoma. Bim is essential for the deletion of self-reactive thymocytes, mature T cells, immature and mature B cells. Bim-deficient mice develop autoimmunity with a latency of 6−12 months, and Bim deficiency accelerates cMyc-induced lymphomagenesis 7-11. Strikingly, even loss of a single allele of either the Pten or the Bim gene is sufficient to cause measurable biological effects, suggesting that these proteins function over a narrow range of concentrations under physiological conditions, and that small changes in their concentrations have severe biological consequences 7,12.
MiRNAs have recently emerged as important factors in the post-transcriptional control of intracellular protein concentrations in metazoan organisms. These RNA molecules of approximately 22 nucleotides pair with mRNAs transcribed from protein coding genes, and specify their degradation or translational repression 13. MiRNAs display distinct temporal and spatial expression patterns and regulate a diverse range of physiological processes including hematopoiesis, developmental timing, cell differentiation and proliferation, apoptosis, and organ development 14,15. Expression profiling studies have detected specific miRNA expression signatures in a variety of human cancers, and miRNA genes are frequently located at genomic regions associated with carcinogenesis, suggesting that miRNAs may be involved in cell transformation 16-18.
The miR-17−92 miRNA cluster is located at human chromosome 13q31, in a genomic region that is frequently amplified in lymphomas and other cancers, and the mature miRNAs encoded by this locus are expressed in high amounts in cancer cells 18-21. Retroviral expression of this miRNA cluster in the hematopoietic system accelerated the onset of cMyc-mediated lymphomagenesis in a transgenic mouse model involving bone marrow reconstitution 22. To elucidate the mechanism by which the miR-17−92 cluster promotes lymphomagenesis, we generated mice with elevated miR-17−92 expression in lymphocytes. We showed that Pten and Bim mRNAs are direct targets of miRNAs in the miR-17−92 cluster, that Pten and Bim protein expression is downregulated upon constitutive and moderate over-expression of miR-17−92 miRNAs, and that miR-17−92 transgenic animals develop a lymphoproliferative disease and autoimmunity.
RESULTS
Transgenic expression of miR-17−92 miRNAs
The human miR-17−92 transcript encoded by chromosome 13 is the precursor of seven miRNAs (miR-17−5p, miR-17−3p, miR-18a, miR-19a, miR-20a, miR-19b, and miR-92). Additionally, this cluster is homologous to the miR-106a-363 cluster on human chromosome X and the miR-106b-25 cluster on human chromosome 7. Together, these three clusters contain 15 miRNA stem-loops, giving rise to 14 distinct mature miRNAs, which fall into five microRNA families; the members in each family have identical seed regions (Supplementary Figure 1, online). This genomic organization is highly conserved in all vertebrates from which complete genome sequences are available 23, and many of the encoded miRNAs are broadly expressed in mouse tissues and cells, with relatively high expression in lymphocytes and embryonic stem (ES) cells (Supplementary Figure 2, online). During lymphocyte development, miR-17−92 miRNAs were expressed in high amounts in precursor cells and expression decreased 2−3 fold upon maturation (Fig. 1a). Consistent with earlier reports, examination of a few lymphoma cell lines revealed that some expressed elevated amounts of miR-17−92 miRNAs as compared to human splenocytes, with the highest quantity observed in L1236, a classical Hodgkin's lymphoma cell line (Fig. 1b).
Figure 1.

Expression of miR-17−92 miRNAs. (a) Expression of miR-17−5p and miR-92 in indicated lymphocyte or progenitor populations was determined by Northern blot. The miR-17−5p/U6 ratio in pre-B cells was arbitrarily set at 1. (b) Expression of miR-17−5p in human splenocytes and cell lines was determined by Northern blot. L1236 is a Hodgkin's lymphoma cell line; Akata, Kem-1, Oku-1, 11/17−3, and 721 are Burkitt's lymphoma cell lines. The miR-17−5p/U6 ratio in L1236 cells was arbitrarily set at 1 in (b-c). (c-d) Ectopic expression of miR-17−5p, 19a, and 92 in control, TG and TG/TG lymphoid cells and tissues were determined by Northern blot.
To investigate whether elevated amounts of miR-17−92 miRNAs play a role in the initiation of lymphomagenesis, we used a gain-of-function gene targeting approach. To this end, we inserted a genomic DNA fragment encoding the human miR-17−92 cluster, preceded by the synthetic CAG promoter and a loxP-flanked Neo-STOP cassette, into the ubiquitously expressed Rosa26 locus. An frt-flanked IRES-EGFP cassette was placed between the miR-17−92 genomic DNA fragment and the polyadenylation signal (pA) (Supplementary Figure 3, online). We termed this mutant allele miR-17−92 transgenic (miR-17−92 TG). Mice carrying this allele were bred with hCD2-iCre transgenic mice to obtain mice expressing hCD2-iCre and one copy of the miR-17−92 TG (hereafter referred to as TG) or two copies of the miR-17−92 TG (TG/TG). hCD2-iCre induces expression of Cre recombinase in CD25−CD44− double negative 1 (DN1) thymocytes and in pro-B cells24. Upon Cre-mediated excision of the Neo-STOP cassette, the CAG promoter drove production of the miR-17−92 miRNAs in B and T cell compartments (Fig. 1c). Interestingly, EGFP expression was detected neither in TG nor TG/TG mice (data not shown), probably due to high processing efficiency of the primary transcript by Drosha, which cuts out the stem-loop structures encoding individual miRNAs and therefore destabilizes the EGFP coding RNA fragment 25. In thymocytes, miR-17−5p expression increased from 41−43% in control mice to 66−68% in TG/TG mice, compared to 100% in L1236 Hodgkin's lymphoma cells; in mature B cells, miR-17−5p expression increased from 29−37% in control mice to 75−85% in TG/TG mice. The 2−3-fold increase of miR-17−5p expression in mature TG/TG B cells was also seen in mature TG/TG T cells (Fig. 1d). miR-19 and miR-92 were also measured and their expression in TG/TG lymphocytes was comparable to that of miR-17−5p (Fig. 1c). CD4+ T cells from TG mice exhibited miR-17−92 expression amounts between those from control and TG/TG mice (Fig. 1d) and TG mice displayed milder phenotypes than TG/TG mice, on whose analysis we focused in this paper. As demonstrated by our results, in this experimental system the transgenic miRNAs were expressed in amounts close to, but lower than, those of L1236 cells. This is important, as we aimed to establish a mouse model with miR-17−92 expression comparable to that in human lymphoma cells.
Lymphoproliferative disease in TG/TG mice
To determine the impact of elevated miR-17−92 expression in lymphocytes in vivo, 16 control mice and 25 TG/TG mice were monitored for more than 55 weeks. Twenty-three TG/TG mice (92%) died, while all control mice remained healthy during this period (Fig. 2a). To exclude the possibility that the hCD2-iCre transgene contributes to the phenotype of the TG/TG mice, we examined five hCD2-iCre mice by flow cytometry and three hCD2-iCre mice by in vitro lymphocyte activation. All these mice displayed similar phenotypes to wild type mice. All diseased mice examined exhibited spleens and lymph nodes enlarged up to 30-fold in terms of weight and cell number when compared to those from control mice (Supplementary Figure 4, online). Histologically, TG/TG spleens displayed a substantially expanded white pulp and a reduced red pulp. The follicular structure was almost completely disrupted, with B and T cells randomly mixed. The marginal zone structures were also disrupted, as shown by the absence of MOMA-1+ metallophillic macrophages (Fig. 2b). Lymph nodes of TG/TG mice showed similar alterations (data not shown).
Figure 2.
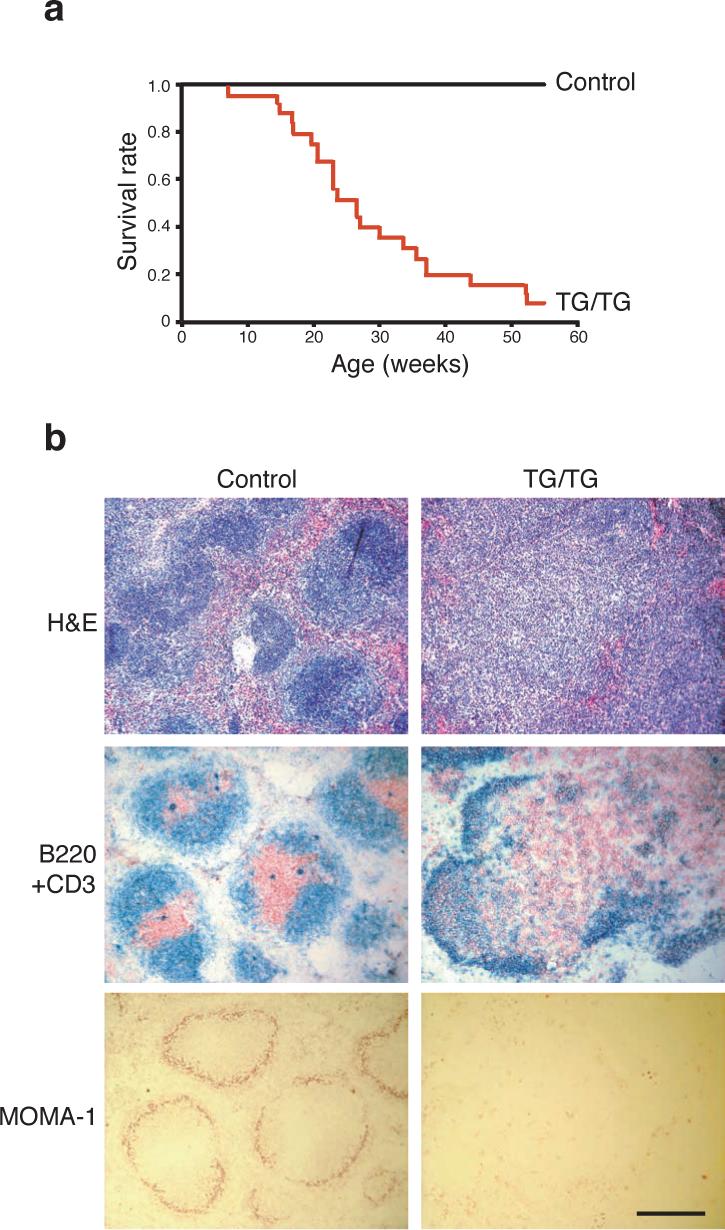
miR-17−92 transgenic mice develop hyperplasia of peripheral lymphoid tissues and have reduced life span. (a) The survival rate of 25 TG/TG and 16 control mice. (b) Haematoxylin and eosin (H&E), CD3 and B220, and MOMA-1 staining of the spleens of 20-week old TG/TG and control mice. CD3 (red) and B220 (blue), and MOMA-1 (red) staining was performed on cryo-sections, and H&E staining was performed on paraffin sections. The black bar indicates 1 mm in length.
Control and TG/TG mice were sacrificed at the age of 5−45 weeks and lymphocyte subpopulations in bone marrow, thymus, spleen, peripheral and mesenteric lymph nodes, and the peritoneal cavity were examined by flow cytometry. In TG/TG mice younger than 14 weeks, B cell development in the bone marrow was comparable to that of control mice (data not shown). Thymocyte development was also largely normal, except for a more than 2-fold increase in the percentage of DN1 thymocytes among all DN thymocytes. This alteration, however, did not lead to a reduction in total thymocyte numbers or alteration in development of CD4+CD8+ double positive (DP) and CD4+CD8− and CD4−CD8+ single positive (SP) thymocytes (Supplementary Figure 5, online).
In the periphery, an increase in lymphocyte numbers was seen in mice as young as 5 weeks. The expansion of the CD4+ T cell population was the most consistent and substantial change among all lymphocyte subsets, with CD4+ T cell numbers reaching up to 5×10⁸ per spleen in TG/TG mice. B cells and CD8+ T cell populations were also expanded, but to a lesser degree than the CD4+ T cell pool (Fig. 3a). Flow cytometric analysis of lymphocyte surface markers showed accumulation of antigen-experienced CD44+CD62L− CD4+ and CD8+ T cells with age in TG/TG mice. Almost all TG/TG T cells displayed a CD44+CD62L− surface phenotype in mice older than 15 weeks (Fig. 3b and Supplementary Figure 6, online). In these relatively old TG/TG mice, more than 40% of CD4+ T cells also expressed CD69, suggesting that they were recently activated26 (Fig. 3b). A similar phenotype was observed for CD4+ T cells in TG/TG lymph nodes (data not shown). Cell cycle analysis showed that a higher proportion of TG/TG than control CD4+ T cells were in the S, G2 and M phases of the cell cycle, indicating that more of the TG/TG CD4+ T cells were proliferating in vivo (Fig. 3c).
Figure 3.


Effects of elevated miR-17−92 expression levels on peripheral lymphocytes. (a) Lymphocyte subset numbers in the spleens of TG/TG and control mice. Each dot represents one mouse. (b) Flow cytometric analysis of phenotype of splenic CD4+ T and B cells in TG/TG and control mice of indicated ages. MZB, marginal zone B cells; GCB, germinal center B cells. Control mice include two hCD2-iCre mice analyzed at 7 weeks and three hCD2-iCre mice analyzed at 12 weeks. (c) Cell cycle analysis of MACS-purified peripheral CD4+ T cells from 20−45 week old mice. Percentage of cells in S-G2-M phases is graphed. Each dot represents one mouse. Bars indicate the mean values. (d) Flow cytometric analysis of phenotype of splenic B cells in TG/TG and control mice of indicated ages.
In 5-week-old TG/TG mice, we observed an increase in the numbers of CD19+B220loCD5+CD43+CD23− B1a cells in the spleen and peritoneal cavity, and a reduction in the numbers of marginal zone B cells (Fig. 3b and data not shown). These changes were also evident in TG mice (data not shown). The expansion of B1a cell populations persisted in old TG/TG mice, and marginal zone B cells completely disappeared in aged TG/TG mice (Fig. 3b). We also noted increased numbers of germinal center B cells in the spleen and peripheral lymph nodes in TG/TG mice over 6−7 weeks of age. Germinal center B cells represented 5−10% of all splenic and lymph node B cells in TG/TG mice older than 8 weeks, compared to 0.2−1.1% in control mice (Fig. 3b). In TG/TG mice older than 15 weeks, almost all B cells in the spleen and lymph nodes displayed increased cell size and elevated surface expression of Fas and class II MHC molecules, indicative of cellular activation (Fig. 3d).
miR-17−92 TG/TG mice develop autoimmunity
To assess whether de-regulation of lymphocyte activation in TG/TG mice leads to autoimmunity, we measured total immunoglobulin (Ig) concentrations and anti-DNA autoantibody titers in the serum of control and TG/TG mice. At the age of 8−12 weeks, TG/TG mice had 4−6 fold higher serum concentrations of total IgM, IgG2a, IgG2b, and IgG3 than control mice (Fig. 4a). At 18−25 weeks, the blood of TG/TG mice contained significant titers of IgG2a, IgG2b, and IgG3 autoantibodies against single- and double-stranded DNA, whereas control mice of the same age had low or undetectable levels of autoantibodies of these isotypes (Fig. 4b).
Figure 4.

Autoimmunity in miR-17−92 transgenic mice. (a) Increased serum immunoglobulin concentrations in un-immunized TG/TG mice. Mice were bled at the age of 8−12 weeks and serum Ig concentrations were determined by ELISA. P values are 8.6×10⁻⁴ for IgM, 3.0×10⁻⁵ for IgG2a, 7.1×10⁻⁶ for IgG2b, and 7.3×10⁻⁴ for IgG3. (b) Serum anti-ssDNA and anti-dsDNA antibody titers in TG/TG and control mice. Mice were bled at the age of 18−25 weeks and serum autoantibody titers were determined by ELISA. The serum titers of one 26-week old MRL-lpr/lpr mouse were arbitrarily set at 1,000 for all isotypes. Serum samples with antibody titers lower than the detection limit were given arbitrary values between 1 and 2, for the graphing purpose. Each dot represents one mouse and bars indicate geometric mean values in (a) and (b). For anti-ssDNA titer, P values are 5.4×10⁻³ for IgG2a, 5.6×10⁻³ for IgG2b, 4.1×10⁻³ for IgG3; for anti-dsDNA titer, P values are 3.4×10⁻³ for IgG2a, 3.2×10⁻³ for IgG2b, 2.7×10⁻² for IgG3. (c) Haematoxylin and eosin staining of lung and salivary gland of 20-week-old TG/TG and control mice. The black bar indicates 1 mm in length. (d) Haematoxylin and eosin staining of kidneys of 20-week-old TG/TG and control mice. Shown are representative glomeruli. (e) Immunofluorescence staining of glomerular segments of 20-week-old TG/TG and controlmice. Note the accumulation of IgG (red) in the glomeruli and the presence of antinuclear antibody in the nuclei of tubular cells in the transgenic mice. The black bar in (d) and the white bar in (e) indicate 100 μm in length.
Histological analysis revealed massive lymphocyte infiltration into non-lymphoid tissues of diseased TG/TG mice, with salivary glands and lungs as the most severely affected organs, and kidneys affected to a lesser degree (Fig. 4c). All these animals showed extramedullary hematopoiesis due to functional failure of the bone marrow (data not shown), and the kidneys of some TG/TG mice appeared pale. Hematoxylin and eosin (H&E), as well as periodic acid/Schiff (PAS) staining of kidney sections showed enlarged glomeruli with hypercellularity and mesangial expansion (Fig. 4d). Immunofluorescence staining showed prominent accumulation of IgG and the C3d component of complement in the mesangium and segmentally in the periphery of the glomeruli of a subset of TG/TG mice, suggesting immune complex deposition; control mice showed much less prominent IgG and C3d staining confined to the mesangium (Fig. 4e and Supplementary Figure 7, online). In a very sick TG/TG mouse, the nuclei of tubular cells stained positive for IgG (Fig. 4e), suggesting tissue attack by anti-nuclear autoantibody. Proteinuria was observed in some TG/TG mice, indicating renal dysfunction in these animals (Supplementary Table 1, online). Thus, elevated miR-17−92 expression in lymphocytes led to the development of an autoimmune disease that may have eventually caused the premature death of some transgenic animals.
Enhanced proliferation and survival of TG/TG lymphocytes
To assess whether the phenotype seen in miR-17−92 TG/TG mice is due to lymphocyte-autonomous mechanisms, and to better understand the contribution of individual lymphocyte subsets to the phenotype, we purified naïve CD4+CD62L+ T cells (Supplementary Figure 8, online) and B2 cells from the spleen and peripheral lymph nodes from young mice, exposed them to various stimuli in cell culture, and analyzed their proliferation and survival. We observed enhanced proliferation and survival of naïve TG/TG CD4+ T cells upon stimulation with anti-CD3 or anti-CD3 combined with anti-CD28 (Fig. 5 and Supplementary Table 2, online). Control CD4+ T cells stimulated with anti-CD3 and anti-CD28 proliferated to a similar extent as TG/TG CD4+ T cells treated with anti-CD3 alone (Fig. 5b). This suggests that elevated expression of miR-17−92 mimics CD28 engagement, which is known to lead to recruitment and activation of PI3K 27,28.
Figure 5.

Enhanced proliferation and survival of miR-17−92 transgenic lymphocytes. (a) Enhanced proliferation of miR-17−92 transgenic lymphocytes. MACS-purified CD4+CD62L+ T cells and B2 cells from TG/TG and control mice were labeled with CFSE and treated with indicated stimuli. CFSE dilution was determined by flow cytometry at indicated time points. (b) Overlay of TG/TG CD4+ T cells stimulated with anti-CD3 and control CD4+ T cells stimulated with anti-CD3 and CD28 from the experiment shown in (a). (c) Cell cycle analysis of CD4+ T cells on day 2 after in vitro activation as described in (a).
We also observed enhanced proliferation of TG/TG B2 cells upon activation with anti-IgM or lipopolysaccharide (LPS) (Fig. 5a). In addition, the activated TG/TG B cells were more resistant to Fas-mediated cell death (Supplementary Figure 9, online), potentially explaining the accumulation of germinal center B cells and the general up-regulation of Fas on B cells in TG/TG mice (Fig. 3b-c). Taken together, the enhanced proliferation and survival of both T and B cells upon activation in the periphery may lead to the lymphoproliferative and autoimmune phenotypes observed in TG/TG mice.
Cytokine expression in TG/TG CD4+ T cells
The increased serum immunoglobulin concentrations in TG/TG mice were not equally distributed across all Ig isotypes (Fig. 4). As the role of cytokines produced by CD4+ helper T cells in the control of Ig class switching is well established, we examined the cytokine expression profiles of transgenic CD4+ T cells. Significantly more CD4+ T cells freshly purified from old TG/TG mice produced interferon-γ (IFN-γ) and interleukin 10 (IL-10) than their counterparts from control mice, whereas there was no difference in the number of control and TG/TG cells producing IL-4 and tumor necrosis factor (TNF) (Fig. 6a). When CD4+ T cells from young mice were differentiated in vitro under T helper type 1 (TH1), TH2, and neutral conditions (THN), more TG/TG CD4+ T cells produced IL-10 and IFN-γ, though the difference in the number of IFN-γ-producing cells was not as large as that found for CD4+ T cells freshly isolated from old animals (Fig. 6b). Again, we did not see a consistent difference in the number of cells producing IL-4 or TNF(Fig. 6b). It is known that IFN-γ stimulates the production of IgG2a 29,30, IL-4 of IgG1 31, and IL-10 of IgG3 32. Therefore, these observations are consistent with the immunoglobulin isotype profile found in the TG/TG mice, namely increased IgG2a, IgG2b, and IgG3, but normal IgG1 and IgA (Fig. 4). We also examined cytokine concentrations in the blood and did not find significant differences between TG/TG and control mice (Supplementary Figure 10, online). This finding suggests that the lymphoproliferative and autoimmune phenotypes of miR-17−92 TG/TG mice are not the consequences of a global inflammatory response, which is often accompanied by increased serum concentrations of pro-inflammatory cytokines such as IL-1, IL-6, and TNF 33. Instead, these phenotypes likely result from activation of T and B cells and persistence of these activated cells in the periphery.
Figure 6.

Cytokine expression in miR-17−92 transgenic T cells. (a) Cytokine expression in CD4+ T cells MACS-purified from peripheral lymph nodes of 10−12 month-old mice, as determined by intracellular cytokine staining. Two control and three TG/TG mice were analyzed with similar results. (b) Cytokine expression in naïve CD4+CD62L+ T cells MACS-purified from 4 week-old mice and cultured for 5 days under TH1, TH2, and non-polarizing neutral conditions (THN). Two control and three TG/TG mice were analyzed with similar results.
miR-17−92 miRNAs down-regulate Pten and Bim
To gain insights into the molecular mechanisms underlying the phenotypes observed in TG/TG mice, we searched for miR-17−92 target genes predicted by bioinformatics 34-36, and focused on genes known to be involved in autoimmunity and lymphoma. Our immediate attention was drawn to Pten and Bim, two tumor suppressor genes regulating lymphocyte proliferation and survival, mutation of which predisposes to both autoimmunity and lymphomagenesis. When we searched the approximately 18,000 known mouse mRNA 3' UTRs for those having at least one site complementary to the miRNA seed region (nucleotide positions 2−8) for each of the three distinct miRNAs families in the miR-17−92 cluster (miR-17, miR-19, and miR-92), only 50 distinct mRNAs with such 3' UTRs were found and Pten and Bim transcripts were among the top ten when these mRNAs were ranked by the total number of binding sites for these miRNAs. Thus, Bim and Pten belong to a small group of genes that harbor a strong potential for coordinate regulation by miR-17−92 (reference 37; and N. Rajewsky, personal communication).
To test whether miR-17−92 miRNAs indeed target Pten and Bim, we purified CD4+ T cells from the spleen and peripheral lymph nodes and measured Pten and Bim protein by immunoblot. Pten and Bim protein expression in TG/TG CD4+ T cells was on average 65% and 60%, respectively, of that observed in control CD4+ T cells, thus demonstrating that elevation of miR-17−92 expression in these cells led to reduced expression of these two proteins (Fig. 7a-b). We also measured Pten and Bim protein expression by intracellular staining and observed similar reductions in naïve CD62L+ CD44lo and antigen experienced CD62L−CD44+ TG/TG CD4+ T cells (data not shown). Pten and Bim protein concentrations were reduced to a similar degree in TG/TG B2 cells (data not shown). To demonstrate that the inhibitory effect of miR-17−92 on Pten was mediated by miR-17−92 miRNA binding sites on its mRNA, we performed luciferase reporter assays in tissue culture and found that miR-17−92 over-expression in NIH3T3 cells reduced the activity of a Renilla luciferase reporter gene containing the P1 fragment of the Pten 3’UTR, which harbors three putative binding sites for miR-17−5p and miR-19, but not other fragments of the Pten 3’UTR (Fig. 7c-d, Supplementary Table 3, and Supplementary Figure 11, online). Mutation analysis showed that the miR-17−5p site and the second miR-19 site in the P1 fragment were important in mediating the inhibition (Fig. 7c-d). The involvement of miR-17−5p and miR-19 in inhibiting Pten expression was further corroborated by the up-regulation of the Renilla luciferase reporter gene containing the P1 fragment of the Pten 3’UTR upon sequestration of the endogenous miRNAs by antisense LNA oligonucleotides in transfected HeLa cells (Fig. 7e and Supplementary Figure 11, online). The up-regulation of the reporter activity was higher when both miR-17−5p and miR-19 were sequestered, suggesting that miR-17−5p and miR-19 function cooperatively to suppress Pten protein expression.
Figure 7.

miR-17−92 miRNAs control the protein expression of Pten and Bim. (a) Reduced Pten and Bim protein in TG/TG CD4+ T cells. The Bim antibody recognizes two Bim isoforms: Bim extra long (Bim EL) and long (Bim L). (b) Average Pten/β-actin and Bim/β-actin ratios in CD4+ T cells from TG/TG and control mice. Four control and five TG/TG mice were examined at the age of 6−8 weeks. Data are presented as mean ± s.d. (c) The Pten 3’UTR and Bim 3’UTR contain multiple predicted binding sites for the miR-17−92 miRNAs. P1−4 and B1−3 are the fragments of the 3’UTRs cloned into the psiCHECK2 vector for reporter assays in (d) and (e). m1, m2, and m3 indicate mutations introduced into these fragments. See Supplementary Table 3 for details. (d) miR-17−92 down-regulates the expression of a reporter gene containing the Pten or Bim 3’UTR in NIH3T3 cells. Experiments were performed in triplicates and data are presented as mean ± s.d. Note that the s.d. values are too small to be visible on the graph for some experiments. pCXN2, the vector used to transiently express miR-17−92. P1m1, P1m2, P1m3, B2m1, and B2m2 contain mutations at individual miRNA binding sites as depicted in (c); P1m13 contains mutations m1 and m3. (e) Antisense LNA oligonucleotides up-regulate the expression of a reporter gene containing the Pten P1 or Bim B3 fragments in HeLa cells. AS, antisense.
Similar experiments showed that miR-17−92 miRNAs inhibited Bim expression through their binding sites within the B3 fragment of the Bim 3’UTR (Fig. 7c-d). The Bim 3’UTR also responded to antisense LNA oligonucleotides against miR-19 and miR-92 miRNAs, though the effect of miR-92 seemed to be dominant (Fig. 7e). Collectively, our results show that elevated miR-17−92 expression in lymphocytes leads to reduced Pten and Bim protein expression, which likely contributed to the lymphoproliferative and autoimmune phenotypes observed in miR-17−92 TG/TG mice.
To examine to what degree downregulation of Pten and Bim protein expression contributed to the phenotype of miR-17−92 transgenic mice, we generated and analyzed Pten and Bim double heterozygous mice (hCD2-iCre;Ptenfl/+;Bim+/−). hCD2-iCre;Ptenfl/+;Bim+/− mice did not exhibit any obvious difference in the numbers and activation status of lymphocytes compared to littermate control mice at the age of 8 weeks (data not shown). However, at the age of 20−28 weeks, hCD2-iCre;Ptenfl/+;Bim+/− mice accumulated substantially more antigen-experienced T cells and germinal center B cells than control mice (Fig. 8a), a phenotype similar to, but milder than, that observed in TG/TG mice (Fig. 3b). When cell numbers of CD4 T cells, CD8 T cells, follicular B cells, marginal zone B cells, and B1 cells were compared, there was no significant difference between the double heterozygous knockout mice and control mice (data not shown). Intracellular staining revealed reduced Pten and Bim protein expression in antigen-experienced CD44+CD62L− CD4+ T cells of hCD2-iCre;Ptenfl/+;Bim+/− mice, and the extent of reduction was comparable to that observed in TG/TG mice (Fig. 7a-b and Fig. 8b-c). These results demonstrate that downregulation of Pten and Bim protein expression contributed to the phenotype of TG/TG mice. However, additional miR-17−92 target genes clearly must be invoked to fully explain the mutant phenotype.
Figure 8.

Accumulation of antigen-experienced T cells and germinal center B cells in Pten and Bim compound heterozygous mice. (a) Flow cytometric analysis of splenic CD4+ T cells and B cells of mice of indicated phenotype. Three mice per genotype were analyzed at the age of 20−28 weeks with similar results. (b) Pten and Bim protein expression in splenic CD4+ T cells from mice of indicated genotypes as determined by immunoblot. (c) Intracellular staining of Pten and Bim protein in splenic CD4+ T cells of the indicated genotypes. MFI, mean fluorescence intensity.
DISCUSSION
In this study we investigated the effect of elevated expression of the miR-17−92 cluster, a miRNA cluster highly expressed in some human lymphomas, on lymphocytes and its possible contribution to lymphomagenesis, by genetically increasing miR-17−92 expression in lymphocytes and identifying two tumor suppressors, Pten and Bim, as functionally important targets. We propose that the downregulation of Pten and Bim protein expression by miR-17−92 miRNAs contributes to the lymphoproliferative and autoimmune phenotype observed in miR-17−92 transgenic mice, and to lymphoma development in patients in which the miR-17−92 coding region is amplified in tumor cells. In TG/TG mice, elevated miR-17−92 expression was noted in all B and T cells, as it was driven by the expression of the hCD2-iCre transgene 24. As Pten and Bim play important roles in maintaining central and peripheral tolerance 6, 7, 11, 12, downregulation of Pten and Bim protein expression could potentially cause the breakdown of both tolerance mechanisms. In vitro activation assays showed that TG/TG CD4+ T cells proliferated more and survived better upon activation, suggesting the breakdown of peripheral T cell tolerance mechanisms. Whether peripheral B cell tolerance mechanisms and central tolerance mechanisms are intact in TG/TG mice remains to be tested in separate experiments before a firm conclusion can be reached. However, in a first approach, we examined the percentage of bone marrow Hardy Fraction E cells, and transitional and mature splenic B cells expressing Igλ proteins, whose selective loss during B cell maturation has been attributed to negative selection 38. We did not find any significant difference between control and TG/TG mice (data not shown), suggesting that negative selection of autoreactive B cells during development is intact in TG/TG mice. We also examined the number of Foxp3+ regulatory CD4+ T cells in the thymus and the spleen and did not find any significant difference between control and TG/TG mice (data not shown). Therefore, it is likely that elevated miR-17−92 expression leads to breakdown of T cell tolerance in the periphery, causing the accumulation of activated CD4+ T cells, which provide sufficient help to stimulate B cells to enter germinal center reactions, where they undergo class switch recombination and somatic hypermutation. Some of these cells may differentiate into plasma cells and produce autoantibodies that were detected in the serum of TG/TG mice. Deposition of IgG immune complexes caused tissue damage, as shown by histological analysis. Similar observations have been reported for sanroque mice, which carry a point mutation in the roquin gene. In sanroque mice, accumulation of activated CD4+ T cells leads to B cell activation, germinal center reactions, and autoantibody production 39. TG/TG mice may die of autoimmune disease before TG/TG lymphocytes accumulate sufficient oncogenic mutations for malignant transformation.
In lymphoma patients carrying amplifications of the miR-17−92 coding region in the tumor cells, this amplification likely occurs somatically in individual B or T cells during the course of their malignant transformation. Such an amplification will not give rise to systemic autoimmune disease similar to that observed in TG/TG mice. However, cells with elevated miR-17−92 expression have a lower threshold for activation, proliferate more and survive better upon antigen recognition. These features could lead to an expansion of the mutant cell population, which would increase the probability that such cells, rather than their un-mutated counterparts, acquire additional oncogenic mutations. Elevated miR-17−92 expression may also cooperate with pre-existing oncogenic mutations.
These proposed molecular mechanisms may also explain the accelerated lymphomagenesis observed upon retroviral expression of miR-17−92 in Eμ-Myc transgenic mice 22. Bim functions as a tumor suppressor in Eμ-Myc transgenic mice, and Bim protein expression is increased in Eμ-Myc transgenic B cells and mediates apoptosis. Loss of one allele of Bim accelerates cMyc-induced lymphoma development, almost as effectively as loss of both alleles of Bim 8. Retroviral expression of miR-17−92 accelerated Myc-induced lymphoma development to the same degree as loss of one Bim allele22. We measured Bim protein concentrations in lymphocytes of Bim+/− mice by immunoblot and the 50% reduction we observed was close to that caused by elevated miR-17−92 expression in TG/TG mice. This suggests that down-regulation of Bim protein expression by miR-17−92 is a major mechanism underlying the accelerated cMyc-induced lymphomagenesis induced by miR-17−92.
How do miR-17−92 miRNAs control Pten and Bim protein expression? Both Pten and Bim 3’UTRs contain multiple binding sites for miR-17−92 miRNAs, and they are among the top ten targets when mRNAs containing at least one site for each of the distinct miRNA families in the miR-17−92 cluster are ranked by the total number of binding sites for these miRNAs. Based on the results from the reporter assays performed in NIH3T3 cells over-expressing miR-17−92 and in HeLa cells with individual miR-17−92 miRNAs sequestered by antisense LNA oligonucleotides, the first miR-17−5p site and the second miR-19 site in the P1 fragment cooperate to mediate the repression of the Pten protein levels. For the Bim 3’UTR, the two miR-92 sites seem to play dominant roles. These observations are interesting, in that they confirm the idea derived from previous bioinformatic analyses that co-expressed miRNAs may cooperate to suppress a common target gene bearing binding sites for these miRNAs 34. They also suggest that not all miRNA binding sites are functional in a given cellular context. Recent studies have shown that the context or accessibility of miRNA binding sites, and the protein factors binding in close proximity of the sites, strongly influence the function of individual sites 40-42. It is therefore possible that non-functional sites in NIH3T3 and/or HeLa cells could be functional in lymphocytes or other cells. Alternatively, the expression of other miRNAs with identical seed regions could confer functional redundancy in cells in which reporter assays were performed.
To what degree does downregulation of Pten and Bim protein contribute to the phenotype of TG/TG mice? hCD2-iCre;Ptenfl/+;Bim+/− mice exhibited an abnormal, progressive accumulation of antigen-experienced CD4+ T cells and germinal center B cells, similar to the TG/TG mice. However, the massive lymphocyte population expansion seen in the latter mice did not occur in hCD2-iCre;Ptenfl/+;Bim+/− mice. Therefore, additional miR-17−92 target genes must be taken into account to fully explain the phenotype of TG/TG mice. E2F family transcription factors have been implicated as functional targets of miRNAs in the miR-17−92 cluster 43,44. E2F1 and E2F2 are important cell cycle regulators, and a reduction in their protein expression leads to the development of hematopoietic malignancy and autoimmunity 45-48. It is thus conceivable that down-regulation of E2F1 and E2F2 protein synergizes with that of Pten and Bim in causing the severe disease in TG/TG mice. Because of the unavailability of suitable antibodies against murine E2F1 and E2F2 we were unable to directly test this hypothesis.
Taken together, our data indicate that TG/TG mice develop a dramatic lymphoproliferative and autoimmune disease. Pten and Bim are direct targets of miRNAs in the miR-17−92 cluster, and hCD2-iCre;Ptenfl/+;Bim+/− mice exhibit part of the phenotype displayed by TG/TG, demonstrating that miR-17−92-mediated down-regulation of Pten and Bim protein expression indeed contributes to the disease phenotype in TG/TG mice. Clearly, however, miR-17−92 over-expression affects additional pathways in the cells, whose de-regulation, together with that of Pten and Bim, are required for the massive population expansion seen in TG/TG mice. With respect to lymphomagenesis, our results suggest that miR-17−92 over-expression may well play a role in early phases of disease.
METHODS
Mice
To generate miR-17−92 transgenic mice, we cloned a miR-17−92 coding genomic DNA fragment from Jurkat cells into a modified version of pROSA26−1 as previously described 49, preceded by the CAG promoter and a loxP-flanked Neo-STOP cassette, followed by a frt-flanked IRES-EGFP cassette and a polyadenylation signal (pA). Gene targeting was conducted according to established protocols in the laboratory, using the Bruce 4 ES cells. Mice were generated by injecting targeted ES cells into B6 albino blastocysts. Mice carrying the targeted allele were bred with hCD2-iCre mice, which deleted the Neo-STOP cassette in both B and T lymphocytes. hCD2-iCre mice were originally generated by pronuclei injection of fertilized oocytes from (CBA/CaxC57F7BL/10) F1 mice 24 and were imported from a third party without knowing the breeding history. Therefore, the experimental mice were maintained on a mixed genetic background. Pten conditional knockout mice were purchased from the Jackson Laboratory (stock number 006068) and are maintained on a mixed genetic background. Bim-deficient mice were generated as previously described and maintained on a mixed genetic background 7. For all experiments in this study, littermates were used as control (including wild type mice, hCD2-iCre mice, and mice with one or two copy of miR-17−92 transgene but without any Cre transgene). All mouse experiments were approved by the Harvard University Institutional Animal Care and Use Committee and by Immune Disease Institute.
In vitro lymphocyte activation
B2 cells from spleen and peripheral lymph nodes were purified by MACS depletion of CD43+ cells (Miltenyi Biotech) and were activated in vitro at a density of 1×10⁶ cells/ml with 10 μg/ml goat anti-mouse IgM, μ chain specific F(ab’)2 fragment (Jackson Immunoresearch) or with 20 μg/ml LPS (Sigma). CD4+CD62L+ naïve T cells from spleen and peripheral lymph nodes were MACS purified using the CD4+CD62L+ T cell isolation kit (Miltenyi Biotech) and activated in vitro at a density of 5×10⁵ cells/ml with 0.25μg/ml anti-CD3 (clone 145.2C11, eBioscience) either alone or in combination with 2μg/ml anti-CD28 (clone 37.51, eBioscience), in wells previously coated with 0.3 mg/ml of goat anti-hamster antibody (Jackson Immunoresearch).
Proliferation assay
Purified B2 cells or CD4+CD62L+ naïve T cells were labelled with 1nM CFSE for 10 min at 37°C, followed by 2 washes with culture medium. Labelled cells were then activated as described above for 2 to 3 days. Proliferation was monitored by flow cytometry, and data were analyzed using FlowJo software.
In vitro differentiation of CD4+ T cells
Total CD4+ T cells from the spleen of old mice (for immediate cytokine staining) or CD4+CD62L+ T cells from the spleen and lymph nodes of young mice (for in vitro T cell differentiation) were purified using magnetic beads (Miltenyi Biotech). For neutral differentiation, cells (5×10⁵/ml) were stimulated for 3 days with 0.25 ug/ml anti-CD3 and 2 ug/ml anti-CD28 (clones 145.2C11 and 37.51, respectively, eBioscience) in a flask coated with 0.3 mg/ml of goat anti-hamster antibody (Jackson Immunoresearch) in Dulbecco's modified Eagle's medium (DMEM) supplemented with 10% fetal calf serum, L-glutamine, penicillin-streptomycin, nonessential amino acids, sodium pyruvate, vitamins, HEPES and 2-mercaptoethanol. For TH1 differentiation, cells were stimulated in the presence of 10ng/ml recombinant mouse IL-12 (Peprotech) and 10 ug/ml purified anti-IL-4 (11B11, eBioscience). For TH2 differentiation, cells were stimulated in the presence of 25ng/ml recombinant mouse IL-4 (R&D systems), 5 ug/ml anti-IFN-γ (XMG1.2 or R4−6A2) and 3 ug/ml anti-IL-12 (eBioscience). Populations were subsequently expanded for 2 days in the absence of anti-CD3 and anti-CD28, but in the continued presence of cytokines and antibodies that included 10ng/ml recombinant mouse IL-2 (Peprotech). Cells were then treated with PMA (10−20nM) and ionomycin (1μM) for 6 h (Sigma), with the last 4 h in the presence of 5μg/ml Brefeldin A (Sigma) to block cytokine secretion. Restimulated cells were fixed in 2% formaldehyde (Sigma-Aldrich) for 8 min at room temperature, stained in permeabilization buffer (0.5% w/v saponin), and analyzed by flow cytometry.
Intracellular Pten and Bim staining
Intracellular staining for Pten and Bim was carried out using the FoxP3 staining protocol and buffers from eBioscience. The Pten-specific monoclonal antibody (clone C38G6, Cell Signaling) and mouse Bim-specific monoclonal antibody (Epitomics) were used. Briefly, freshly isolated splenocytes were stained for surface markers, and fixed using the fixation and permeabilization buffer for 45 min at 4° C. Cells were washed in permeabilization buffer once and incubated with primary antibody diluted in permeabilization buffer for 45 min at 4°C in the dark. Pten antibody was used at 1:1500 dilution and Bim antibody was used at 1:200 dilution. Subsequently cells were washed twice with permeabilization buffer and incubated with APC-conjugated secondary antibody at 1:500 dilution for 15 min at 4°C in the dark. Cells were washed with FACS buffer and analyzed by flow cytometry.
Statistics
P values were determined by applying Student's two-tailed T-test for independent samples, assuming equal variances on all experimental data sets.
Supplementary Material
ACKNOWLEDGMENTS
We thank Dvora Ghitza, Charety Aristoff, Margaret Curnutte, Anthony Monti, Angela Tetreault, Alex Pellerin, Ali Shahsafaei for expert technical assistance; Azra Krek and Nikolaus Rajewsky for bioinformatics support; Michael C. Carrol for providing the FITC-conjugated rabbit-anti-human C3d complement antibody; Kevin Otipoby for intellectual input; all Rajewsky lab members for discussions. K.R. is supported by NIH grant AI064345 and by the European Union through MUGEN. C.X. was supported by the Cancer Research Institute postdoctoral fellowship. C.X. and L.S are supported by the T32 training grant awarded to the Joint Program in Hematology and Transfusion Medicine at Harvard Medical School. D.P.C is supported by a postdoctoral fellowship from the Portuguese Foundation for Science and Technology (FCT-MCES).
REFERENCES
- 1.Goodnow CC. Multistep pathogenesis of autoimmune disease. Cell. 2007;130:25–35. doi: 10.1016/j.cell.2007.06.033. [DOI] [PubMed] [Google Scholar]
- 2.Hanahan D, Weinberg RA. The hallmarks of cancer. Cell. 2000;100:57–70. doi: 10.1016/s0092-8674(00)81683-9. [DOI] [PubMed] [Google Scholar]
- 3.Di Cristofano A, Pesce B, Cordon-Cardo C, Pandolfi PP. Pten is essential for embryonic development and tumour suppression. Nat Genet. 1998;19:348–55. doi: 10.1038/1235. [DOI] [PubMed] [Google Scholar]
- 4.Suzuki A, et al. High cancer susceptibility and embryonic lethality associated with mutation of the PTEN tumor suppressor gene in mice. Curr Biol. 1998;8:1169–78. doi: 10.1016/s0960-9822(07)00488-5. [DOI] [PubMed] [Google Scholar]
- 5.Podsypanina K, et al. Mutation of Pten/Mmac1 in mice causes neoplasia in multiple organ systems. Proc Natl Acad Sci U S A. 1999;96:1563–8. doi: 10.1073/pnas.96.4.1563. [DOI] [PMC free article] [PubMed] [Google Scholar]
- 6.Suzuki A, et al. T cell-specific loss of Pten leads to defects in central and peripheral tolerance. Immunity. 2001;14:523–34. doi: 10.1016/s1074-7613(01)00134-0. [DOI] [PubMed] [Google Scholar]
- 7.Bouillet P, et al. Proapoptotic Bcl-2 relative Bim required for certain apoptotic responses, leukocyte homeostasis, and to preclude autoimmunity. Science. 1999;286:1735–8. doi: 10.1126/science.286.5445.1735. [DOI] [PubMed] [Google Scholar]
- 8.Egle A, Harris AW, Bouillet P, Cory S. Bim is a suppressor of Myc-induced mouse B cell leukemia. Proc Natl Acad Sci U S A. 2004;101:6164–9. doi: 10.1073/pnas.0401471101. [DOI] [PMC free article] [PubMed] [Google Scholar]
- 9.Strasser A. The role of BH3-only proteins in the immune system. Nat Rev Immunol. 2005;5:189–200. doi: 10.1038/nri1568. [DOI] [PubMed] [Google Scholar]
- 10.Strasser A, Bouillet P. The control of apoptosis in lymphocyte selection. Immunol Rev. 2003;193:82–92. doi: 10.1034/j.1600-065x.2003.00036.x. [DOI] [PubMed] [Google Scholar]
- 11.Bouillet P, et al. BH3-only Bcl-2 family member Bim is required for apoptosis of autoreactive thymocytes. Nature. 2002;415:922–6. doi: 10.1038/415922a. [DOI] [PubMed] [Google Scholar]
- 12.Di Cristofano A, et al. Impaired Fas response and autoimmunity in Pten+/− mice. Science. 1999;285:2122–5. doi: 10.1126/science.285.5436.2122. [DOI] [PubMed] [Google Scholar]
- 13.Bartel DP. MicroRNAs: genomics, biogenesis, mechanism, and function. Cell. 2004;116:281–97. doi: 10.1016/s0092-8674(04)00045-5. [DOI] [PubMed] [Google Scholar]
- 14.Chen CZ, Lodish HF. MicroRNAs as regulators of mammalian hematopoiesis. Semin Immunol. 2005;17:155–65. doi: 10.1016/j.smim.2005.01.001. [DOI] [PubMed] [Google Scholar]
- 15.Mendell JT. MicroRNAs: critical regulators of development, cellular physiology and malignancy. Cell Cycle. 2005;4:1179–84. doi: 10.4161/cc.4.9.2032. [DOI] [PubMed] [Google Scholar]
- 16.Calin GA, et al. MicroRNA profiling reveals distinct signatures in B cell chronic lymphocytic leukemias. Proc Natl Acad Sci U S A. 2004;101:11755–60. doi: 10.1073/pnas.0404432101. [DOI] [PMC free article] [PubMed] [Google Scholar]
- 17.Calin GA, et al. Human microRNA genes are frequently located at fragile sites and genomic regions involved in cancers. Proc Natl Acad Sci U S A. 2004;101:2999–3004. doi: 10.1073/pnas.0307323101. [DOI] [PMC free article] [PubMed] [Google Scholar]
- 18.Lu J, et al. MicroRNA expression profiles classify human cancers. Nature. 2005;435:834–8. doi: 10.1038/nature03702. [DOI] [PubMed] [Google Scholar]
- 19.Ota A, et al. Identification and characterization of a novel gene, C13orf25, as a target for 13q31-q32 amplification in malignant lymphoma. Cancer Res. 2004;64:3087–95. doi: 10.1158/0008-5472.can-03-3773. [DOI] [PubMed] [Google Scholar]
- 20.Zhang B, Pan X, Cobb GP, Anderson TA. microRNAs as oncogenes and tumor suppressors. Dev Biol. 2007;302:1–12. doi: 10.1016/j.ydbio.2006.08.028. [DOI] [PubMed] [Google Scholar]
- 21.Tagawa H, Seto M. A microRNA cluster as a target of genomic amplification in malignant lymphoma. Leukemia. 2005;19:2013–6. doi: 10.1038/sj.leu.2403942. [DOI] [PubMed] [Google Scholar]
- 22.He L, et al. A microRNA polycistron as a potential human oncogene. Nature. 2005;435:828–33. doi: 10.1038/nature03552. [DOI] [PMC free article] [PubMed] [Google Scholar]
- 23.Tanzer A, Stadler PF. Molecular evolution of a microRNA cluster. J Mol Biol. 2004;339:327–35. doi: 10.1016/j.jmb.2004.03.065. [DOI] [PubMed] [Google Scholar]
- 24.de Boer J, et al. Transgenic mice with hematopoietic and lymphoid specific expression of Cre. Eur J Immunol. 2003;33:314–25. doi: 10.1002/immu.200310005. [DOI] [PubMed] [Google Scholar]
- 25.Lee Y, et al. The nuclear RNase III Drosha initiates microRNA processing. Nature. 2003;425:415–9. doi: 10.1038/nature01957. [DOI] [PubMed] [Google Scholar]
- 26.Testi R, Phillips JH, Lanier LL. Leu 23 induction as an early marker of functional CD3/T cell antigen receptor triggering. Requirement for receptor cross-linking, prolonged elevation of intracellular [Ca++] and stimulation of protein kinase C. J Immunol. 1989;142:1854–60. [PubMed] [Google Scholar]
- 27.Okkenhaug K, et al. A point mutation in CD28 distinguishes proliferative signals from survival signals. Nat Immunol. 2001;2:325–32. doi: 10.1038/86327. [DOI] [PubMed] [Google Scholar]
- 28.Pages F, et al. Binding of phosphatidylinositol-3-OH kinase to CD28 is required for T-cell signalling. Nature. 1994;369:327–9. doi: 10.1038/369327a0. [DOI] [PubMed] [Google Scholar]
- 29.Snapper CM, Paul WE. Interferon-gamma and B cell stimulatory factor-1 reciprocally regulate Ig isotype production. Science. 1987;236:944–7. doi: 10.1126/science.3107127. [DOI] [PubMed] [Google Scholar]
- 30.Finkelman FD, Katona IM, Mosmann TR, Coffman RL. IFN-gamma regulates the isotypes of Ig secreted during in vivo humoral immune responses. J Immunol. 1988;140:1022–7. [PubMed] [Google Scholar]
- 31.Snapper CM, Finkelman FD, Stefany D, Conrad DH, Paul WE. IL-4 induces co-expression of intrinsic membrane IgG1 and IgE by murine B cells stimulated with lipopolysaccharide. J Immunol. 1988;141:489–98. [PubMed] [Google Scholar]
- 32.Shparago N, et al. IL-10 selectively regulates murine Ig isotype switching. Int Immunol. 1996;8:781–90. doi: 10.1093/intimm/8.5.781. [DOI] [PubMed] [Google Scholar]
- 33.Sosic D, Richardson JA, Yu K, Ornitz DM, Olson EN. Twist regulates cytokine gene expression through a negative feedback loop that represses NF-kappaB activity. Cell. 2003;112:169–80. doi: 10.1016/s0092-8674(03)00002-3. [DOI] [PubMed] [Google Scholar]
- 34.Krek A, et al. Combinatorial microRNA target predictions. Nat Genet. 2005;37:495–500. doi: 10.1038/ng1536. [DOI] [PubMed] [Google Scholar]
- 35.Lewis BP, Shih IH, Jones-Rhoades MW, Bartel DP, Burge CB. Prediction of mammalian microRNA targets. Cell. 2003;115:787–98. doi: 10.1016/s0092-8674(03)01018-3. [DOI] [PubMed] [Google Scholar]
- 36.Lewis BP, Burge CB, Bartel DP. Conserved seed pairing, often flanked by adenosines, indicates that thousands of human genes are microRNA targets. Cell. 2005;120:15–20. doi: 10.1016/j.cell.2004.12.035. [DOI] [PubMed] [Google Scholar]
- 37.Koralov SB, Muljo SA, Galler GR, Krek A, Chakraborty T, Kanellopoulou C, Jensen K, Cobb BS, Merkenschlager M, Rajewsky N, Rajewsky K. Dicer ablation affects antibody diversity and cell survival in the B lymphocyte lineage. Cell. doi: 10.1016/j.cell.2008.02.020. (in press) [DOI] [PubMed] [Google Scholar]
- 38.Lindsley RC, Thomas M, Srivastava B, Allman D. Generation of peripheral B cells occurs via two spatially and temporally distinct pathways. Blood. 2007;109:2521–8. doi: 10.1182/blood-2006-04-018085. [DOI] [PubMed] [Google Scholar]
- 39.Vinuesa CG, et al. A RING-type ubiquitin ligase family member required to repress follicular helper T cells and autoimmunity. Nature. 2005;435:452–8. doi: 10.1038/nature03555. [DOI] [PubMed] [Google Scholar]
- 40.Grimson A, et al. MicroRNA targeting specificity in mammals: determinants beyond seed pairing. Mol Cell. 2007;27:91–105. doi: 10.1016/j.molcel.2007.06.017. [DOI] [PMC free article] [PubMed] [Google Scholar]
- 41.Kertesz M, Iovino N, Unnerstall U, Gaul U, Segal E. The role of site accessibility in microRNA target recognition. Nat Genet. 2007;39:1278–84. doi: 10.1038/ng2135. [DOI] [PubMed] [Google Scholar]
- 42.Kedde M, et al. RNA-Binding Protein Dnd1 Inhibits MicroRNA Access to Target mRNA. Cell. 2007;131:1273–86. doi: 10.1016/j.cell.2007.11.034. [DOI] [PubMed] [Google Scholar]
- 43.O'Donnell KA, Wentzel EA, Zeller KI, Dang CV, Mendell JT. cMyc-regulated microRNAs modulate E2F1 expression. Nature. 2005;435:839–43. doi: 10.1038/nature03677. [DOI] [PubMed] [Google Scholar]
- 44.Sylvestre Y, et al. An E2F/miR-20a autoregulatory feedback loop. J Biol Chem. 2007;282:2135–43. doi: 10.1074/jbc.M608939200. [DOI] [PubMed] [Google Scholar]
- 45.Yamasaki L, et al. Tumor induction and tissue atrophy in mice lacking E2F-1. Cell. 1996;85:537–48. doi: 10.1016/s0092-8674(00)81254-4. [DOI] [PubMed] [Google Scholar]
- 46.Field SJ, et al. E2F-1 functions in mice to promote apoptosis and suppress proliferation. Cell. 1996;85:549–61. doi: 10.1016/s0092-8674(00)81255-6. [DOI] [PubMed] [Google Scholar]
- 47.Murga M, et al. Mutation of E2F2 in mice causes enhanced T lymphocyte proliferation, leading to the development of autoimmunity. Immunity. 2001;15:959–70. doi: 10.1016/s1074-7613(01)00254-0. [DOI] [PubMed] [Google Scholar]
- 48.Zhu JW, et al. E2F1 and E2F2 determine thresholds for antigen-induced T-cell proliferation and suppress tumorigenesis. Mol Cell Biol. 2001;21:8547–64. doi: 10.1128/MCB.21.24.8547-8564.2001. [DOI] [PMC free article] [PubMed] [Google Scholar]
- 49.Sasaki Y, et al. Canonical NF-kappaB activity, dispensable for B cell development, replaces BAFF-receptor signals and promotes B cell proliferation upon activation. Immunity. 2006;24:729–39. doi: 10.1016/j.immuni.2006.04.005. [DOI] [PubMed] [Google Scholar]
Associated Data
This section collects any data citations, data availability statements, or supplementary materials included in this article.