

Abstract
X-ray absorption spectroscopy has been used to characterize the novel nitridoiron(IV) unit in [PhBPiPr3]Fe(N) and obtain direct spectroscopic evidence for a very short Fe–N distance. The distance of 1.52(2) Å reflects the presence of an Fe≡N triple bond in accord with the observed Fe≡N vibration (νFeN = 1034 cm−1). This highly covalent bonding interaction results in the appearance of an unusually intense pre-edge peak, whose estimated area of 100(20) units is much larger than those of the related tetrahedral complexes with FeI–N2–FeI, FeII–NPh2, and FeIII≡NAd motifs, and those of recently described six-coordinate FeV≡N and FeVI≡N complexes. The observation that the FeIV–N distance of [PhBPiPr3]Fe(N) is shorter than the FeIV–O bond lengths of oxoiron(IV) complexes may be rationalized on the basis of the greater π basicity of the nitrido ligand than the oxo ligand and a lower metal coordination number for the Fe(N) complex.
There has been much recent interest in the preparation and characterization of iron complexes that feature metal-to-ligand multiple bonds,1, 2 with oxo, imido, and nitrido functionalities being most noteworthy in this regard. Metrical parameters for species of these types are of much interest as they can be correlated with their electronic structures and reactivity patterns. Knowledge in this area contributes to our general understanding of the roles such iron species can play in biocatalysis3–5 and synthetic and catalytic atom and group transfer reactions.1,6, 7 Until very recently, well-characterized mononuclear Fe(NR) and Fe(N) complexes were virtually unknown, but at this stage there are examples of these types of compounds spanning the entire range of oxidation states from FeII to FeVI.8–15
More specifically, Wieghardt and coworkers have recently characterized two fascinating six-coordinate iron nitrido complexes in the +V and +VI oxidation states using a suite of spectroscopic techniques.14, 15 Their effort follows earlier work by Nakamoto in which the generation of an FeV nitride at low temperature was postulated based upon resonance Raman data in conjunction with elegant labeling studies.16 On the other hand, the Peters group has reported on the generation of a structurally distinct family of pseudotetrahedral Fe≡Nx species. This family of complexes has included two FeIV nitrido species,13, 17 in addition to iron imides in each of the oxidation states +II,9 +III,10–12, 18 and +IV.12 The pseudotetrahedral L3Fe≡Nx species are stabilized by tris(phosphino)borate (generically abbreviated as [PhBPR3]−) and pyrazolylbis(phosphino)borate ligands and feature strong covalent bonding characterized by Fe≡Nx triple bonds. Metrical parameters have been readily obtained for imidoiron species with +II, +III, and +IV oxidation states from low temperature X-ray crystallography. It has been found that the Fe–NR bond length in these imides is virtually insensitive to the oxidation state of the metal center; in all cases it is ca. 1.65(2) Å. This observation is consistent with the triple bond description that has been forwarded.2, 9, 12 Unfortunately, the Fe–N distances of the nitridoiron(IV) complexes have not been determined crystallographically. In the case of [PhBPiPr3]FeIV≡N, the high concentrations typically needed for crystallization result in the dimerization of the complex to afford the diiron(I) N2-bridged product {[PhBPiPr3]Fe}2(μ-N2).13 Since the FeIV≡N bond length is a critical parameter to ascertain, especially for direct comparison with octahedrally coordinated nitrido, imido, and oxo species of high valent iron, we have turned to Fe K-edge X-ray absorption spectroscopy (XAS) and the analysis of the extended X-ray absorption fine structure (EXAFS) as a means to obtain such information. Herein we provide XAS data that serve to characterize the series of complexes {[PhBPiPr3]FeI}2(μ-N2) (1),10, 13 [PhBPiPr3]FeII–NPh2 (2),13 [PhBPiPr3]FeIII≡NAd (3),10 [PhBPiPr3]Fe IV≡N (4),13 and [PhBPCH2Cy3]FeIV≡N.17
Experimental Section
Sample Preparation
Complexes 1 – 5 were prepared as described previously.10, 13, 17 X-ray absorption spectra of 1 – 3 were obtained on solid samples prepared by grinding the iron complex (1 mg) and boron nitride (99 mg) into a homogeneous mixture under an inert gas atmosphere. A total of 20 mg of the solid mixture was then packed into a sample plate (1 mm thickness) and covered with Mylar tape. Samples of 4 were prepared in benzene-d6 or toluene-d8 solution by the following protocol: Complex 4 was generated by the addition of a thawing solution of [PhBPiPr3]FeCl in THF (ca. −110 °C) to solid Li-2,3:5,6-dibenzo-7-aza bicyclo[2.2.1]hepta-2,5-diene (dbabh). The solution was incubated at room temperature for 15 min during which anthracene was released and 4 was produced. Three samples of 4 were independently prepared: a 0.01 M solution in C6D6 (4A), a 0.03 M solution in C7D8 (4B), and a 0.03M solution in C6D6 (4C). About 0.5 mL of each independently prepared solution of 4 was transferred into a pre-cooled XAS cup, covered with Mylar tape, and frozen in the liquid-N2-cooled cold well of the anaerobic box. Complex 5 was prepared by the addition of a thawing THF solution of [PhBPCH2Cy3]FeCl to a frozen solution of Li(dbabh) in THF (ca. −110 °C) to give a final concentration of 35 mM. A stir bar was added to the frozen mixture, which was then allowed to warm to −50 °C, and stirred for 4 h. The XAS sample was prepared as for 4. A duplicate sample in THF- d8 was analyzed by 31P and 1H NMR spectroscopies at −50 °C to ensure clean and quantitative conversion of [PhBPCH2Cy3]FeCl to 5.
X-ray Absorption Spectroscopy
Fe K-edge X-ray absorption spectra were recorded on beamline 9-3 of the Stanford Synchrotron Radiation Laboratory (SSRL), Stanford Linear Accelerator Center (storage ring conditions, 3 GeV, 50 – 100 mA), and on beamline X9B of the National Synchrotron Light Source (NSLS), Brookhaven National Laboratory (storage ring conditions, 2.8 GeV, 100 – 300 mA). The samples were maintained at a constant temperature between 5 and 15 K during data collection over the energy range 6.9 – 8.0 keV (Si(220) double-crystal monochromator). Contamination of higher harmonics radiation was minimized by using a bent focusing mirror (beamline 9-3 at SSRL) or by a harmonic rejection mirror (beamline X9B at NSLS). To reduce the flux intensity at beamline 9-3, the defocused beam was attenuated by Al foil. Spectra were measured with 10 eV steps below the edge, 0.3 eV steps in the edge region, and steps equivalent to 0.05 Å−1 increments above the edge (region borders were 6880, 7090, and 7140 eV at beamline 9-3, SSRL, and 6932, 7102, and 7137 eV at beamline X9B, NSLS). An iron foil spectrum was recorded concomitantly for internal energy calibration and the first inflection point of the K-edge energy was assigned to 7112.0 eV. The data were obtained as fluorescence excitation spectra (Aexp (Cf/C0)) using a solid state Ge detector (Canberra).
The iron concentration in the samples and the number of scans acquired for each sample were as follows: 1,0.2 M Fe, 3 scans (30 detector elements, SSRL); 2,0.16 M Fe, 3 scans (30 detector elements, SSRL); 3,0.16 M Fe, 3 scans (30 detector elements, SSRL); 4A, 0.01 M Fe in benzene-d6, 10 scans (27 detector elements, SSRL); 4B, 0.03 M Fe in toluene-d8, 10 scans (30 detector elements, SSRL); 4C, 0.03 M Fe in benzene-d6, 6 scans (12 detector elements, NSLS); 5, 0.035 M Fe in THF, 4 scans (28 detector elements, SSRL).
The data analysis was carried out using the programs EXAFSPAK19 and SSExafs20 as described.21–23 EXAFS data for 1 – 4 are shown in the Supporting Information (Figure S1). Curve-fitting of XANES data to obtain pre-edge peak areas: The edge was modeled as an integral of a 75% Gaussian and 25% Lorentzian peak. The heights, positions and widths (at half height) of pre-edge peaks were refined using a Gaussian function. Refinements with multiple peaks were constrained to have a common width for all peaks. Peak energies and intensities are listed in Table S1.
Density Functional Theory (DFT) Computations
Molecular geometries of [PhBPiPr3]FeIII≡NtBu (which we use here as a truncated model of 3) and [PhBPiPr3]FeIV≡N (4) had been previously obtained using DFT energy minimization methods.13,17 Using these optimized geometries, single-point DFT computations were performed with the Amsterdam Density Functional (ADF) 2003.01 software package.24–26 These computations were carried out on a cluster consisting of Intel Xeon processors (Ace Computers) using an uncontracted triple-ζ Slater-type orbital including a single set of polarization functions as a basis set (ADF basis set IV), an integration constant of 4.0, and the local density approximation of Vosko, Wilk, and Nusair,27 with the nonlocal gradient corrections of Becke28 and Perdew.29 Core orbitals were frozen through 1s (O, N, B) and 2p (Fe and P). Calculations for [PhBPiPr3]FeIII≡NtBu and [PhBPiPr3]FeIV≡N were converged to the S = ½ and S = 0 spin states. Because we performed these computations to gain insights into the factors contributing to the pre-edge areas of 3 and 4, we performed additional single-point calculations to model the 1s → 3dz2 excited state, following the method of Westre et al.,30 in order to assess what effect this electronic transition has on the Fe 3d MO compositions. For these computations, the 1s hole was approximated by substituting Co, (Z+1 relative to Fe) for Fe, and a 3dn+1 electronic configuration was used to add an additional electron to the 3d manifold. These 1s → 3dz2 excited state calculations yielded Fe 3d MO compositions virtually identical to those computed for the ground states of 3 and 4 (changes in contribution of ~1% were observed), and thus, for these complexes, it appears reasonable to use the ground-state MO compositions to gain insight into 1s → 3d transition intensities.
Results and Discussion
Fe K-edge X-ray absorption spectra were obtained for 1, 2, and 3 as solid BN samples and for 4 and 5 in frozen solution. The methods by which 1 – 5 can be generated are shown in Scheme 1. While 1, 2, and 3 could be isolated in pure form, samples of 4 and 5 were prepared in situ by decay of respective 2′ precursors at ambient temperature and −50 °C, respectively, and then frozen. Because 4 itself was thermally unstable via its bimolecular decay to 1, a high purity sample was difficult to obtain at the high concentrations used for our X-ray absorption spectroscopic measurements. Indeed a recently reported Mössbauer study showed that a frozen 0.04 M sample of 4 consisted of a mixture of components, a 35-% fraction corresponding to the nitridoiron(IV) species and a 65-% fraction representing three lower valent species, including 1.17 For our XAS studies, three samples of 4 (4A, 4B, and 4C) were independently prepared and analyzed, and a Mössbauer analysis of 4C revealed that the nitridoiron(IV) complex represented 50% of the sample. On the other hand, 5 was stable at −50 °C and did not undergo bimolecular decay.
Scheme 1.
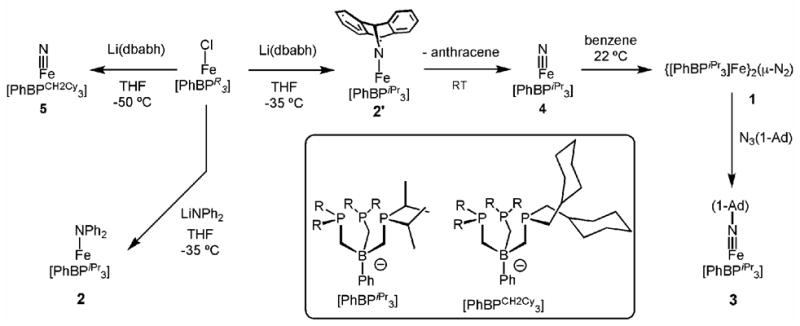
Fe K-edge X-ray absorption spectra are shown in Figure 1. Complexes 1 – 5 exhibit distinct features in the pre-edge region. The total pre-edge peak intensities for 1, 2, and 3 range from 16 to 25 units (Table 1) and compare well to values observed for other tetrahedral iron complexes.30 These pre-edge peaks can be attributed to 1s-to-3d transitions, which are electric quadrupole allowed and can further gain intensity in tetrahedral iron environments from the electric-dipole mechanism due to mixing of 3d and 4p orbitals. Strikingly more intense are the pre-edge features associated with samples of 4 and 5. Samples of 4 have peak areas of 60–70 units for the three preparations studied. Considering that our samples of 4 consist of approximately equal fractions of 4 and of lower valent complexes, which we assume to have an average peak area of 20 units, we can estimate that 4 has an intrinsic peak area of ~100(20) units. In excellent corroboration of this estimate, the much purer sample of 5 exhibits a pre-edge peak area of 92 units. For comparison, the two related six-coordinate nitridoiron complexes reported by Wieghardt, [FeV(cyclam-acetato)(N)]+ and [FeVI(Me3cyclam-acetato)(N)]2+ (cyclam-acetate anion= 1-carboxymethyl-1,4,8,11-tetraazacyclotetradecane; Me3cyclam-acetate anion = 1-carboxymethyl-4,8,11-trimethyl-1,4,8,11-tetraazacyclotetradecane) have pre-edge intensities of 27 and 39 units, respectively.14, 15 A recently reported oxoiron(V) complex has also been found to have a pre-edge peak area of approximately 60 units.31 Thus, the pre-edge peak areas associated with tetrahedral nitridoiron(IV) complexes 4 and 5 are the largest reported to date for a high-valent iron complex.
Figure 1.
Fe K-edge X-ray absorption near-edge structures (XANES, fluorescence excitation) of {[PhBPiPr3]Fe}2(μ-N2), 1 (---, blue), [PhBPiPr3]Fe(NPh2), 2 (—, red), [PhBPiPr3]Fe(NAd), 3 (—, green), a sample containing [PhBPiPr3]Fe(N), 4A (—, black) and [PhBPCH2Cy3]Fe(N), 5 (– - – -, black).
Table 1.
Structural parameters of {[PhBPiPr3]Fe}2(μ-N2), 1, [PhBPiPr3]Fe(NPh2), 2, [PhBPiPr3]Fe(NAd), 3, [PhBPiPr3]Fe(N), 4, and [PhBPCH2Cy3]Fe(N), 5.a
| Complex | Fe–Nb | Fe–Pb | Epre-edge (eV)c | |||||
|---|---|---|---|---|---|---|---|---|
| n | r (Å) | Δσ2 | n | r (Å) | Δσ2 | areac | ||
| 1 | 1 | 1.79 | 4.1 | 3 | 2.35 | 3.8 | 7112.6 | 16.8 |
| [1.793] | [2.357] | |||||||
| 2 | 1 | 1.96 | 2.5 | 3 | 2.46 | 0.6 | 7112.4 | 24.5 |
| [1.953] | [2.457] | |||||||
| 3 | 1 | 1.64 | 0.7 | 3 | 2.27 | 0.9 | 7112.4 | 16.2 |
| [1.638] | [2.273] | |||||||
| 4A (10 mM, C6D6) | 0.5 | 1.52 | 0.3 | 1.5 | 2.21 | 0.3 | 7113.1 | 65 |
| 0.5 | 2.00 | 4 | 1.5 | 2.44 | 2.5 | |||
| 4B (30 mM, C7D8) | 0.5 | 1.54 | 3.7 | 1.5 | 2.24 | 2.5 | 7112.8 | 60 |
| 0.5 | 1.82 | −0.2 | 1.5 | 2.43 | 1.7 | |||
| 4C (30 mM, C6D6) | 0.5 | 1.51 | 2.4 | 1.5 | 2.22 | 3.0 | 7113.0 | 70 |
| 0.5 | 1.95 | 1.4 | 1.5 | 2.45 | 3.0 | |||
| 4 (DFT) | [1.51] | [2.28] | ||||||
| 5 | 1 | 1.55 | 7.4 | 2 | 2.19 | 0.6 | 7113.1 | 92 |
| [FeIV(N4Py)-(NTs)]2+ d | 1.73 | 7113.9 | 18 | |||||
| [FeV(cyclam-acetato)(N)]+ e | 1.61 | 7115.0g | 27 | |||||
| [FeVI(Me3cyclam-acetato)(N)]2+ f | 1.57 | 7115.9g | 39 | |||||
Fourier-transformed range for 1– 5: k = 2–15 Å−1 (resolution 0.12 Å). r is in units Å, Δσ2 in 103 Å2. The typical error of analysis for interatomic distances (r) is approximately ±0.02 Å.33,34 Listed here are the parameters of first-coordination sphere scatterers; see Supporting Information (Tables S2, S4, and S5) for complete fits for all samples.
Values in brackets are from X-ray crystallographic studies (113, 213, 310) and DFT calculations (4).13, 17
XAS pre-edge peak energies are reported as centroids of multiple peaks; intensities are reported as total peak areas (normalized to the edge jump and multiplied by 100). See Supporting Information (Table S1) for detailed peak parameters.
ref. 23.
ref. 14.
ref. 15.
The pre-edge peak energies of complexes 1 – 3 are essentially identical at 7112.5(1) eV (reported as centroids, Table 1), despite the fact that these complexes span three formal oxidation states. This might seem surprising, because the 1s → 3d transition energies typically increase with the oxidation state of the metal. For 1 – 3, we speculate that there is electronic modulation of the electron density at the iron center as a function of the Nx ligand occupying the fourth site. This idea is consistent with a recent Mössbauer study that established remarkably similar isomer shifts for the iron(I) complex 1 and the iron(II) complexes [PhBPiPr3]FeCl and 2′.17 Several factors are likely at play. For example, the π-acidic dinitrogen ligand of 1 to an extent withdraws electron density from the iron(I) center. The phosphine ligands may exert similar effects.17 By contrast, the π-basic imido ligand of 3 donates π electron density to the formally iron(III) center, in this case compensating for the expected decrease in the electron density at the metal in a higher formal oxidation state.
Complex 5 exhibits a pre-edge peak energy at 7113.1 eV, upshifted only 0.6 eV relative to those of 1 – 3 and consistent with the metal-ligand covalency arguments in the previous paragraph. Samples of 4 also show similar values, with an average of 7113.0(1) eV. Although samples of 4 contain a mixture of the nitridoiron(IV) complex and other lower valent species, the contribution of the former dominates due to its much higher intensity. The pre-edge peak energies of 4 and 5 do not appear too unusual when compared with values of other high-valent FeN complexes. They are ca. 0.8 eV lower than that found for an imidoiron(IV) complex (7113.9 eV).23 and 2 eV lower than that found for an nitridoiron(V) complex (7115.0 eV).14 32
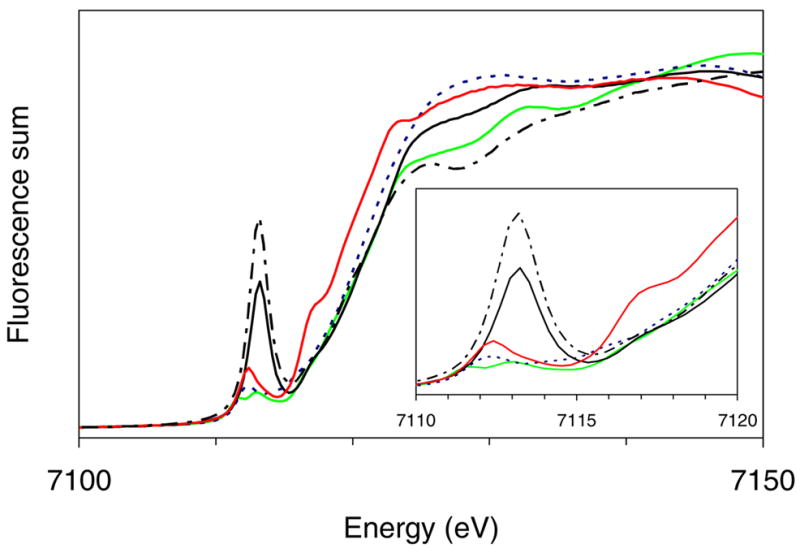
Metal-ligand distances can be extracted from the EXAFS region of the X-ray absorption spectra. We have used the crystallographically characterized compounds 1, 2 and 3 to calibrate our EXAFS analysis of the [PhBPiPr3]FeN complex described here. The Fourier transforms of the Fe K-edge EXAFS data for these complexes each display a prominent feature centered at r′ near 2Å (non-phase-shift-corrected, Figure 2A) that can be attributed to the three phosphorus scatterers of the [PhBPiPr3] ligand. There is a progressive decrease in these values in the order 2, 1 and 3 that corresponds the shortening of the Fe–P bond lengths (rFe–P) from 2.46 to 2.27 Å between high spin 2 (S = 2) to low spin (S = 1/2) 3. A second shorter shell can be introduced in these fits that can be associated with the N scatterer in each of these complexes. The Fe–P and Fe–N distances obtained from fits to the EXAFS spectra match the crystallographically determined distances well (Table 1). In addition, there is a broad feature at r′ near 4.4 Å in the spectrum of 1 (and not observed in the other two complexes) that likely arises from the other Fe center of the linear Fe–N–N–Fe unit, consistent with the Fe···Fe distance of 4.75 Å determined by X-ray crystallography.13
Figure 2.
(A) Fourier transforms of the Fe K-edge EXAFS data (k3χ(k)) of {[PhBPiPr3]Fe}2(μ-N2), 1 (---, blue), [PhBPiPr3]Fe(NPh2), 2 (—, red), [PhBPiPr3]Fe(NAd), 3 (—, green), a sample containing [PhBPiPr3]Fe(N), 4 (—, black), and [PhBPCH2Cy3]Fe(N), 5 (– - – -, black). (B) Fourier transform of the Fe K-edge EXAFS data (k3χ(k)) and Fourier-filtered EXAFS spectrum (k3χ′(k), inset) of 4A: Fourier-transformed range k = 2–15 Å−1; experimental data (···) and fit (—); Back-transformation range: r′ = 0.60–3.80 Å. (C) Fourier transform of the Fe K-edge EXAFS data (k3χ(k)) and EXAFS spectrum (k3χ′(k), inset) of 5: Fourier-transformed range k = 2–15 Å−1; experimental data (···) and fit (—); no Fourier-filtering applied.
Since diffraction quality crystals are not yet available for the nitridoiron(IV) complexes 4 and 5, the analysis of their EXAFS data provides an alternative for obtaining information on the iron-ligand bond lengths. The EXAFS analysis for 5 is presented first, as it is more straightforward to analyze. Complex 5 does not suffer the complications encountered in frozen high-concentration samples of 4 where dimerization of 4 to 1 occurs, resulting in a mixture of species.17 The Fourier-transformed EXAFS spectrum of 5, shown in Figure 2C, shows two principal features at r′ = 1.4 and 1.9 Å that can be associated with the first coordination sphere scatterers. The more intense peak at r′ = 1.9 Å corresponds to the P scatterers of the tridentate supporting ligand with rFe–P = 2.19(2) Å, while the smaller peak at r′ = 1.4 Å corresponds to an N scatterer at 1.55(2) Å. The latter is associated with a Debye-Waller factor that is larger than might be expected for a short Fe–X bond, but such values have also been reported by Wieghardt and co-workers in the analysis of their nitridoiron(V) and nitridoiron(VI) complexes.14, 15 It may also be noted that the introduction of the N scatterer does not result in a large improvement in the goodness-of-fit (GOF) factor (compare fits 2d vs 4d in Table 2). We attribute this to the much greater scattering power of the P scatterers, which dominates the EXAFS spectrum. In support, fits 5d and 6d in Table 2 show the results of fitting χk-weighted data (instead of the usual χk3-weighted data) where the introduction of the N scatterer does exhibit a 30% decrease in the GOF factor.
Table 2.
First-coordination sphere EXAFS fitting results for samples of 4 and 5.a
| Fe–N | Fe–N | Fe–P | Fe–P | GOF | |||||||||
|---|---|---|---|---|---|---|---|---|---|---|---|---|---|
| fit | n | r (Å) | Δσ2 | n | r (Å) | Δσ2 | n | r (Å) | Δσ2 | n | r (Å) | Δσ2 | ε2 · 103 |
| Sample 4A | |||||||||||||
| 1a | 3 | 2.21 | 6.0 | 1.744 | |||||||||
| 2a | 1.5 | 2.21 | 0.3 | 1.5 | 2.43 | 2.7 | 0.885 | ||||||
| 3a | 0.5 | 1.52 | 0.2 | 1.5 | 2.21 | 0.1 | 1.5 | 2.43 | 2.8 | 0.671 | |||
| 4a | 0.5 | 1.52 | 0.2 | 0.5 | 2.00 | 4 | 1.5 | 2.21 | 0.3 | 1.5 | 2.44 | 2.3 | 0.573 |
| 5a | 0.5 | 1.51 | −0.3 | 0.3 | 2.00 | −6.1 | 1.5 | 2.22 | 0.1 | 1.5 | 2.44 | 1.4 | 0.535 |
| 0.2 | 1.86 | −6.0 | |||||||||||
| Sample 4B | |||||||||||||
| 1b | 3 | 2.34 | 19 | 1.087 | |||||||||
| 2b | 1.5 | 2.24 | 2.2 | 1.5 | 2.43 | 1.6 | 0.656 | ||||||
| 3b | 0.5 | 1.53 | 2.9 | 1.5 | 2.23 | 2.1 | 1.5 | 2.43 | 1.6 | 0.601 | |||
| 4b | 0.5 | 1.54 | 3.7 | 0.5 | 1.82 | −0.2 | 1.5 | 2.24 | 2.5 | 1.5 | 2.43 | 1.7 | 0.524 |
| 5b | 0.5 | 1.52 | 4.1 | 0.2 | 1.83 | −3.6 | 1.5 | 2.25 | 3.8 | 1.5 | 2.44 | 2.0 | 0.425 |
| 0.3 | 2.06 | −2 | |||||||||||
| Sample 4C | |||||||||||||
| 1c | 3 | 2.28 | 23 | 1.087 | |||||||||
| 2c | 1.5 | 2.22 | 3.3 | 1.5 | 2.45 | 3.5 | 0.639 | ||||||
| 3c | 0.5 | 1.50 | 2.3 | 1.5 | 2.22 | 3.2 | 1.5 | 2.45 | 3.6 | 0.557 | |||
| 4c | 0.5 | 1.51 | 2.4 | 0.5 | 1.95 | 1.4 | 1.5 | 2.22 | 3.0 | 1.5 | 2.45 | 3.0 | 0.411 |
| 5c | 0.5 | 1.51 | 3.0 | 0.3 | 1.97 | −3 | 1.5 | 2.22 | 2.6 | 1.5 | 2.45 | 2.8 | 0.429 |
| 0.2 | 1.84 | −1 | |||||||||||
| Sample 5 | |||||||||||||
| 1d | 3 | 2.19 | 2.3 | 0.486 | |||||||||
| 2d | 2 | 2.19 | 0.6 | 0.472 | |||||||||
| 3d | 1 | 1.55 | 8.1 | 3 | 2.19 | 2.4 | 0.548 | ||||||
| 4d | 1 | 1.55 | 7.4 | 2 | 2.19 | 0.6 | 0.455 | ||||||
| 5db | 2 | 2.18 | 3.2 | 0.483 | |||||||||
| 6db | 1 | 1.56 | 7.7 | 2 | 2.19 | 0.6 | 0.340 | ||||||
Fourier-transformed range: k = 2–15 Å−1 (resolution 0.12 Å). r is in units Å, Δσ2 in 103 Å2. The typical error of analysis for interatomic distances (r) is approximately ±0.02 Å.33, 34 Back-transformation range: r′ = 0.60–3.80 Å for samples 4A and 4B and r′ = 0.60–3.60 Å for 4C; unfiltered data were used in fits for 5.
Fits to χk data (instead of χk3 data).
The EXAFS analysis of samples 4A–C is consistent with that for 5 (Figures 2B and S5). There are three prominent features observed, centered at r′ ≈ 1.4, 1.8, and 2.1 Å. The features at r′ = 1.8 and 2.1 Å correspond to P scatterers with rFe–P = 2.22(2) and 2.44(2) Å, which we assign to two different [PhBPiPr3]Fe species. Fits with systematically varied coordination numbers for the two shells were evaluated, with the total number of P scatterers fixed at 3. The fit with equal fractions for the two components (n = 1.5) gave the most reasonable Debye-Waller factors for each subshell and a substantial decrease in the goodness-of-fit (GOF) value as compared to a single-shell fit (Table S4). These results are consistent with the Mössbauer analysis and suggest that the high-concentration samples of 4 studied here can be divided into approximately equal amounts of a high-valent fraction with P scatterers at 2.22(2) Å, similar to those found in 5, and a lower-valent fraction with P scatterers at 2.44(2) Å, like those found in 2.
The third feature in the EXAFS spectra of 4 is a peak at r′ ≈ 1.4 Å, which is fit by an N scatterer at 1.52(2) Å with a coordination number of 0.5. Because this distance agrees with the Fe–N distance in 5, this scatterer is assigned to the nitrido of the high-valent fraction of 4. The fits to the data further improve with the inclusion of a N scatterer with a coordination number of 0.5 at 1.82 Å for 4B or at ~2.0 Å for 4A and 4C, which respectively correspond to the N scatterers of 1 and 2. While a further decrease in the GOF value could be obtained by splitting the latter shell into two subshells representing both distances (fits 5a,b,c, Table 2), the fits resulted in subshells with unreasonably negative Debye-Waller factors (Tables S4 and S5). We surmise that the lower valent fraction in samples of 4 consists of a mixture of 1 and 2. Additional evidence for the presence of 1 in the samples of 4 is the appearance of a feature at r′ ≈ 4.4 Å observed only in the spectrum of 1 in this series of complexes that is associated with the Fe scatterer of a linear Fe–N–N–Fe unit. This feature is somewhat more prominent in the 30-mM sample 4B than in the 10-mM sample 4A (compare Figures 2B and S5 bottom), consistent with the expected concentration dependence for the dimerization of 4 to form 1.
The Fe–N distances ranging from 1.51–1.55 Å obtained in the fits for 4 and 5 (Table 2) agree with the value of 1.51 Å predicted by DFT calculations.13, 17 This distance is even shorter than the 1.57 and 1.61 Å Fe–N distances respectively found for the higher-valent six-coordinate nitridoiron(VI) and -iron(V) complexes of the R3cyclam-acetato ligands.14,15 In the series of [PhBPiPr3]Fe complexes probed here, we note the progressive shortening of (i) the Fe–P distances from 2.46 Å for 2 to 2.27 Å for 3 to 2.2 Å for 4 and 5 and (ii) the corresponding Fe–N distances from 1.953 to 1.638 to 1.53 Å, respectively. The major contraction in both Fe–P and Fe–N distances (from 2 to 3) predominantly reflects a change from a high spin to a low spin electronic configuration, while the substantial contraction in the Fe–N distance from 3 to 4 and 5 reflects the expected rehybridization that occurs at nitrogen upon transitioning from a substituted imide to a terminal N-atom functionality.13
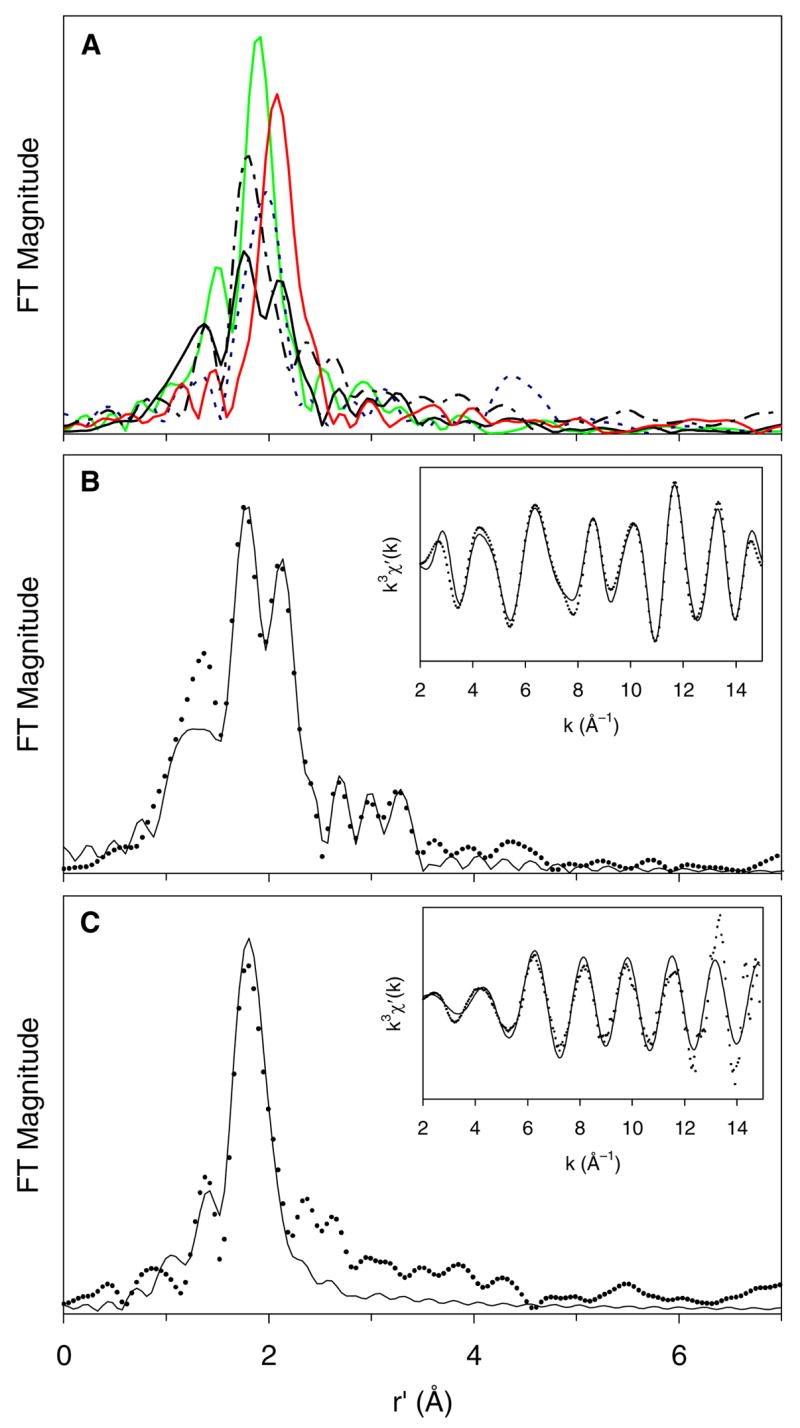
To gain quantitative insight into the geometric and electronic factors that contribute to the pre-edge intensities of these complexes, we compared the results of DFT computations performed for models of 3 and 4. An extensive spectroscopic and computational investigation of a series of FeII and FeIII coordination compounds with different donor ligands and metal ion geometries by Solomon and co-workers demonstrated that there is a direct correlation between pre-edge intensity and the percentage Fe 4p character mixed into the Fe 3d-based MOs.30 Specifically, it was determined that, for FeIII complexes, 1.5 units of pre-edge intensity corresponds to 1% 4p mixing in the 3d manifold. Our DFT computations performed for 3 revealed that the doubly-occupied 3dxy and 3dx2−y2 MOs have ~3% Fe 4p character each, while the Fe 3dz2 MO has 12% 4pz character and the 3dxz and 3dyz MOs have less than 1% 4p character (Table 3). Assuming that 3 has a (3dxy)2(3dx2−y2)2(3dz2)1 configuration, a 1s → 3d transition can terminate either in the Fe 3dz2 or 3dxz/3dyz MOs, corresponding to 2A1 → 2A1 and 2A1 → 2E transitions, respectively, assuming C3v symmetry. Both of these transitions are electric dipole allowed by group theory, but only the former is expected to have considerable intensity on the basis of the much larger 3d/4p mixing in the 3dz2 MO than the 3dxz and 3dyz MOs. In fact, the 12% Fe 4pz character in the 3dz2 MO is predicted to give rise to a pre-edge intensity of 18 units, in remarkably good agreement with the experimental observation of 16.2 units (Table 1). Thus, the pre-edge intensity of 3 can be well accounted for by the relatively large percentage of Fe 4pz character in the 3dz2 MO.
Table 3.
Compositions of spin-down Fe 3d-based MOs for [PhBPiPr3]FeIV(N) (4) and [PhBPiPr3]FeIII(NtBu)a based on DFT Computations.
| MO | Energy (eV) | Occup. | Fe 3d | Fe 4p | N 2p | P 3p |
|---|---|---|---|---|---|---|
| [PhBPiPr3]FeIV(N) | ||||||
| 3dx2−y2 | −3.855 | 1.00 | 69.5 | 3.1 (py) | 7.1 (py + px) | 3.4 (py + px) |
| 3dxy | −3.811 | 1.00 | 66.0 | 3.3 (px) | 7.5 (px + py) | 4.9 (px + py) |
| 3dz2 | −2.164 | 0.00 | 28.3 | 11.8 (pz) | 35.7 (pz) | 8.4 (pz + px) |
| 3dyz | −1.571 | 0.00 | 42.1 | <1.0 | 34.0 (py) | 9.0 (pz + py) |
| 3dxz | −1.542 | 0.00 | 41.9 | <1.0 | 34.3 (px) | 9.0 (pz + px) |
| [PhBPiPr3]FeIII(NtBu)a | ||||||
| 3dx2−y2 | −3.476 | 1.00 | 74.3 | 2.1 (py) | 7.2 (py + px) | 3.0 (py + px) |
| 3dxy | −3.427 | 1.00 | 71.6 | 2.1 (px) | 8.4 (px + py) | 4.1 (px + py) |
| 3dz2 | −3.014 | 0.00 | 56.2 | 12.0 (pz) | 1.9 (pz) | 4.4 (pz + px + py) |
| 3dxz | −1.739 | 0.00 | 49.1 | <1.0 | 22.2 (px + py) | 8.9 (pz + px + py) |
| 3dyz | −1.674 | 0.00 | 50.0 | <1.0 | 22.2 (py + px) | 10.6 (pz + px + py) |
The computational model of 3 was simplified by replacing the adamantyl group with a t-butyl group.
This correlation, however, fails considerably when it is carried on to the FeIV compound 4. Compound 4 exhibits a pre-edge area roughly seven times that of 3 (~100 versus 16.2 units, respectively), whereas our DFT computations show that the percentage of 4pz mixing into the 3dz2 MO of 4 is identical to that of 3 (i.e., 12%; see Table 3). According to the analysis of Westre et al.,30 the correlation between Fe K-edge pre-edge intensity and 4p character in the 3d manifold is dependent on two factors: i) the oscillator strength of a 1s → 4p transition, which becomes larger with increasing effective nuclear charge on the Fe center and ii) the photoionization cross section for the Fe 1s electron. Consequently, a slightly higher ratio of pre-edge intensity per Fe 4p character is expected for an FeIV center than an FeIII center; however this increase cannot account for the remarkably large pre-edge area of 4 relative to 3 and other FeIII complexes. While there might be several reasons for this discrepancy, the most likely rationale could be the significantly higher metal-ligand covalency in the FeIV system, which mixes ligand p character into the 3d MOs. For 3, the 3dz2 MO is almost nonbonding, containing just 6.3% ligand character. In contrast, 4 contains 35.7% N 2p character and 8.4% P 3p character in its corresponding 3dz2 MO, potentially providing an alternative mechanism for gaining pre-edge intensity. These two MO’s are illustrated in Figure 3. Penner-Hahn and co-workers have similarly argued that the large pre-edge intensities of high-valent Mn and Cr complexes with terminal oxo and nitrido ligands derives from metal-ligand covalency.35, 36 Thus, the large pre-edge area of 4 could be attributed to the very short, covalent Fe≡N bond present in this complex.
Figure 3.
Contour plots of Fe 3dz2-based MOs of [PhBPiPr3]FeIV(N) (left) and [PhBPiPr3]FeIII(NtBu) (right) based on DFT computations. The contributions to the MOs from the dominant iron, nitrogen, and phosphorus orbitals are listed.
To summarize, we have characterized [PhBPR3]Fe(N) complexes 4 and 5 by X-ray absorption spectroscopy to obtain direct spectroscopic evidence for a very short Fe–N distance. The distance of 1.51–1.55 Å manifests the Fe≡N triple bond in accord with the observed FeN vibration for 4 (νFeN = 1034 cm−1)13 and supporting DFT calculations.17 This highly covalent bonding interaction results in the appearance of an unusually intense pre-edge peak with an area of 92 units, which is much larger than those of the related tetrahedral complexes with FeI–N2–FeI, FeII–NPh2, and FeIII≡NAd motifs and those of recently described six-coordinate FeV≡N and FeVI≡N complexes.14, 15 Compared to the oxoiron(IV) unit prevalent in the catalytic cycles of heme and nonheme iron enzymes,1 the nitridoiron(IV) unit of [PhBPR3]Fe(N) has a much shorter iron-to-ligand multiple bond length, as well as higher pre-edge peak intensity, consistent with the π basicity of the nitrido ligand being greater than that for the oxo ligand.
Supplementary Material
Fe K-edge EXAFS spectra and detailed EXAFS fitting protocols of all compounds (Figure S1 and Tables S2 – S5); fits (Fourier transformed and Fourier-filtered EXAFS data) for 1, 2, 3, 4B, and 4C (Figures S2 – S5). This material is available free of charge via the Internet at http://pubs.acs.org.
Acknowledgments
This work was supported by NIH grants GM-33162 (L.Q.) and GM-070757 (J.C.P.) and postdoctoral fellowship FGM075700 (T.A.J.). We are also grateful for a Department of Defense Graduate Fellowship for T.A.B. and a National Science Foundation Pre-doctoral Fellowship for C.T.S. XAS data were collected on beamline 9-3 at the Stanford Synchrotron Radiation Laboratory (SSRL) and beamline X9B at the National Synchrotron Light Source (NSLS). The SSRL Structural Molecular Biology Program is supported by the Department of Energy, Office of Biological and Environmental Research, and by the National Institutes of Health, National Center for Research Resources, Biomedical Technology Program. NSLS is supported by the U.S. Department of Energy, Office of Science, Office of Basic Energy Sciences, under Contract No. DE-AC02-98CH10886. We thank Dr. Matthew J. Latimer at SSRL and Dr. Nebojsa S. Marinkovic at NSLS for their excellent technical support of our synchrotron experiments, Prof. Michael P. Hendrich and Mr. William Gunderson of Carnegie Mellon University for obtaining a Mössbauer spectrum of sample 4C, and Professor Thomas Brunold of the University of Wisconsin-Madison for graciously providing access to his computer cluster.
References
- 1.Shan X, Que L., Jr J Inorg Biochem. 2006;100:421–433. doi: 10.1016/j.jinorgbio.2006.01.014. [DOI] [PubMed] [Google Scholar]
- 2.Mehn MP, Peters JC. J Inorg Biochem. 2006;100:634–643. doi: 10.1016/j.jinorgbio.2006.01.023. [DOI] [PubMed] [Google Scholar]
- 3.Costas M, Mehn MP, Jensen MP, Que L., Jr Chem Rev. 2004;104:939–986. doi: 10.1021/cr020628n. [DOI] [PubMed] [Google Scholar]
- 4.Bollinger JM, Jr, Price JC, Hoffart LM, Barr EW, Krebs C. Eur J Inorg Chem. 2005:4245–4254. [Google Scholar]
- 5.Howard JB, Rees DC. Chem Rev. 1996;96:2965–2982. doi: 10.1021/cr9500545. [DOI] [PubMed] [Google Scholar]
- 6.Oldenburg PD, Que L., Jr Catalysis Today. 2006;117:15–21. [Google Scholar]
- 7.Chen K, Costas M, Que L., Jr Dalton Trans. 2002:672–679. [Google Scholar]
- 8.Bart SC, Lobkovsky E, Bill E, Chirik PJ. J Am Chem Soc. 2006;128:5302–5303. doi: 10.1021/ja057165y. [DOI] [PubMed] [Google Scholar]
- 9.Brown SD, Peters JC. J Am Chem Soc. 2005;127:1913–1923. doi: 10.1021/ja0453073. [DOI] [PubMed] [Google Scholar]
- 10.Betley TA, Peters JC. J Am Chem Soc. 2003;125:10782–10783. doi: 10.1021/ja036687f. [DOI] [PubMed] [Google Scholar]
- 11.Brown SD, Betley TA, Peters JC. J Am Chem Soc. 2003;125:322–323. doi: 10.1021/ja028448i. [DOI] [PubMed] [Google Scholar]
- 12.Thomas CM, Mankad NP, Peters JC. J Am Chem Soc. 2006;128:4956–4957. doi: 10.1021/ja0604358. [DOI] [PMC free article] [PubMed] [Google Scholar]
- 13.Betley TA, Peters JC. J Am Chem Soc. 2004;126:6252–6254. doi: 10.1021/ja048713v. [DOI] [PubMed] [Google Scholar]
- 14.Aliaga-Alcalde N, George SD, Mienert B, Bill E, Wieghardt K, Neese F. Angew Chem Int Ed. 2005;44:2908–2912. doi: 10.1002/anie.200462368. [DOI] [PubMed] [Google Scholar]
- 15.Berry JF, Bill E, Bothe E, George SD, Mienert B, Neese F, Wieghardt K. Science. 2006;312:1937–1941. doi: 10.1126/science.1128506. [DOI] [PubMed] [Google Scholar]
- 16.Wagner WD, Nakamoto K. J Am Chem Soc. 1989;111:1590–1598. [Google Scholar]
- 17.Hendrich MP, Gunderson W, Behan RK, Green MT, Mehn MP, Betley TA, Lu CC, Peters JC. Proc Natl Acad Sci USA. 2006;103:17107–17112. doi: 10.1073/pnas.0604402103. [DOI] [PMC free article] [PubMed] [Google Scholar]
- 18.Brown SD, Peters JC. J Am Chem Soc. 2004;126:4538–4539. doi: 10.1021/ja0399122. [DOI] [PubMed] [Google Scholar]
- 19.George GN, Pickering IJ. EXAFSPAK, Stanford Synchrotron Radiation Laboratory. Stanford Linear Accelerator Center; Stanford, California: 2000. [Google Scholar]
- 20.Scarrow RC, Trimitsis MG, Buck CP, Grove GN, Cowling RA, Nelson MJ. Biochemistry. 1994;33:15023–15035. doi: 10.1021/bi00254a011. [DOI] [PubMed] [Google Scholar]
- 21.Rohde JU, Torelli S, Shan X, Lim MH, Klinker EJ, Kaizer J, Chen K, Nam W, Que L., Jr J Am Chem Soc. 2004;126:16750–16761. doi: 10.1021/ja047667w. [DOI] [PubMed] [Google Scholar]
- 22.Rohde JU, Stubna A, Bominaar EL, Münck E, Nam W, Que L., Jr Inorg Chem. 2006;45:6435–6445. doi: 10.1021/ic060740u. [DOI] [PubMed] [Google Scholar]
- 23.Klinker EJ, Jackson TA, Jensen MP, Stubna A, Juhász G, Bominaar EL, Münck E, Que L., Jr Angew Chem Int Ed. 2006;45:7394–7397. doi: 10.1002/anie.200602799. [DOI] [PubMed] [Google Scholar]
- 24.te Velde G, Baerends EJ. J Comput Phys. 1992;99:84–98. [Google Scholar]
- 25.Guerra CF, Snijders JG, te Velde G, Baerends EJ. Theor Chem Acc. 1998;99:391–403. [Google Scholar]
- 26.ADF2003.01 SCM. Theoretical Chemistry. Vrije Universiteit; Amsterdam, The Netherlands: http://www.scm.com. [Google Scholar]
- 27.Vosko SH, Wilk L, Nusair M. Can J Phys. 1980;58:1200. [Google Scholar]
- 28.Becke AD. J Chem Phys. 1986;84:4524–4529. [Google Scholar]
- 29.Perdew JP. Phys Rev B. 1986;33:8822–8824. doi: 10.1103/physrevb.33.8822. [DOI] [PubMed] [Google Scholar]
- 30.Westre TE, Kennepohl P, DeWitt JG, Hedman B, Hodgson KO, Solomon EI. J Am Chem Soc. 1997;119:6297–6314. [Google Scholar]
- 31.Tiago de Oliveira F, Chanda A, Banerjee D, Shan X, Mondal S, Que L, Jr, Bominaar EL, Münck E, Collins TJ. Science. 2007;315:835–838. doi: 10.1126/science.1133417. [DOI] [PubMed] [Google Scholar]
- 32.See footnote g of Table 1.
- 33.Scott RA. In: Physical Methods in Bioinorganic Chemistry. Spectroscopy and Magnetism. Que L Jr, editor. University Science Books; Sausalito, CA: 2000. pp. 465–503. [Google Scholar]
- 34.Scott RA. Methods Enzymol. 1985;117:414–459. doi: 10.1016/s0076-6879(85)17026-6. [DOI] [PubMed] [Google Scholar]
- 35.Weng TC, Hsieh WY, Uffelman ES, Gordon-Wylie SW, Collins TJ, Pecoraro VL, Penner-Hahn JE. J Am Chem Soc. 2004;126:8070–8071. doi: 10.1021/ja0494104. [DOI] [PubMed] [Google Scholar]
- 36.Penner-Hahn JE, Benfatto M, Hedman B, Takahashi T, Doniach S, Groves JT, Hodgson KO. Inorg Chem. 1986;25:2255–2259. [Google Scholar]
Associated Data
This section collects any data citations, data availability statements, or supplementary materials included in this article.
Supplementary Materials
Fe K-edge EXAFS spectra and detailed EXAFS fitting protocols of all compounds (Figure S1 and Tables S2 – S5); fits (Fourier transformed and Fourier-filtered EXAFS data) for 1, 2, 3, 4B, and 4C (Figures S2 – S5). This material is available free of charge via the Internet at http://pubs.acs.org.