

Abstract
A one pot synthetic procedure yields the octanuclear FeIII-complexes Fe8(μ4-O)4(μ-pz*)12X4, where X = Cl and pz* = pyrazolate anion (pz = C3H3N2-) (1), 4-Cl-pz (2) and 4-Me-pz (3), or X = Br and pz* = pz (4). The crystal structures of complexes 1 – 4, determined by X-ray diffraction, show an Fe4O4-cubane core encapsulated in a shell composed of four interwoven Fe(μ-pz*)3X-units. Complexes 1 – 4 have been characterized by 1H-nmr, infrared and Raman spectroscopy. Mössbauer spectroscopic analysis distinguishes the cubane and outer FeIII-centers by their different isomer shift and quadrupole splitting values. Electrochemical analyses by cyclic voltammetry show four consecutive, closely spaced, reversible reduction processes for each one of the four complexes. Magnetic susceptibility studies, corroborated by Density Functional Theory calculations, reveal weak antiferromagnetic coupling among the four cubane Fe-centers and strong antiferromagnetic coupling between cubane and outer Fe-atoms of 1. The structural similarity between the antiferromagnetic Fe8(μ4-O)4-core of 1 – 4 and the also antiferromagnetic units contained in the minerals ferrihydrite and maghemite is demonstrated by X-ray and Mössbauer data.
Introduction
We describe here the syntheses, structural characterization and physical properties of four octanuclear FeIII-complexes containing a common redox-active Fe4O4-cubane core, along with arguments supporting the suggestion that a future discovery of an electron-transfer protein with a Fe4O4 active-center is not an unreasonable expectation. Iron-sulfur cubanes able to cycle between two (or more) oxidation states constitute the electron-transfer components of several ferredoxins involved in biological redox processes.1 Consequently, the study of model complexes containing Fe4S4-cubane cores has been a central theme of bioinorganic Chemistry over the last thirty years.2 While no redox-active Fe4O4-cubane core has been unequivocally characterized in a metalloprotein, examples of protein active-centers consisting of Fe/O-containing cubanes are known: A unique redox-active Fe4O2S2-cluster has been recognized in the active core of hybrid cluster protein (HCP, formerly termed prismane protein).3 The HCP of E. coli catalyses the 2-electron reduction of hydroxylamine to ammonia.4 Similar hydroxylamine reductase activity results from the insertion of Fe into the vacant site of Ni-deficient carbon monoxide dehydrogenase (Ni-CODH, with an Fe3NiO4-cubane core5), creating in a sense Fe-CODH.4 In a recent Fe K-edge X-ray absorption spectroscopic study, Hogdson et al. have shown that a protein isolated from the blood of Perophora annectens contains a Fe4O4-core in either a cubane or a ladder arrangement, with the authors leaning towards the cubane assignment.6 The absence of a well characterized Fe4O4 electron-transfer protein cannot simply be due to a scarcity of components - oxo and hydroxo ligands are readily available in Nature and metal-oxo active cores are present in numerous metalloproteins, including the Fe2O2-cores of ribonucleotide reductase, purple acid phosphatase and soluble methane monooxygenase.7 A structure containing fused cubanes with 6-coordinate Fe-centers is also one of the possible models consistent with the EXAFS studies of ferritin, the mammalian iron-storage protein, containing a few thousand FeIII-centers.8
Several synthetic iron complexes containing the Fe4O4-motif with FeII or mixed-valent FeII/III centers have been reported to date.9-19 These are either Fe4O4-carboxylate complexes, or larger polynuclear carboxylates containing Fe4O4-units. Our contribution to this field consists of a preliminary account of the simple, one-pot synthesis and structural characterization of an octanuclear FeIII-cluster, Fe8(μ4-O)4(μ-pz)12Cl4 (pz = pyrazolato anion, C3H3N2-), 1, containing an FeIII4O4-cubane core.20 The latter, along with the recently characterized [Fe8IIIO4(sao)8(py)4].4py,19 (sao = salicylaldoximato; py = pyridine) constitute the only examples of all-ferric oxo cubanes. Furthermore, we have shown that 1 can reversibly accept up to four electrons in four consecutive electrochemical steps, spaced approximately 0.35 V from each other.20 The first reduction occurs at the modest potential of −0.43 V, while the fourth one lies at −1.38 V (versus Fc+/Fc); compound 1 can shuttle four electrons across a redox potential window of ∼1.1 V. Consequently, the redox properties of 1 show it to be a more efficient electron-transfer agent than any of the naturally occurring, or synthetic, Fe4S4 clusters.21 The question that arises, then, is the following: why has Nature apparently ignored such a simple and efficient redox catalyst in favor of its sulfur analogues? It can be argued that Nature's preference for sulfur-based cubanes arises simply because ferredoxins are believed to have evolved during a pre-photosynthetic geological period in an anoxic, sulfur-rich environment.22 However, proteins are able to mutate to adapt to their changing environment by switching from depleted to readily available elements. For example, oxygen-for-sulfur substitution is known in the cases of rubredoxin from c. pasteurianum, which switches from an Fe(S-cyst)4-core to a Fe(S-cyst)3(OH) one, while the Fe4(S-cys)4 active center of c. vinosum switches to Fe4(S-cys)3(O-ser).23 Consequently, it is quite possible that an initially sulfur-based multi-iron protein may later have evolved into an oxygen-based one. Noting also that many metalloproteins remain to be discovered, Lippard et al. and we have suggested that an electron-transfer protein with a Fe4O4 active center may be recognized in the future.15,20
Continuing our studies of the octanuclear cluster 1, we report here the magnetic susceptibility, Density Functional Theory (DFT) study, infrared, Raman, 1H-NMR and Mössbauer spectroscopic characterization of 1, along with the syntheses, structural characterization and electrochemical studies of its substituted-pyrazole derivatives, Fe8(μ4-O)4(μ-pz*)12Cl4, where pz* = 4-Cl-pz (2) and 4-Me-pz (3), along with the bromo-analogue, Fe8(μ4-O)4(μ-pz)12Br4, 4. These studies probe the electronic structure of the Fe4O4 motif and define its spectroscopic and magnetic “fingerprint”, facilitating its possible future recognition in Nature.
Experimental Section
FeCl3, FeBr3, pyrazole (pzH), 4-Me-pyrazole (4-Me-pzH), NaH and Et3N were obtained from commercial sources and used as received. Napz was prepared from pzH and NaH. 4-Cl-pyrazole (4-Cl-pzH) was prepared by a literature method.24 Solvents (CH2Cl2, methanol, acetone, diethyl ether, tetrahydrofuran, hexane) were purified by standard methods.25
[Fe8(μ4-O)4(μ-pz)12Cl4] (1)
To a suspension of FeCl3 (3.120g, 19.23 mmol) in CH2Cl2 (200 ml) was added Napz (2.598g, 28.85 mmol) under an Ar atmosphere with stirring. The reaction mixture was exposed to air, sealed and kept under stirring at ambient temperature for 20 h. The resulting dark brown solution was then filtered, the filtrate was collected in a round-bottomed flask and the solvent was evaporated under reduced pressure. The resulting solid was dissolved in the minimum amount of CH2Cl2 with which was charged a silica gel chromatographic column (60-120 mesh, Aldrich) prepared with toluene. The dark orange portion eluted with CH2Cl2 was collected in a round-bottomed flask, the solvent was removed in a rotary evaporator, the product was air dried, then washed with dry MeOH and then dried in a vacuum desicator over CaCl2. X-ray quality dark red crystals were obtained upon recrystallization by slow Et2O-vapor diffusion into a CH2Cl2 solution of 1. Yield 1.07 g (30%). UV/VIS/NIR (CH2Cl2): λmax = 360 nm (27788 cm-1), ε = 37000 cm-1 mol-1 dm3. IR (KBr disk): 1490(m), 1417(m), 1362(vs), 1268(vs), 1170(m), 1145(w), 1045(vs), 963(w), 915(w), 895(w), 871(w), 764(s), 615(m), 556(w), 478 (vs, br Fe-O). 1H NMR (δ, ppm, CDCl3): 42.2 (s, 1 H, 4H), 10.5 (s, 1 H, 3H), 3.5 (s, 1 H, 5H).
[Fe8(μ4-O)4(μ-4-Cl-pz)12Cl4] (2)
To a suspension of FeCl3 (0.586 g, 3.61 mmol) in CH2Cl2 (200mL) was added 4-Cl-pyrazole (0.556g, 5.42 mmol) under an Ar atmosphere with stirring. To the resulting solution, Et3N (0.629 ml, 4.52 mmol) was added dropwise with stirring under Ar. Then the reaction mixture was exposed to air, sealed and kept under stirring at room temperature for 20 h. Then the resulting dark brown solution was filtered and worked-up in similar way as described for 1. X-ray quality single crystals were grown by slow evaporation of a CH2Cl2 solution of 2. Yield: 2.70 g (40%). Anal. Calcd for C40H40Cl18Fe8N24O4: C, 22.36; H, 1.88; N, 15.64. Found: C, 22.61; H, 1.93; N, 15.36. UV/VIS/NIR (CH2Cl2): λmax = 363 nm (27639 cm-1). The 18O-isotopically labeled complex 2 was prepared as above, except that 0.05 mL H218O was added to the reaction mixture under an Ar atmosphere, instead of exposing it to the air. IR (KBr disk): 1384(m), 1354(m), 1315(w), 1297(vs), 1217(w), 1189(s), 1151(w), 1041(vs), 993(w), 967(m), 855(w), 608(s), 528(w), 475(vs, br Fe-O). 1H NMR (δ, ppm, CDCl3): 13.7 (s, 1 H, 3H), 8.6 (s, 1 H, 5H).
[Fe8(μ4-O)4(μ-4-Me-pz)12Cl4] (3)
To a suspension of FeCl3 (0. 967 g, 5.96 mmol) in CH2Cl2 (200 ml) was added 4-Me-pyrazole (1.48ml, 17.9 mmol) under an Ar atmosphere with stirring. To the resulting solution, Et3N (2.08 ml, 14.9 mmol) was added dropwise with stirring under Ar. Then the reaction mixture was exposed to air, sealed and kept under stirring at room temperature for 20 h. Then the resulting dark brown solution was filtered and worked-up in similar way as described for 1 and 2. Yield: 5.59 g (57%). Anal. Calcd for C48H60Cl4Fe8N24O4: C, 35.46; H, 3.72; N, 20.68. Found: C, 36.14; H, 4.04; N, 20.53. UV/VIS/NIR (CH2Cl2): λmax = 376 nm (26848 cm-1). IR (KBr disk):1389(w), 1355(s), 1311(s), 1216(w), 1165(m), 1054(vs), 1012(m), 846(m), 674(m), 617(s), 555(w), 478(vs, br Fe-O). 1H NMR (δ, ppm, CDCl3): 27.7 (s, 3 H, Me), 8.6 (s, 1 H, 3H), 3.8 (s, 1 H, 5H).
[Fe8(μ4-O)4(μ-pz)12Br4] (4)
To a suspension of FeBr3 (0.371 g, 1.26 mmol) in CH2Cl2 (15 ml) prepared under argon atmosphere was added solid pyrazole (0.256 g, 3.77 mmol) under air with stirring. To the red solution was added drop wise with stirring triethylamine (0.437 ml, 3.14 mmol). After stirring for 10 min, the mixture was filtered and filtrate was placed into a Schlenk tube and stirred under nitrogen for 6 days. The volume of the reaction mixture was reduced to 5 mL under vacuum, stirred overnight and filtered under nitrogen. The filtrate was evaporated to dryness, washed with methanol (22 ml) and recrystallized from diethyl ether (40 ml) and subsequently from CH2Cl2 (6 ml). Product was collected by filtration, washed with methanol, and dried. Yield: 0.821 g (40%). Anal. Calcd for C36H36Br4Fe8N24O4: C, 26.44; H, 2.22; N, 20.56. Found: C, 26.24; H, 2.37; N, 20.38. UV/VIS/NIR (CH2Cl2): λmax = 399 nm (25728 cm-1). IR (KBr disk): 1491(m), 1417(m), 1362(s), 1266(s), 1230(w), 1168(s), 1076(w), 1044(vs), 764(s), 614(m), 552(w), 477(vs, br Fe-O). 1H NMR (δ, ppm, CDCl3): 42.9 (s, 1 H, 4H), 10.7 (s, 1 H, 3H), 1.0 (s, 1 H, 5H).
Physical Measurements
Electronic spectra of the complexes in solution were recorded on Varian CARY 500 Scan in the 200-2000 nm range. Infrared spectra (KBR and/or polyethylene pellets) were recorded on Nicolet 750 FTIR spectrophotometers. The Raman spectra of the solid samples in the form of powders were recorded at room temperature in backscattering geometry. Excitation at 488 nm was provided by a Lexel 95 Argon ion laser system, with applied laser power of 5–10 mW. The scattered light was dispersed by a triple-grating spectrometer (Jobin-Yvon, Edison, NJ) and the spectra were recorded by a liquid nitrogen cooled CCD camera (CCD3000 from Jobin-Yvon). 1H NMR were recorded on Bruker ADVANCE DRX-500 spectrometer. Mössbauer spectra were recorded with powdered samples of 1 with a constant-acceleration conventional spectrometer with a source of 57Co (Rh matrix). Spectra in the 4.2-300 K range were obtained using Oxford cryostats. One cryostat was equipped with a superconducting magnet with the magnetic field perpendicular to the γ-rays. The spectra were analyzed by using the program WMOSS (Web Research, Edina, MN). Isomer shift values (δ) are reported relative to iron foil at 293 K. Temperature dependent (2-298 K) magnetic susceptibility data were recorded on SQUID magnetometer in an external magnetic field of 1 T. A correction to the underlying diamagnetism was estimated on the basis of Pascal constants as χdia = −7.45×10⁻⁹ m3mol−1.26 The effective magnetic moment is calculated in SI units as μeff / μB = 798[(χmol − χdia)T]1/2.
Computational methods
All calculations described in this paper were done using spin-unrestricted density functional theory as implemented in the GAUSSIAN 03 program, version D.02.27 The B3LYP functional28 was used throughout, in conjunction with the LANL2DZ basis set and associated effective core potential for Fe and Cl,29 and Dunning's D95 basis set for C, N, O and H (856 basis functions in total).30 The geometry of the Fe8 cluster, Fe8(μ4-O)4(μ-pz)12Cl4, was taken from our previously published paper20, with no imposed symmetry constraints. Calculations on the broken-symmetry (MS = 0) states were done using the converged high-spin (MS = 20) density as an initial guess. Convergence to the required states with a local high-spin (MS = 5/2) configuration at each Fe-center was then achieved in several steps using the guess=permute and guess=alter keywords.31
X-ray Crystallographic Data Collection and Refinement of the Structure
Suitable crystals for X-ray measurement for 1 and 4 were obtained by recrystallization of compounds from dichloromethane. For 2 and 3, crystals of suitable quality were obtained directly from reactions similar to the ones described above. Crystals were selected from a mixture of cluster and side products, which crystallize as the first solid fraction directly after synthesis. That fraction typically contains well developed crystals of 2 or 3 together with colorless crystals of triethylammonium chloride.
X-ray diffraction data, collected from a single crystals mounted atop glass fibers with a Siemens SMART 1K CCD diffractometer,32a were corrected for Lorentz and polarization effects.32b The structures were solved employing the SHELX-9032c program and refined by least-squares method on F2, SHELXTL-93,32d incorporated in SHELXTL, Version 5.1.32e Crystallographic details for 1, 2, 3, and 4 are summarized in Table 1.
Table 1.
Crystallographic data for 1, 2, 3, and 4.
| 1 | 2 | 3 | 4 | |
|---|---|---|---|---|
| formula | C36H36Cl4Fe8N24O4 | C36H24Cl16Fe8N24O4 | C48H62Cl4Fe8N24O5 | C36H36Br4Fe8N24O4 |
| crystal size, mm3 | 0.22 × 0.20 × 0.08 | 0.29 × 0.29 × 0.15 | 0.12 × 0.08 × 0.02 | 0.34 × 0.05 × 0.04 |
| fw | 1457.49 | 1870.79 | 1643.82 | 1635.33 |
| space group | P21/n (No.14) | Fd-3 (No. 203) | P-1 (No. 2) | P21/n (No. 14) |
| a, Å | 12.660(4) | 25.934(2) | 13.187(2) | 12.847(2) |
| b, Å | 21.519(6) | 25.934(2) | 13.601(2) | 21.517(4) |
| c, Å | 20.065(6) | 25.934(2) | 21.461(3) | 20.030(4) |
| α, ° | 90 | 90 | 87.545(3) | 90 |
| β, ° | 92.976(5) | 90 | 80.550(3) | 93.492(3) |
| γ, ° | 90 | 90 | 71.250(3) | 90 |
| V, Å3 | 5459(3) | 17442(2) | 3595.2(10) | 5526.5(17) |
| Z | 4 | 8 | 2 | 4 |
| T, K | 298(2) | 299(2) | 302(2) | 298(2) |
| ρcalcd, g cm-3 | 1.773 | 1.425 | 1.518 | 1.965 |
| reflctns collected/2θmax | 23089/46.60 | 18404/55.96 | 16013/46.54 | 27721/50.50 |
| Unique reflctns/I > 2σ(I) | 7838/4631 | 1058/916 | 10301/4898 | 9938/4290 |
| No. of params/restraints | 685/0 | 67/0 | 833/0 | 685/0 |
| μ(Mo Kα), mm-1 | 2.321 | 1.825 | 1.772 | 4.991 |
| F(000) | 2912 | 7360 | 1668 | 3200 |
| R1a/goodness of fitb | 0.0739/1.080 | 0.0431/1.292 | 0.0511/0.864 | 0.0589/0.933 |
| wR2c (I > 2σ(I)) | 0.1576 | 0.1552 | 0.1036 | 0.1058 |
I > 2σ(I). R1 = Σ||Fo| - |Fc ||/Σ|Fo|.
GooF = [Σ[w(Fo2 − Fc2)2]/(n − p)]1/2.
wR2 = [Σ[w(Fo2 − Fc2)2]/Σ[w(Fo2)2]]1/2, where w = 1/σ2(Fo2) + (aP)2 + bP, P = (Fo2 + 2Fc2)/3.
Results and Discussion
The reactions of anhydrous FeX3, X = Cl, Br, with pyrazole, or 4-substituted pyrazole, in CH2Cl2 under an inert atmosphere give bright red products, which consist of mixtures of FeX3(pz*H)3 and [FeX2(pz*H)4][FeX4].33 Further addition of NEt3 to that mixture (to deprotonate the pyrazole ligands) and exposure to air results in the formation of dark red octanuclear clusters 1 – 4, which have been characterized in solution as well as in the solid state. During recrystallization of 2 and 3, solvent molecules are trapped in interstitial cavities between the approximately spherical cluster molecules resulting in the overall formula [Fe8(μ4-O)4(μ-4-Cl-pz)12Cl4]·2CH2Cl2·1/2THF·4H2O for 2 and [Fe8(μ4-O)4(μ-4-Me-pz)12Cl4]·H2O for 3. The presence of solvent molecules in 2 was detected by 1H-nmr and IR spectroscopies and supported by elemental analysis results, while the water molecule of 3 was identified during the crystal structure study. Slow water loss causes crystal decomposition of 3 with time; its elemental analysis was calculated for water-free sample.
X-Ray Crystallography
The crystal structures of 1 – 4 (Figure 1) consist of a Fe4O4-cubane encapsulated inside a shell of four Fe(pz*)3Cl units (the crystal structure of the hexane solvate of 1 has been previously communicated20). Bond lengths and angles for 1 – 4 are summarized in Table 2. While the inorganic Fe8(μ4-O)4 cores of 1-4 are tetrahedral, the pyrazole ligands are tilted out of the mirror plane positions, thus reducing the point group symmetry from Td to T; the 4 C3- and 3 C2-axes of the T point group are running parallel to the Cl-Feo-O…Fec axes and through the centers of opposite Fe2O2 faces of the cubane, respectively. Within the Fe4O4 cubanes, the Fe-O bonds range from 2.03 to 2.07 Å, while the Fe-O-Fe and O-Fe-O angles vary from 96.5 to 99.0 and from 80.7 to 82.9°, respectively. The Fe2O2-faces of the cubane-cores deviate only slightly from planarity, in contrast to the Fe2S2-butterfly arrangement in Fe4S4-cubanes. Both, Fe-O and Fe-N bonds, are slightly shorter for the 5-coordinate outer Fe-atoms (Feo) compared to those of 6-coordinate cubane Fe-atoms (Fec). The introduction of an electron-withdrawing (Cl, 2), or an electron-releasing (Me, 3) substituent at the pyrazole 4-position, or the replacement of terminal chlorine by bromine ligands (4) have no significant effect on the structural parameters of the Fe4O4-cubanes, which remain practically invariant, in all four structures.
Figure 1.
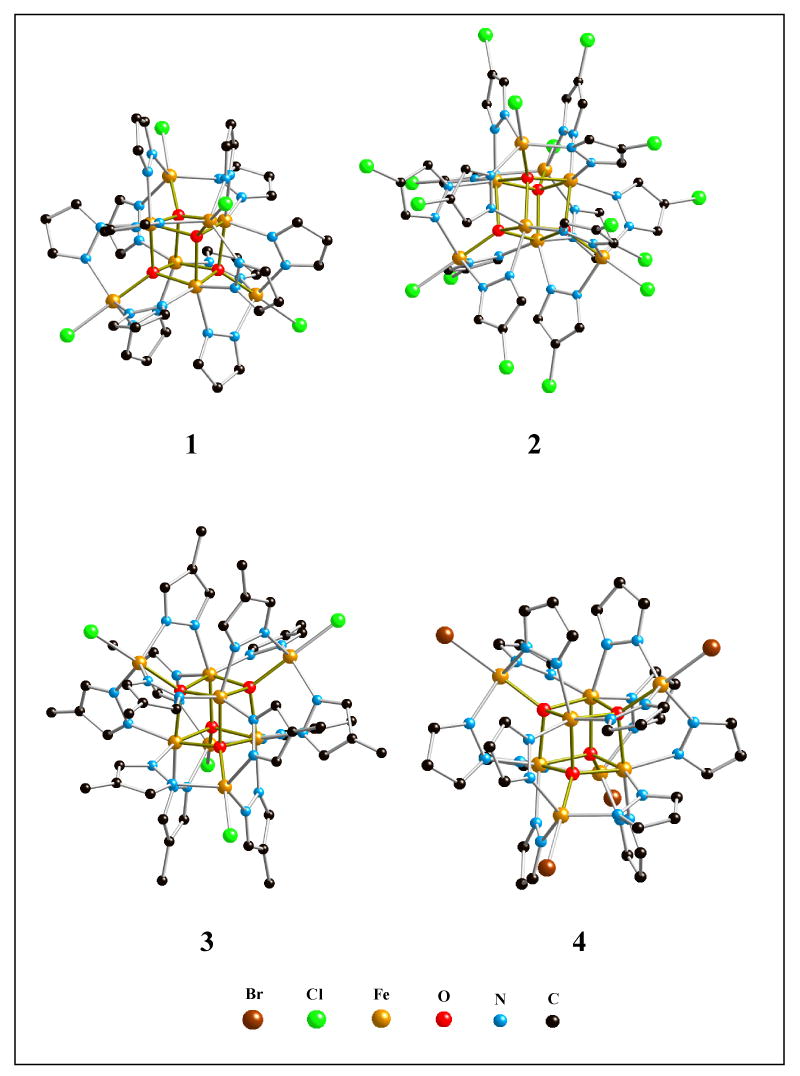
Ball-and-stick diagrams of 1, 2, 3 and 4.
Table 2.
Selected Bond Distances (Å) and Interatomic Angles (°) for 1, 2, 3, and 4.
| 1 | 2 | 3 | 4 | |
|---|---|---|---|---|
| Fec − O | 2.032(6)-2.066(7) | 2.047(2) | 2.028(5)-2.066(5) | 2.033(6)-2.060(6) |
| Fec − N | 2.044(9)-2.086(8) | 2.101(3) | 2.044(7)-2.080(7) | 2.048(9)-2.090(8) |
| Fec⋯Fec | 3.067(2)-3.091(2) | 3.073(2) | 3.055(2)-3.112(2) | 3.056(2)-3.090(2) |
| Fec − O − Fec | 96.5(3)-98.4(3) | 97.3(2) | 96.6(2)-99.0(2) | 96.5(2)-98.7(3) |
| O − Fec − O | 81.1(3)-82.7(3) | 82.2(2) | 80.7(2)-82.7(2) | 81.1(2)-82.9(2) |
| Feo − O | 1.940(7)-1.960(6) | 1.930(4) | 1.950(5)-1.970(5) | 1.943(6)-1.954(6) |
| Feo − X | 2.271(4)-2.274(4) | 2.293(2) | 2.284(2)-2.291(2) | 2.421(2)-2.425(2) |
| Feo − N | 2.003(9)-2.038(10) | 2.028(3) | 2.002(7)-2.034(6) | 2.008(9)-2.048(9) |
| O − Feo − X | 176.9(2)-179.5(2) | 180.0(1) | 177.7(2)-179.4(2) | 176.6(2)-178.9(2) |
| N − Feo − N | 114.1(4)-124.4(4) | 119.6(1) | 114.5(3)-123.7(3) | 113.5(3)-125.2(3) |
| Feo⋯Feo | 5.841(3)-5.888(2) | 5.843(2) | 5.808(2)-5.954(2) | 5.835(2)-5.895(2) |
| Feo⋯Feca | 3.425(2)-3.481(2) | 3.4432(8) | 3.437(2)-3.488(2) | 3.426(2)-3.487(2) |
| Feo⋯Feca | 5.462(2)-5.483(3) | 5.460(1) | 5.472(2)-5.491(2) | 5.457(2)-5.484(2) |
There are three short and one long Feo⋯Fec distances per Fe-atom, between the verteces of co-centrical tetrahedra formed by the four Fec and four Feo atoms, respectively.
The Fe8(μ4-O)4 motif of 1 – 4 (Scheme 1) closely resembles the Fe8(μ4-O)4-units present in the all-ferric minerals ferrihydrite (Fe5HO8.4H2O) and maghemite (γ-Fe2O3), but also in mixed-valent magnetite (Fe3O4).34-36 The Fec − O bond lengths of 1 – 4 are within the range for the corresponding bonds of maghemite and ferrihydrite, but shorter than those of magnetite, consistent with the mixed-valent nature of the latter (Table 3). The Fec…Fec, as well as O-Fec-O and Fec-O-Fec angles of 1 - 4, and the three minerals are also similar. Besides ferrihydrite, maghemite and magnetite, the Fe8(μ4-O)4 motif has also been found recently in the salicylaldoximate complex Fe8IIIO4(sao)8(py)4 of S4 symmetry, which contains only 6-coordinate Fe-atoms.19 The irregular Fe4(μ4-O)4 cubane core of the latter complex has butterfly-distorted Fe2O2 faces with Fec-O bond lengths in the range of 1.990 – 2.231 Å.
Scheme 1.

The Fe8(μ4-O)4 motif of complexes 1-4, ferrihydrite, maghemite and ferrihydrite, also indicating the cubane and outer Fe-atoms and numbering scheme for the pyrazolate protons.
Table 3.
Comparison of structural and Mössbauer isomer shift data.
| 1, 2, 3, 4a | Maghemiteb | Ferrihydritec | Magnetited | |
|---|---|---|---|---|
| Fec−O | 2.028-2.066 | 2.015-2.104 | 1.96-2.14 | 2.140 |
| Fec⋯Fec | 3.055-3.112 | 2.894-3.012 | 2.91-3.20 | 2.968 |
| Fec−O−Fec | 96.5-99.0 | 87.9-95.2 | 85.8-102.5 | 87.78 |
| O−Fec−O | 80.7-82.9 | 84.7-93.1 | 73.5-91.0 | 92.18 |
|
| ||||
| δ, mm s-1 | 0.32(2), 293 K | 0.37(5), 293 K | 0.35(1), 293 K | Fe2+/3+; 0.67, 298 K |
The Ga-analogue of 1, Ga8(μ4-O)4(μ-pz)12Cl4, is also known.37 As GaIII and FeIII have similar radii, the bond lengths and angles around the Ga-centers are quite similar to those around the Fe-centers of 1.38
NMR data analysis
The solution 1H-nmr spectra of 1, 3 and 4 all show three broad, singlet, paramagnetically-shifted resonances (Table 4) assigned to the pyrazole 3-, 4-, and 5-positions and two resonances in the spectrum of the 4-Cl-pz complex 2 corresponding to the pyrazole 3- and 5-positions, consistent with their molecular formulae (Scheme 1). The magnetic equivalence of twelve pyrazole rings confirms the T molecular symmetry of all four complexes in solution. Complexes 1 and 4 differ only in their terminal halogen ligands. Their corresponding 1H-NMR spectra differ most significantly in their upfield resonances, 3.5 ppm for 1 and 1.0 ppm for 4, on the basis of which we tentatively assign them to the proximal 5H (position-3 is defined as the one closer to the Fe4O4-cubane, while position-5 is the one closer to a outer Fe-centers, Scheme 1). By analogy, the upfield resonances of 2 and 3 (8.6, and 3.8 ppm) are also assigned to the 5H atoms. For 3, the peak area integration clearly identifies the methyl-group downfield resonance at 27.7 ppm. Similarly, the downfield resonances of 1 and 4 (42.2 and 42.9 ppm) are also assigned to the 4H atoms. This leaves the midfield resonances of all four complexes assigned to their 3H atoms. Comparison of 1H-NMR spectra for 1 and 2 shows the influence of Cl-atom in 4-position of pyrazole; the 3H and 5H of 2 are shifted approximately 3 and 5 ppm downfield.
Table 4.
1H-nmr data for 1 – 4.
| Compound | 3H | 4H | 5H |
|---|---|---|---|
| 1 | 10.5 | 42.2 | 3.5 |
| 2 | 13.7 | - | 8.6 |
| 3 | 8.6 | 27.7 (Me4) | 3.8 |
| 4 | 10.7 | 42.9 | 1.0 |
Vibrational spectroscopy
The IR spectra of 1 - 4 (Supplementary Information, S1) consist of absorptions in the 1600 – 500 cm-1 range assigned to pyrazole vibrations. An addition absorption assigned to a Fe-O stretch is observed at 475 cm-1 (1), 478 cm-1 (2), 476 cm-1 (3) and 475 cm-1 (4). In 18O-labelled 2, this band shifts to 466 cm-1, confirming its assignment. An absorption assigned to a Fe-O stretch, observed in the Raman spectrum of 2 at 441 cm-1, shifts to 428 cm-1 in the 18O-labelled sample (Supplementary Information, S2).
Electrochemistry
The electrochemical properties of complexes 2 – 4, as determined by cyclic voltammetry, are similar to those already reported for 1.20 All four complexes show four reversible one-electron processes that reduce the neutral complexes to their corresponding mono-, di-, tri-, and tetraanions (Figure 2). Inspection of the E1/2-values of complexes 1 - 4 (Table 5) shows that substitution, both at the peripheral μ-pyrazole 4-positions as well as of the terminal halide ligands, influences the redox properties of the complex. The introduction of twelve electron-withdrawing chlorine substituents causes an anodic shift of 0.01 − 0.20 V of the E1/2 values of 2 compared to 1, while the introduction of twelve electron-releasing methyl group substituents causes a cathodic shift of 0.10 – 0.15 V to those of 3. The exchange of terminal Cl- for Br-ligands in 4, on the other hand, brings about an anodic shift of 0.10 – 0.29 V. The fact that the two different types of substitution cause E1/2 shifts of the same magnitude argues for the redox-active centers of the Fe8 complexes being remote from both substitution sites, e.g., the redox activity is confined to the six-coordinate centers of the encapsulated Fe4O4-cubane, not the four outer five-coordinate Fe-centers, which are directly connected to the terminal halide ligands. The rich redox chemistry of complexes 1 – 4 distinguishes them from other known Fe4O4-complexes for which no reversible electrochemistry has been reported to date. We attribute this to the protection afforded by the outer, inert shell, consisting of four Fe(μ-pz)3-units to the redox-active Fe4O4-core of 1 – 4.
Figure 2.
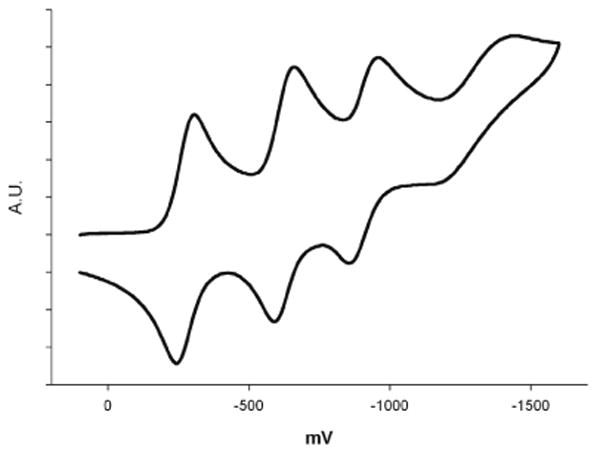
Cyclic voltamogram of 4 in 0.5 M Bu4NPF6/CH2Cl2, Pt-disk working electrode, vs Fc/Fc+.
Table 5.
Cyclic Voltemmetric data for complexes 1-4 in dichloromethane at 298 K.
| Potential, V | |||||
|---|---|---|---|---|---|
| E1/2(1) | E1/2(2) | E1/2(3) | E1/2(4) | ||
| Fe8(μ4-O)4(μ-pz)12Cl4 | 1 | -0.43a | -0.78a | -1.07a | -1.38a |
| Fe8(μ4-O)4(μ-4-Cl-pz)12Cl4 | 2 | -0.42 | -0.67 | -0.96 | -1.25 |
| Fe8(μ4-O)4(μ-4-Me-pz)12Cl4 | 3 | -0.58 | -0.91 | -1.20 | -1.55 |
| Fe8(μ4-O)4(μ-pz)12Br4 | 4 | -0.33 | -0.62 | -0.89 | -1.16 |
Data from reference 20.
The separation measured here between the first and fourth redox process of each Fe8 complex, ΔE1-4 = 0.95 V (1), 0.83 V (2 and 4) and 0.97 V (3), is much larger than the theoretical ΔE1-4 = 0. 0712 V separation in a system of four non-interacting redox centers.39 Whilst the degree of electronic communication among Fe-centers cannot be determined from the separation of E1/2 values (solvation and ion-pairing effects can significantly influence E1/2 values), the ΔEn-(n+1) values of 1 – 4 indicate some degree of valence delocalization. A qualitative comparison between isovalent ΔEn-(n+1) values of Fe4O4 and Fe4S4 cubanes shows a larger separation between consecutive redox processes in the latter, evidence of a higher degree of charge delocalization in the iron-sulfur clusters. The narrow ΔE1-4 separation of 0.83 – 0.97 V found here for Fe4O4 cubanes means that they can shuttle four electrons across a narrower redox potential window than the corresponding Fe4S4 cubanes; Fe4O4 cubanes are more efficient electron-transfer agents. As electron acceptors, the Fe8 complexes 1 – 4 are more efficient than C60 for which the first four redox processes are separated by 0.43 – 0.53 V, giving a ΔE1-4 of 1.41 V.40
Analysis of Magnetic Data of 1
The effective magnetic moment, μeff, at T = 300 K is 7.0 μB and on cooling this gradually descends to 0.12 μB at T = 2.0 K (Figure 3). The value at room temperature is much smaller than expected for eight uncoupled FeIII centers with g = 2.0 (μeff = 16.7 μB), and the decrease of the magnetic susceptibility upon cooling confirms the presence of strong antiferromagnetic exchange interaction in 1. The inverse susceptibility is non-linear and as a result of these exchange interactions which result in unequal population of energy levels.
Figure 3.

Temperature dependence of the effective magnetic moment for 1. Open circles –experimental data, full points – calculated.
In order to interpret the magnetic properties, the following spin Hamiltonian was postulated:
| (1) |
where J1 represents the isotropic exchange interactions in the FeIII4O4-cubane core mediated only through μ4-O bridges, J2 represents the isotropic exchange interactions between each apical FeIII center and the triangular base of the inner tetrahedron to which it lies closest, mediated through μ4-O and μ-pz bridges (Scheme 2) and the last term is the Zeeman term. We have ignored the coupling between the outer Fe centers, which is expected to be small due to the large internuclear separation.
Scheme 2.
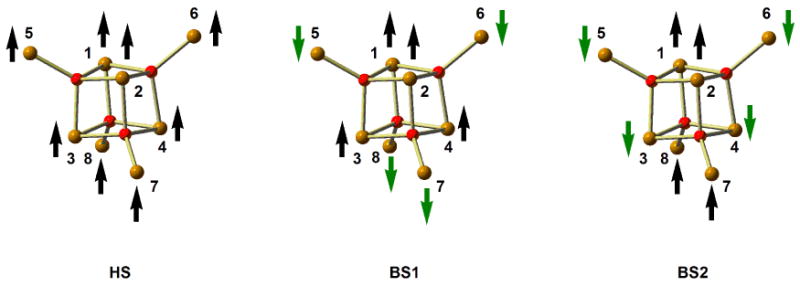
Alignment of the spin vectors in HS, BS1 and BS2 configurations.
The exchange coupling of eight FeIII centers, each with the local spin Si = 5/2, leads to (2Si + 1)8 = 68 = 1 679 616 magnetic states with total spin ranging from S = 0 to S = 20. Unfortunately, the postulated spin Hamiltonian is not symmetric and it is not possible to obtain an analytical formula for energy levels. Moreover, it is not feasible to efficiently diagonalize such large interaction matrices. To reduce the dimensions of the matrices, we have focused on the total spin symmetry principle (TSSP) for which the conditions (g-factors equal for all magnetic centers and no non-isotropic terms present) are fulfilled.41 In order to take advantage of TSSP approach, it is necessary to calculate energy values in the coupled basis set labeled as |αSM〉 using irreducible tensor operators,42 where α stands for the intermediate quantum numbers denoting the coupling path. First, only the isotropic exchange terms are involved and the whole matrix is factorized into the blocks according to the final spin quantum number S. As a result, the energies in zero magnetic field are obtained. The largest dimension of the sub-matrix is 16576 for S = 5 (Supplementary Information, S3). Consequently, the energy levels in non-zero magnetic field are calculated as Ei(αSM) = E0,i(αS) + μBgBM. Nowadays, this approach is feasible on modern computers, but it takes a few days to calculate the whole energy spectrum. Obviously, this procedure is not suitable for fitting of the magnetic data and further reduction of the dimensions of the matrices is needed.
To solve this problem, the spin permutational symmetry (SPS) of the spin Hamiltonian was applied41 and the energy levels were classified (Figure S1) according to the irreducible representation of the D2 point group (D2 is a subgroup of the local Td symmetric Fe8O4 core). Numerically efficient use of the SPS approach demands a coupling scheme, which is left invariant under the symmetry operations of the point group. This condition is fulfilled for S12 =S1 + S2, S34 = S3 + S4, S56 = S5 + S6, S78 = S7 + S8, S1234 = S12 + S34, S5678 = S56 + S78, S = S1234 + S5678. As a result, the each exchange matrix for final spin S is further factorized in relation to the irreducible representation of D2 point group. Now, the largest matrix has the dimension of 4201 for S = 4, Γ = A1 and calculation of the whole energy spectrum is much faster (Supplementary Information, S3).
Having the energy levels labeled as Ei(αSM, Γj) = E0,i(αS, Γj) + μBgBM, the molar magnetization can be easily calculated as
| (2) |
Fitting the experimental magnetization to this expression resulted in the following set of parameters: J1/hc = −2.1 cm-1, J2/hc = −50.6 cm-1 with fixed g = 2.0. The fitting procedure was rather insensitive to the (small) value and sign of the coupling constant J1. The grid of error functional R,43 for varying J1 and J2 parameters was calculated to confirm that the solution is the global minima (Supplementary Information, S3). Also, the standard deviations were calculated for fitted parameters with 95% probability and resulted in J1/hc = −2.1 ± 2.6 cm-1 and J2/hc = −50.55 ± 0.24 cm-1.
The large negative value of J2 indicates significant antiferromagnetic coupling between the inner and outer magnetic centers and is consistent with the magnetic measurements. The magnetic interaction in the Fe4O4 cubane core is weak and most probably antiferromagnetic in nature, although the possibility of a very small ferromagnetic interaction cannot be excluded on the basis of the magnetic properties.
The reconstructed energy levels in zero magnetic field as a function of final spin S are shown in Figure 4. The ground state is S = 0, and it is evident that the rotational band is retained for the bottom level of each spin, which is expected for antiferromagnetic coupled clusters.44 Obviously, only a very limited part of the energy spectrum is thermally populated, explaining the deviation of magnetic susceptibility from the Curie-Weiss law.
Figure 4.

Energy levels versus spin for 1 at B = 0.
Electronic structure of 1
In order to shed further light on the magnetic interactions in the parent cluster, Fe8(μ4-O)4(μ-pz)12Cl4, we have explored its electronic structure using spin-unrestricted density functional theory (B3LYP functional). Using the crystallographically determined geometry, we have computed the energies of three distinct electronic configurations (Scheme 2), differing in the relative orientations of the spins vectors. The first of these, the high-spin state (HS), has MS = 20, while the two broken-symmetry states, BS1 and BS2, have MS = 0.
HS, |5/2〉|5/2〉|5/2〉|5/2〉|5/2〉|5/2〉|5/2〉|5/2〉
BS1, |5/2〉|5/2〉|5/2〉|5/2〉|−5/2〉|−5/2〉|−5/2〉|−5/2〉
BS2, |5/2〉|5/2〉|−5/2〉|−5/2〉|−5/2〉|−5/2〉|5/2〉|5/2〉
In BS1, the spin vectors on the inner core are aligned parallel to each other (ferromagnetic), but antiparallel to those on the outer iron centres. In BS2 in contrast, the Fe4O4 core is subdivided into a ‘dimer-of-dimers’ structure, with the spins on the upper half aligned antiparallel to those on the lower half (similar models of electronic structure have been used to describe the antiferromagnetic coupling in Fe4S4 cubanes).45 The outer tetrahedron is similarly divided into upper and lower halves, with the spin vectors aligned antiparallel to those in the Fe4O4 core.
Applying the Heisenberg spin Hamiltonian:
| (3) |
to each of these three single determinant wavefunctions gives the following expressions for energies:
From which the expressions for J1 and J2 can be derived:
The computed total energies, and net spin densities at each iron center are summarized in Table 6, along with expectation values of the square of the total spin operator, <S2>. Spin densities of 4.0-4.2 are typical of high-spin FeIII centers, while the values of <S2> are close to the ideal values for ferromagnetic (<S2> = 420) and broken-symmetry (<S2> = 20) states arising from the coupling between eight S = 5/2 single ions.
Table 6.
Computed net spin densities and total energies of Fec and Feo centers.
| ρ(Fec) | ρ(Feo) | <S2> | E / au | |
|---|---|---|---|---|
| BS1(MS=0) | 4.18 | -4.03 | 19.47 | -4055.4684 |
| BS2(MS=0) | ±4.20 | ±4.03 | 19.54 | -4055.4578 |
| HS(MS=20) | 4.18 | 4.03 | 420.07 | -4055.4323 |
The resulting calculated values of J1/hc = -6.3 cm-1 and J2/hc = -52.8 cm-1 are in excellent agreement with the experimental values of -2.1 cm-1 and -50.6 cm-1, respectively, and confirm the dominance of antiferromagnetic coupling between the inner and outer Fe centres, mediated by the μ4-O bridges. The much stronger antiferromagnetic coupling between the inner and outer iron centres is related to the larger angles subtended at the bridging oxide ligands (119°), as a result of which the Fec-O-Feo superexchange pathway is more efficient than Fec-O-Fec, where the angles are closer to 90° (98°). The partial delocalization of the Feo dz2 electron onto the Fec center is apparent in the contour plot of the HOMO of BS2 (shown Figure 5). We note that Murrie and co-workers have reported similar antiferromagnetism in their [Fe8IIIO4(sao)8(py)4].4py system, and proposed that the dominant exchange pathway is also mediated by the μ4-O ligands.19
Figure 5.
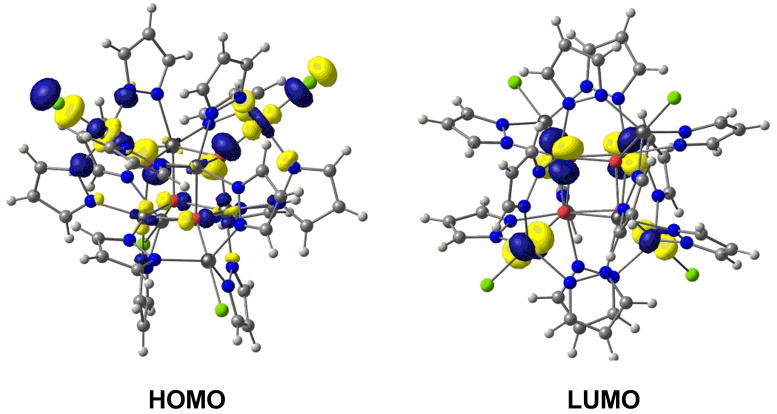
Contour plot of the spin-α HOMO and LUMO for the BS2 state of Fe8(μ4-O)4(μ-pz)12Cl4.
The localization of the molecular orbitals around the frontier region also sheds some light on the observed electrochemical properties. In each case (HS, BS1 and BS2), the lowest vacant orbitals are largely localized on the inner Fe4O4 core (HOMO and LUMO are shown for the BS2 state in Figure 5), consistent with our proposal that this is the site of the four reduction processes. There is, however, some significant delocalization onto the outer Fe centers, Feo, which would lead to a buffering of the electronic effects of successive reductions, as proposed by Lippard et al.15
Mössbauer spectroscopy
At zero magnetic field the Mössbauer spectra of 1 consist of two quadrupole doublets in the 4.2 - 300 K temperature range. The zero field spectrum recorded at 4.2 K is shown in Figure 6. The deconvolution of the zero field spectra may be carried out assuming two different models with either two “nested” (Fig. 6) or two “crossed” doublets (Supplementary Information, S4). The parameters obtained by the two methods are listed in Table 7. For either model, it is ascertained that the isomer shift values in the whole temperature range fall in the range of high spin ferric ions in octahedral environment with N/O donors.# Moreover, for both models, the site with the lower isomer shift value (A, δ = 0.37 and 0.32 mm s-1 at 4.2 K) is characterized by the largest quadrupole splitting (B, |ΔEQ| = 0.68 and 0.57 mm s-1).
Figure 6.

Mössbauer spectra from powdered samples of 1 in the absence or presence of an external magnetic field of 6 T applied perpendicular to the γ-rays. Solid lines are theoretical simulations assuming two species A, B with the parameters quoted in Table 7 (nested model).
Table 7.
Mössbauer hyperfine parameters of 1 at 4.2 K (293 K) for the two different deconvolution models.
| Model | Site | δ (mm s-1)a | |ΔEQ|(mm s-1)b | η | Assignment |
|---|---|---|---|---|---|
| Nested | A | 0.37 (0.25) | 0.68 (0.65) | <0.6 | Feo |
| B | 0.44 (0.32) | 0.33 (0.30) | <0.7 | Fec | |
| Crossed | A | 0.32 (0.19) | 0.57 (0.52) | <0.6 | Feo |
| B | 0.50 (0.36) | 0.43 (0.38) | <0.3 | Fec |
(±0.01 mms-1),
(±0.02 mms-1)
The Mössbauer parameter values strongly indicate that site A corresponds to the five-coordinate peripheral ions, Feo, whereas site B corresponds to the six-coordinate cubane ferric ions, Fec.46 The decrease of the isomer shift upon decrease of coordination number is associated with a decrease of the bond length, as it appears for the peripheral ferric ions with bond lengths slightly shorter than those of the cubane. The symmetry of the peripheral Feo-centers is lower than that of the cubane ones, Fec, and this is reflected in the larger ΔEQ value of site A in both models.47 Similar δ-values to those of Fec of 1 with fac-O3N3 coordination have been observed in the low temperature spectra of a mononuclear complex with cis-O2N4 coordination (δ = 0.44 mm s-1 at 80 K), a dinuclear complex containing a Fe2O2-core with O6 and O5N coordination (δ = 0.45 mm s-1 at 4.2 K) and horse spleen ferritin (δ = 0.45 mm s-1 at 100 K).48-50 Furthermore, the structural similarity of 1 to the minerals ferrihydrite and maghemite also holds true for their Mössbauer isomer shifts (Table 3).51,52
From the analysis of the magnetic susceptibility measurements for 1 a diamagnetic (S = 0) ground state is inferred with an S = 1 excited state ∼39 cm-1 higher in energy. An isolated ground state with S = 0 is further supported by the Mössbauer spectra. In Figure 6 we show a spectrum recorded at 4.2 K in the presence of an external magnetic field of 6 T applied perpendicular to the γ-rays.
In an exchanged coupled system the local magnetic field induced on each ferric site of the cluster is given by:
| (4) |
where Bext is the applied magnetic field and Bint = -ai<Si>/gnβn.
ai is the intrinsic hyperfine tensor for a ferric ion; <Si> is the spin expectation value for each ferric ion and critically depends on the total spin S of each multiplet of the exchange coupled system and the exchange coupling scheme. For states with total spin S = 0, <Si> = 0. In such cases each ferric ion nucleus will experience only the external field Bext. The magnetically perturbed spectrum of Figure 6 can be readily simulated assuming two sites with Bint = 0 (within experimental error) indicating that the ground state of the cluster is diamagnetic, well isolated from states with nonzero total spin. We have fitted the magnetically perturbed spectrum assuming both models (nested or crossed) and better results were obtained assuming the nested one (shown in Figure 6). Finally, the analysis of the magnetically perturbed spectra allowed for the estimation of the asymmetry parameter η of the Electric Field Gradient tensor (EFG) along with the determination of the sign of the quadrupole splitting. For both deconvolution models the quadrupole splitting is found to be negative.
Conclusions
The crystal structures of the octanuclear complexes 1-4 show that the 3- and 5-position of pyrazole ligands are sterically hindered in these materials, while the 4-position radiate unhindered out of the approximately spherical structure. Further property tuning in the family of Fe8(μ4-O)4-containing compounds can be achieved by the introduction of appropriate substituents at the pyrazole 4-position, as has been shown here for the redox properties of 1 – 3.
There have been only a few examples of polynuclear FeIII clusters of which the magnetic properties have been thoroughly analyzed to date.53 The main theoretical complication lies in a very high number of spin states; this problem can be solved gracefully by using symmetry of the spin Hamiltonian, which was successfully presented in the article. Analysis of the temperature dependence of the magnetic susceptibility indicates the presence of strong antiferromagnetic coupling between the inner and outer Fe centers, with rather weaker coupling within the Fe4O4 core. The computed electronic structure of the cluster confirms the presence of highly localized high-spin FeIII centers, and also the dominance of the superexchange pathway between core and outer iron centers, mediated by the μ4-O bridge. Furthermore, although the lowest lying vacant orbitals are found to be largely localized on the core irons, significant delocalization onto the outer metal centers will buffer the redox events to some extent, possibly accounting for the very narrow window over which the four one-electron reduction steps occur.
The M8(μ4-O)4-motif is common in metal complexes, as well as in minerals. Complexes in which the M8(μ4-O)4-core is supported by twelve bridging ligands are known in both carboxylate (M = Cr,54 Co,55 V/Zn,56 Fe19) and pyrazolate systems (M = Ga,30 Fe – Scheme 1). The FeIII-minerals maghemite and ferrihydrite and the FeIII/II magnetite contain Fe8(μ4-O)4-units. In the extended structures of all three of those minerals, the six-coordinate Fec-vertices are shared between two consecutive cubanes, while the Feo are tetrahedrally coordinated by four μ4-O atoms of four cubane units (while the Feo-centers of 1 – 4 are trigonal bipyramidal). In contrast, in the structures of 1 – 4 the twelve pyrazole bridges and the four terminal halogen atoms block all the remaining coordination sites of the Fe8(μ4-O)4 core, arresting its polymeric growth. The structural similarity between the iron-oxide core of ferritin and ferrihydrite has been known for quite some time.57 The further similarity between ferrihydrite and the core of complexes 1 – 4 described here, implies that the latter are models of the building units of ferritin.
The present study has established the structural, spectroscopic, electrochemical, magnetic properties and electronic structure of the all-ferric Fe4O4-cubane, providing the respective “fingeprints”, which may allow the recognition of this species in Nature, if indeed it exists. Ferrihydrite, maghemite and magnetite are possible sources from which intact Fe8(μ4-O)4 units might be extruded by proteins. An electron transfer protein based on a redox-active Fe4O4-cubane may of course exist in an all-ferric, or any of the four reduced mixed-valent or all-ferrous states. The full characterization of pyrazolate complexes containing redox-modified Fe4O4-cubanes, as well as a detailed investigation of the evolution of the electronic structure on reduction, are currently underway in our laboratories.
Supplementary Material
Representative infrared and Raman spectra, detailed description of magnetic susceptibility fitting, representative Mössbauer spectrum (crossed model) and crystallographic information files (S1-S6). This material is available free of charge via the Internet at http://pubs.acs.org
Acknowledgments
Financial support from the following agencies is gratefully acknowledged: Puerto Rico, NIH-SCoRE S06GM008102; Slovakia, VEGA 1/2453/05, APVT 20-005204, VEGA 1/3584/06; Czech republic, the Czech Ministry of Education, Youth and Sports Grant No. MSM6198959218.
Footnotes
The decrease in the values of isomer shifts from 4.2 K to 293 K is attributed to a second order Doppler effect.46
References
- 1.a Beinert H, Holm RH, Münck E. Science. 1997;277:653. doi: 10.1126/science.277.5326.653. [DOI] [PubMed] [Google Scholar]; b George DG, Hunt LT, Yeh LS, Baker WC. J Mol Evol. 1985;22:20. doi: 10.1007/BF02105801. [DOI] [PubMed] [Google Scholar]; c Zhou ZH, Adams MWW. Biochemistry. 1997;36:10892. doi: 10.1021/bi9708141. [DOI] [PubMed] [Google Scholar]; d Ma K, Hutchins A, Sung SJS, Adams MWW. Proc Natl Acad Sci USA. 1997;94:9608. doi: 10.1073/pnas.94.18.9608. [DOI] [PMC free article] [PubMed] [Google Scholar]; e Kisker C, Schindelin H, Rees DC. Annu Rev Biochem. 1997;66:233. doi: 10.1146/annurev.biochem.66.1.233. [DOI] [PubMed] [Google Scholar]; f Tainer JA, Thayer MM, Cunningham RP. Curr Opin Struct Biol. 1995;5:20. doi: 10.1016/0959-440x(95)80005-l. [DOI] [PubMed] [Google Scholar]; g Pereira IAC, Romao CV, Xavier AV, LeGall J, Teixeira MJ. J Biol Inorg Chem. 1998;3:494. [Google Scholar]; h Peters JW, Lanzilotta WN, Lemon BJ, Seefeldt LC. Science. 1998;282:1853. doi: 10.1126/science.282.5395.1853. [DOI] [PubMed] [Google Scholar]; i Nicolet Y, Piras C, Legrand P, Hatchikian EC, Fontecilla Camps JC. Structure. 1999;7:13. doi: 10.1016/s0969-2126(99)80005-7. [DOI] [PubMed] [Google Scholar]; j Breiter DR, Meyer TE, Rayment I, Holden HM. J Biol Chem. 1991;266:18660. doi: 10.2210/pdb2hip/pdb. [DOI] [PubMed] [Google Scholar]; k Kim J, Rees DC. Biochemistry. 1994;33:389. doi: 10.1021/bi00168a001. [DOI] [PubMed] [Google Scholar]; l Cammack R, Fernandez VM, Hatchikia EC. Methods Enzymol. 1994;243:43. [Google Scholar]; m Crane BR, Getzoff ED. Curr Opin Struct Biol. 1996;6:744. doi: 10.1016/s0959-440x(96)80003-0. [DOI] [PubMed] [Google Scholar]
- 2.Rao PV, Holm RH. Chem Rev. 2004;104:527. doi: 10.1021/cr020615+. [DOI] [PubMed] [Google Scholar]
- 3.a Arendsen AF, Hadden J, Card G, McAlpine AS, Bailey S, Zaitsev V, Duke EHM, Lindley PF, Kröckel M, Trautwein AX, Feiters MC, Charnock JM, Garner CD, Marritt SJ, Thompson MK, Kooter IM, Johnson MK, van den Berg WAM, van Dongen WMAM, Hagen WR. J Biol Inorg Chem. 1998;3:81. [Google Scholar]; b van den Berg WAM, Hagen WR, van Dongen WMAM. Eur J Biochem. 2000;267:666. doi: 10.1046/j.1432-1327.2000.01032.x. [DOI] [PubMed] [Google Scholar]
- 4.a Wolfe MT, Heo J, Gararelli JS, Ludden PW. J Bacteriol. 2002:5898. doi: 10.1128/JB.184.21.5898-5902.2002. [DOI] [PMC free article] [PubMed] [Google Scholar]; b Cabello P, Pino C, Olmos-Mira MF, Castillo F, Roldan MD, Moreno-Vivian C. J Biol Chem. 2004;279:45485. doi: 10.1074/jbc.M404417200. [DOI] [PubMed] [Google Scholar]
- 5.Dobbek H, Svetlitchnyi V, Gremer L, Huber R, Meyer O. Science. 2001;293:1281. doi: 10.1126/science.1061500. [DOI] [PubMed] [Google Scholar]
- 6.Fank P, De Tomaso A, Hedman B, Hodgson KO. Inorg Chem. 2006;45:3920. doi: 10.1021/ic051445x. [DOI] [PubMed] [Google Scholar]
- 7.a Wallar BJ, Lipscomb JD. Chem Rev. 1996;96:2625. doi: 10.1021/cr9500489. [DOI] [PubMed] [Google Scholar]; b Klabunde T, Krebs B. Struct Bond. 1997;89:177. [Google Scholar]; c Lange SJ, Que L., Jr Curr Opin Chem Biol. 1998;2:159. doi: 10.1016/s1367-5931(98)80057-4. [DOI] [PubMed] [Google Scholar]; d Westerheide L, Pascaly M, Krebs B. Curr Opin Chem Biol. 2000;4:235. doi: 10.1016/s1367-5931(99)00081-2. and references therein. [DOI] [PubMed] [Google Scholar]
- 8.Ford GC, Harrison PM, Rice DW, Smith JMA, Treffry A, White JL, Yariv J. (B).Phil Trans R Soc London. 1984;304:551. doi: 10.1098/rstb.1984.0046. [DOI] [PubMed] [Google Scholar]
- 9.Shoner SC, Power PP. Inorg Chem. 1992;31:1001. [Google Scholar]
- 10.Taft KL, Caneschi A, Pence LE, Delfs CD, Papaefthymiou GC, Lippard SJ. J Am Chem Soc. 1993;115:11753. [Google Scholar]
- 11.Taft L, Papaefthymiou GC, Lippard SJ. Science. 1993;259:1302. doi: 10.1126/science.8446898. [DOI] [PubMed] [Google Scholar]
- 12.Taft KL, Papaefthymiou GC, Lippard SJ. Inorg Chem. 1994;33:1510. [Google Scholar]
- 13.Dell'Amico DB, Boschi D, Calderazo F, Ianelli S, Labella L, Marchetti, Pelizzi G, Quadrelli EGF. Inorg Chim Acta. 2000;300-302:882. [Google Scholar]
- 14.a Oshio H, Hoshino N, Ito T. J Am Chem Soc. 2000;122:12602. [Google Scholar]; b Oshio H, Hoshino N, Ito T, Nakano M. J Am Chem Soc. 2004;126:8805. doi: 10.1021/ja0487933. [DOI] [PubMed] [Google Scholar]
- 15.Lee D, Sorace L, Caneschi A, Lippard SJ. Inorg Chem. 2001;40:6774. doi: 10.1021/ic010726b. [DOI] [PubMed] [Google Scholar]
- 16.Clemente-Juan JM, Mackiewicz C, Verelst M, Dahan F, Bousseksou A, Sanakis Y, Tuchagues JP. Inorg Chem. 2002;41:1478. doi: 10.1021/ic010787+. [DOI] [PubMed] [Google Scholar]
- 17.Abrahams BF, Hudson TA, Robson R. J Am Chem Soc. 2004;126:8624. doi: 10.1021/ja048293+. [DOI] [PubMed] [Google Scholar]
- 18.Hudson TA, Berry KJ, Moubaraki B, Murray K, Robson R. Inorg Chem. 2006;45:3549. doi: 10.1021/ic051779m. [DOI] [PubMed] [Google Scholar]
- 19.Gass IA, Milios CJ, Whittaker AG, Fabiani FPA, Parsons S, Murrie M, Perlepes SP, Brechin EK. Inorg Chem. 2006;45:5281. doi: 10.1021/ic0607843. [DOI] [PubMed] [Google Scholar]
- 20.Raptis RG, Georgakaki IP, Hockless DCR. Angew Chem Int Ed. 1999;38:1632. doi: 10.1002/(SICI)1521-3773(19990601)38:11<1632::AID-ANIE1632>3.0.CO;2-O. [DOI] [PubMed] [Google Scholar]
- 21.a Stephens PJ, Jollie DR, Warshel A. Chem Rev. 1996;96:2491. doi: 10.1021/cr950045w. [DOI] [PubMed] [Google Scholar]; b Zanello PA. Coord Chem Rev. 1988;87:1. [Google Scholar]; c Zanello P. Coord Chem Rev. 1988;83:199. [Google Scholar]
- 22.Martin W, Russell MJ. Phil Trans R Soc Lond B. 2003;358:59. doi: 10.1098/rstb.2002.1183. [DOI] [PMC free article] [PubMed] [Google Scholar]
- 23.a Xiao ZG, Gardner AR, Cross M, Maes EM, Czernuszewicz RS, Sola M, Wedd AG. J Biol Inorg Chem. 2001;6:638. doi: 10.1007/s007750100241. [DOI] [PubMed] [Google Scholar]; b Dilg AWE, Capozzi F, Mentler M, Iakovleva O, Luchinat C, Bertini I, Parak FG. J Biol Inorg Chem. 2001;6:232. doi: 10.1007/s007750000191. [DOI] [PubMed] [Google Scholar]; c Xiao Z, Lavery MJ, Ayhan M, Scrofani SDB, Wilce MCJ, Guss JM, Tregloan PA, Goerge GN, Wedd AG. J Am Chem Soc. 1998;120:4135. [Google Scholar]
- 24.Ehlert MK, Rettig SJ, Storr A, Thompson RC, Trotter J. Can J Chem. 1991;69:432. [Google Scholar]
- 25.Perrin DD, Armarego WLF, Perrin DR. Purification of Laboratory Chemicals. 2nd. Pergamon Press; 1987. [Google Scholar]
- 26.König E. Landolt-Börstein, Neue Serie. Vol. 2. Springer; Berlin: 1966. pp. 1–16. [Google Scholar]
- 27.Frisch MJ, et al. Gaussian 03, Revision D.02. Gaussian, Inc.; Wallingford, CT: 2004. Full reference is given in the supporting information, S5.
- 28.a Becke AD. J Chem Phys. 1993;98:5648. [Google Scholar]; b Lee C, Yang W, Parr RG. Phys Rev B. 1988;37:785. doi: 10.1103/physrevb.37.785. [DOI] [PubMed] [Google Scholar]; c Parr RG, Yang W. Density Functional Theory of Atoms and Molecules. Oxford University Press; New York: 1989. [Google Scholar]
- 29.a Hay PJ, Wadt WR. J Chem Phys. 1985;82:270. [Google Scholar]; b Wadt WR, Hay PJ. J Chem Phys. 1985;82:284. [Google Scholar]
- 30.a Dunning TH., Jr J Chem Phys. 1970;53:2823–2833. [Google Scholar]; b Dunning TH, Jr, Hay PJ. In: Modern Theoretical Chemistry. Schaefer HF III, editor. Vol. 3. Plenum; New York: 1976. pp. 1–28. [Google Scholar]
- 31.http://www.gaussian.com
- 32.a SMART-NT Software Reference Manual, version 5.059. Bruker AXS, Inc.; Madison, WI: 1998. [Google Scholar]; b SAINT+ Software Reference Manual, version 6.02. Bruker AXS, Inc.; Madison, WI: 1999. [Google Scholar]; c Sheldrick GM. SHELXS-90, Program for the Solution of Crystal Structure. University of Göttingen; Germany: 1986. [Google Scholar]; d Sheldrick GM. SHELXL-97, Program for the Refinement of Crystal Structure. University of Göttingen; Germany: 1997. [Google Scholar]; e SHELXTL-NT Software Reference Manual, version 5.1. Bruker AXS, Inc.; Madison, WI: 1998. [Google Scholar]
- 33.Piñero, D.; Raptis, R. G. unpublished results.
- 34.Michel FM, Ehm L, Antao SM, Lee PL, Chupas PJ, Liu G, Strongin DR, Schoonen MAA, Phillips BL, Parise JB. Science. 2007;316:1726. doi: 10.1126/science.1142525. [DOI] [PubMed] [Google Scholar]
- 35.a Greaves C. J Solid State Chem. 1983;49:325. [Google Scholar]; b Sinha HP, Sinha APB. Z Anorg Allg Chem. 1958;293:228. [Google Scholar]
- 36.Fleet MF. Acta Crystallogr. 1981;B37:917. [Google Scholar]
- 37.Capparelli MV, Hodge P, Piggott B. Chem Commun. 1997:937. [Google Scholar]
- 38.Shannon RD. Acta Crystallogr. 1976;A32:751. [Google Scholar]
- 39.Flanagan JB, Margel S, Bard AJ, Anson FC. J Am Chem Soc. 1978;100:4248. [Google Scholar]
- 40.a Xie Q, Pérez-Cordero E, Echegoyen L. J Am Chem Soc. 1992;114:3978. [Google Scholar]; b Ohsawa Y, Saji T. J Chem Soc Chem Commun. 1992:781. [Google Scholar]
- 41.Waldmann O. Phys Rev B. 2000;61:6138. [Google Scholar]
- 42.Boča R. Theoretical Foundations of Molecular Magnetism. Elsevier; Amsterdam: 1999. [Google Scholar]
- 43.The error functional is defined as , where is calculated effective moment, , is observed effective moment and N is number of experimental points.
- 44.Schnack J, Luban M. Phys Rev. 2001;B63:014418. [Google Scholar]
- 45.a Noodleman L, Case DA. Adv Inorg Chem. 1992;38:423. [Google Scholar]; b Aizman A, Case DA. J Am Chem Soc. 1982;104:3269. [Google Scholar]; c Noodleman L, Peng CY, Case DA, Mouesca JM. Coord Chem Rev. 1995;144:199. [Google Scholar]
- 46.Greenwood NN, Gibb TC. Mössbauer Spectroscopy. Chapman and Hall Ltd; London: 1971. [Google Scholar]
- 47.Bill E, Krebs C, Winter M, Gerdan M, Trautwein AX, Flörke U, Haupt HJ, Chaudhuri P. Chem Eur J. 1997;3:193. doi: 10.1002/chem.19970030205. [DOI] [PubMed] [Google Scholar]
- 48.Benisvy L, Halut S, Donnadieu B, Tuchagues JP, Chottard JC, Li Y. Inorg Chem. 2006;45:2403. doi: 10.1021/ic060100r. [DOI] [PubMed] [Google Scholar]
- 49.Yoon S, Lippard SJ. J Am Chem Soc. 2004;126:2666. doi: 10.1021/ja031603o. [DOI] [PubMed] [Google Scholar]
- 50.Watt GD, Frankel RB, Papaefthymiou GC. Proc Nat Acad Sci USA. 1985;82:3640. doi: 10.1073/pnas.82.11.3640. [DOI] [PMC free article] [PubMed] [Google Scholar]
- 51.Murad E, Bowen LH, Long GL, Quin TG. Clay Minerals. 1988;23:161. [Google Scholar]
- 52.Annersten H, Hafner SS. Z Krist. 1973;137:321. [Google Scholar]
- 53.a Waldmann O, Koch R, Schromm S, Schülein J, Müller P, Bernt I, Saalfrank RW, Hampel F, Balthes E. Inorg Chem. 2001;40:2986. doi: 10.1021/ic0012827. [DOI] [PubMed] [Google Scholar]; b Mukhin A, Gorshunov B, Dressel M, Sangregorio C, Gatteschi D. Phys Rev B. 2001;63 [Google Scholar]; c Barra L, Caneschi A, Cornia A, de Biani F, Gatteschi D, Sangregorio C, Sessoli R, Sorace L. J Am Chem Soc. 1999;121:5302. [Google Scholar]; d Barra AL, Bencini F, Caneschi A, Gatteschi D, Paulsen C, Sangregorio C, Sessoli R, Sorace L. Chem Phys Chem. 2001;2:523. doi: 10.1002/1439-7641(20010917)2:8/9<523::AID-CPHC523>3.0.CO;2-D. [DOI] [PubMed] [Google Scholar]; e Benelli C, Cano J, Journaux Y, Sessoli R, Solan GA, Winpenny REP. Inorg Chem. 2001;40:188. doi: 10.1021/ic000840e. [DOI] [PubMed] [Google Scholar]; f Gatteschi D, Caneschi A, Sessoli R, Cornia A. Chem Soc Rev. 1996;25:101. [Google Scholar]; g Delfs C, Gatteschi D, Pardi L, Sessoli R, Wieghardt K, Hanke D. Inorg Chem. 1993;32:3099. [Google Scholar]
- 54.Atkinson IM, Benelli C, Murrie M, Parsons S, Winpenny REP. Chem Commun. 1999:285. [Google Scholar]
- 55.Dimitrou K, Sun JS, Folting K, Christou G. Inorg Chem. 1995;34:4160. [Google Scholar]
- 56.Cotton FA, Duraj SA, Roth WJ. Inorg Chem. 1984;23:4042. [Google Scholar]
- 57.Ford GC, Harrison PM, Rice DW, Smith JMA, Treffry A, White JLJ, Yariv J. J Phil Trans R Soc (London) 1984;B304:551. doi: 10.1098/rstb.1984.0046. [DOI] [PubMed] [Google Scholar]
Associated Data
This section collects any data citations, data availability statements, or supplementary materials included in this article.
Supplementary Materials
Representative infrared and Raman spectra, detailed description of magnetic susceptibility fitting, representative Mössbauer spectrum (crossed model) and crystallographic information files (S1-S6). This material is available free of charge via the Internet at http://pubs.acs.org