

Abstract
CdSe/CdS/ZnS nanorods (NRs) of three aspect ratios were coated with phytochelatin-related peptides and studied using fluorescence correlation spectroscopy (FCS). Theoretical predictions of the NRs’ rotational diffusion contribution to the correlation curves were experimentally confirmed. We monitored rotational and translational diffusion of NRs and extracted hydrodynamic radii from the extracted diffusion constants. Translational and rotational diffusion constants (Dtrans and Drot) for NRs were in good agreement with Tirado and Garcia de la Torre’s as well as with Broersma’s theories, when accounting for the ligand dimensions. NRs fall in the size range where rotational diffusion can be monitored with higher sensitivity than translational diffusion due to a steeper length dependence Drot ~ L−3 versus Dtrans ~ L−1. By titrating peptide-coated NRs with Bovine Serum Albumin (BSA) we monitored (nonspecific) binding through rotational diffusion and showed that Drot is an advantageous observable for monitoring binding. Monitoring rotational diffusion of bioconjugated NRs using FCS might prove to be a useful tool for observing binding and conformational dynamics in biological systems.
Introduction
Single-molecule fluorescence methods allow the direct observation of conformational dynamics of macromolecules. These methods require fluorescent probes that are photostable, exhibit high extinction (absorption) coefficient, high quantum yield for fluorescence (and together, high brightness), and for some applications, polarized emission. Peptide-coated colloidal fluorescent semiconductor nanocrystals (quantum dots, QDs) fulfill most of these requirements. They are highly photostable, bright, and peptide-coating renders them water soluble, nearly monodisperse, biocompatible, and suitable for specific targeting.1–5 Peptide-coated QDs (pc-QDs) are promising fluorescent reporters in biological assays, and are particularly useful as specific labels for single-molecule tracking in live cells. The recent development of non-spherical shape colloidal semiconductor nanocrystal rods (nanorods, NRs) has added an important new class of nanoprobes to the QDs toolbox with unique polarization properties.6
We have recently implemented fluorescence correlation spectroscopy (FCS)7,8 to simultaneously monitor the colloidal and photophysical properties of peptide-coated QDs.9 This capability allowed us to evolve and improve the properties of pc-QDs.9 FCS is a versatile, noninvasive technique that has been used to monitor translational diffusion, blinking dynamics, biochemical reactions, interactions in live cells, and many more biochemical and photophysical phenomena. The method relies on collecting the fluctuating fluorescence signal from a small (confocal) volume (~fL) occupied by a low concentration of fluorophores (ranging from 100s of nM down to the single-molecule level).7,8,10–13 Besides giving information about translational diffusion, FCS (equipped with polarization-dependent excitation/detection optics) was found to be useful for monitoring rotational diffusion, accessing a complementary observable for various biological processes.7,14–16
Fluorescence methods can measure rotational diffusion by utilizing the dependence of a fluorophore’s absorption and emission of light on its dipole orientation. The absorption depends, according to the dipole-electric field approximation17, on: |μ⃑·E⃑| ∞ cos2θ where μ⃑ is the transition dipole, E⃑ is the electric field and θ is the angle between μ⃑ and E⃑. If a fluorophore is irradiated with light polarized parallel to its absorption transition dipole, it will be excited and emit light according to its emission transition dipole within its fluorescence lifetime. In most fluorophores absorption and emission dipoles have nearly the same orientation. If the dipole orientation changes within this lifetime (due to rotation) the emitted light will have a polarization different than the excitation polarization. Polarization optics in the detection path will convert polarization differences due to rotation into intensity fluctuations. If the excitation light is polarized perpendicular to the absorption transition dipole, light will have a low probability to be absorbed, decreasing also the probability for emission. Since FCS measures the self-similarity of photon intensities, fluctuations in intensities due to rotating absorption and emission dipoles can be analyzed for diffusing molecules in solution.14,15
Unfortunately, rotational diffusion FCS studies (utilizing polarized optics) of (small) dye molecules are complicated by overlapping time scales for rotational diffusion, triplet blinking, fluorescence lifetime, and antibunching. Dye molecules attached to macromolecules of interest through a single tether are usually free to rotate faster and independently of the rotation of the larger macromolecule, hiding its rotation (this can only be overcome by tethering bi-functionalized dyes to two anchor points on the macromolecule)18. Furthermore, attaching multiple fluorophores to larger molecules also hides the rotation because the random absorption/emission dipole orientations are averaged, reducing intensity fluctuations related to rotation.
Like dyes, colloidal NRs have a single-dipole polarized emission,6 but are of large enough size to exhibit well-separated time scales for rotational and translational diffusion and fluorescence lifetime. The rotational diffusion of individual or macromolecule-attached NRs can therefore be unambiguously extracted from FCS curves and separated from antibunching and translational diffusion time scales, providing a new reporter for measuring conformations/rotations on the microsecond time scale.
Other techniques to investigate rotational diffusion of macromolecules include fluorescence anisotropy (FA),19–21 depolarized light scattering (DLS),22 and transient electric birefringence,23 of which the last two are not appropriate for studies performed in live cells. Recently, transient electric birefringence was used to study the dipole moment as well as the rotational diffusion of trioctylphosphineoxide (TOPO)-coated CdSe NRs of large aspect ratio (>5).24 DLS has also been used for studying macromolecules of rod-like shape,25 but relies on high concentrations, high excitation powers, and high scattering cross sections for good signal to noise ratios.
Time-resolved fluorescence anisotropy (FA) has long been used in biology to explore conformations/rotations on the nanosecond time scale using conventional dyes19–21 and on a much slower (millisecond) time scale using lanthanides.26 However, few fluorescence probes have been found to measure rotations on the microsecond time scale. NRs, as orientational probes, could open up the microsecond time window, difficult to access by other methods.
In this study, we explored peptide-coated semiconductor NRs (pc-NRs) of various sizes and aspect ratios (ratio between length and diameter) with respect to their use as orientational probes in biomolecular assays. We synthesized CdSe NRs overcoated with a graded shell of CdS/ZnS and modified with a peptide coating. The particles were characterized by standard optical techniques (absorption, fluorescence spectroscopy) and transmission electron microscopy (TEM). The rotational and translational diffusion coefficients of pc-NRs were then studied using polarization-dependent FCS (pol-FCS). Observed FCS curves agree well with theoretical predictions and allow extraction of the (well separated) translational and rotational diffusion constants. FCS results were compared with theories for diffusion of rods: (i) the hydrodynamic stick model;27 (ii) Tirado and Garcia de la Torre’s theory;28 and (iii) Broersma’s relations.29,30 Our studies confirm the predictions for different length dependences of diffusion constants: whereas the translational diffusion constant scales as L−1 (L being the rod length), the rotational diffusion constant scales as L−3. Comparing TEM sizes with FCS-derived diffusion constants we estimate thickness of the applied organic coats (TOPO or peptides). As a proof of principle experiment, nonspecific binding of various amounts of Bovine Serum Albumin (BSA) to pc-NRs was monitored to demonstrate the increased sensitivity of rotational diffusion (as compared to translational diffusion) to binding.
Methods/Materials
Fluorescence Correlation Spectroscopy uses fluorescence fluctuations within the observation volume to extract kinetics of chemical reactions, blinking, and properties such as diffusion constant and related size. Fluctuations in the fluorescence signal are analyzed using the auto-correlation function:
| (1) |
The expression for the correlation function G(τ) can be well described for diffusing molecules under the assumption of an elliptical Gaussian-shaped confocal excitation/detection volume by:
| (2) |
where N is the average number of particles in the excitation/detection volume, and τD is a characteristic diffusion time depending on the diffusion constant D and the beam waist ωxy in x, y-dimensions of the laser focus:
| (3) |
This 2D model is valid for laser foci with ωxy≪ωz, and is of sufficient accuracy to analyze the presented data.8
FCS data for all samples were fit to Eq. (2) in the range between 10 μs and 1 s, in which there is no rotational contribution. The effective hydrodynamic radius r was derived by extracting τD from the correlation function, determining the diffusion constant D, and using the Stokes-Einstein relation:
| (4) |
where kB is the Boltzmann constant, T is the temperature, η is the solvent viscosity, and r is the particle radius. D was determined by estimating ωxy (the beam waist), from the known translational diffusion of polystyrene beads (D = kBT/(6πη · 26nm )).
Extensive theory and analysis has been undertaken to separate the contributions of rotational diffusion and translational diffusion.7,14–16 With typical translational diffusion times being on the order of milliseconds, the contributions are well separated in time for rotational diffusion times on the order of microseconds. According to Kask et al.16 and Widengren et al.31 the rotational diffusion term of the total auto-correlation function can be separated from the translational diffusion term and to first approximation be expressed as a single-exponential function:
| (5) |
This analytical expression of the correlation function has been derived assuming spherical-shape diffusors (having a linear dipole emission) and fluorescence lifetimes much shorter than the rotational correlation times. The coefficient R depends on the experimental geometry and the degree of polarization of the fluorophore. According to Aragon and Pecora, a first order approximation yields τR= 1/(6Drot) with Drot being the rotational diffusion constant.15 We assume that all higher order contributions (l > 1 where l is the angular momentum eigenvalue) to the correlation function (as given by Kask et al.)16 are negligible and can be ignored in correlation analysis, since they scale with e−l(l+1).
Samples
Graded shell CdSe/CdS/ZnS NRs of three sizes were grown (5×13 nm, 5×25 nm, and 5×32 nm) all emitting in the range 620–640 nm. Sizes were determined from a transmission electron microscope (Tecnai G2 12 TWIN). Graded shell CdSe/CdS/ZnS QDs (8 nm radius, 628 nm emission) were also used for comparison. Quantum yields of all peptide-coated NRs used in this study range from 10–35% and have multi-exponential lifetime decays, with all components < 30 ns.
We also compared commercial Streptavidin-coated QDs (QCD, Quantum Dot Corp., Hayward, CA) consisting of CdSe/ZnS core-shell and a proprietary amphiphilic polymer coat. The inorganic material has a size of 5×10 nm determined from TEM. QCD were previously shown to have hydrodynamic radii of ~30 nm.9,32
As a control, 26 nm polystyrene beads (FluoSpheres, Molecular Probes Inc., Eugene, OR) with an absorption (emission) maximum at 535 nm (575 nm) were monitored in distilled water. In order to limit aggregation, the beads were sonicated and centrifuged before use.
Synthesis
QD synthesis: Quantum dots were synthesized using a modified protocol initially developed by Murray et al.33 The CdS/ZnS shell synthesis was done as previously described4 and according to Manna et al.34
NR synthesis: All NR cores were synthesized using the quasi-two pot approach with aged Cd-TDPA developed by Peng et al.35 Different sizes and aspect ratios were obtained by stopping heat or adding multiple Se-TBP injections. Graded shells were synthesized according to the protocol developed by Manna et al.34
Peptide coating: CdSe/CdS/ZnS NRs were coated with peptides using a previously described protocol.3 NRs were coated with 50% peptide (1) and 50% peptide-PEG (2), or with 100% peptide (1):
G-S-E-S-G-G-S-E-S-G-Cha-C-C-Cha-C-C-Cha-C-C-Cha-Cmd
PEG-Cha-C-C-Cha-C-C-Cha-C-C-Cha-Cmd
Setup
FCS measurements were performed using a confocal microscope (Olympus IX71). Emission lines at 488 nm and 514 nm of a continuous wave Argon Ion laser (Ion Laser Technology, Frankfort, IL) were used as excitation sources. A diagram of the experimental setup is depicted in the supporting information. The excitation polarization was modified using half and quarter waveplates and set to be perpendicular to the optical axis and either perpendicular (X) or parallel (Y) to the optical top. Low excitation powers of either 2 μW or 9 μW (measured at the back focal plane of the water-immersion objective - 1.2NA, 60x, Olympus) were used in order to reduce blinking and exclude saturation effects (measured saturation intensities were in the range of 100s of μW). The resulting excitation volume is on the order of 1 fL.
Fluorescence was collected by the same objective and separated from excitation light by a dichroic mirror. A 50 μm pinhole was used to reject out-of-focus light. The fluorescence signal was evenly split by a beamsplitter cube and detected by two avalanche photodiodes (APDs, AQR-14, Perkin Elmer Inc.). In auto-correlation polarization configurations, a polarizer was placed in front of a nonpolarizing beamsplitter. In cross-correlation polarization configurations a polarizing beamsplitter was used to separate polarization components being perpendicular (X) or parallel (Y) to the optical top. Detected photon pulses were sent to a hardware correlator card (ALV-6010, ALV GmbH, Langen, Germany), which computed the cross-correlation of the two channels with a temporal resolution of 6.5 ns. This configuration is insensitive to both APD dead times and after-pulsing.
Results and Discussion
We performed pol-FCS measurements on NRs in order to explore their use as orientational probes in fluorescence spectroscopy assays. NRs have been characterized as fluorescent probes that emit linearly polarized light.6 We synthesized three different NR samples with sizes of 5×13 nm (aspect ratio 2.6), 5×25 nm (aspect ratio 5.0), 5×32 nm (aspect ratio 6.4), as characterized by TEM (Fig. 1), and compared them to commercial QDs from QDC (these QDs are in fact 5×10 nm NRs with a small aspect ratio of 2.0).
Figure 1.
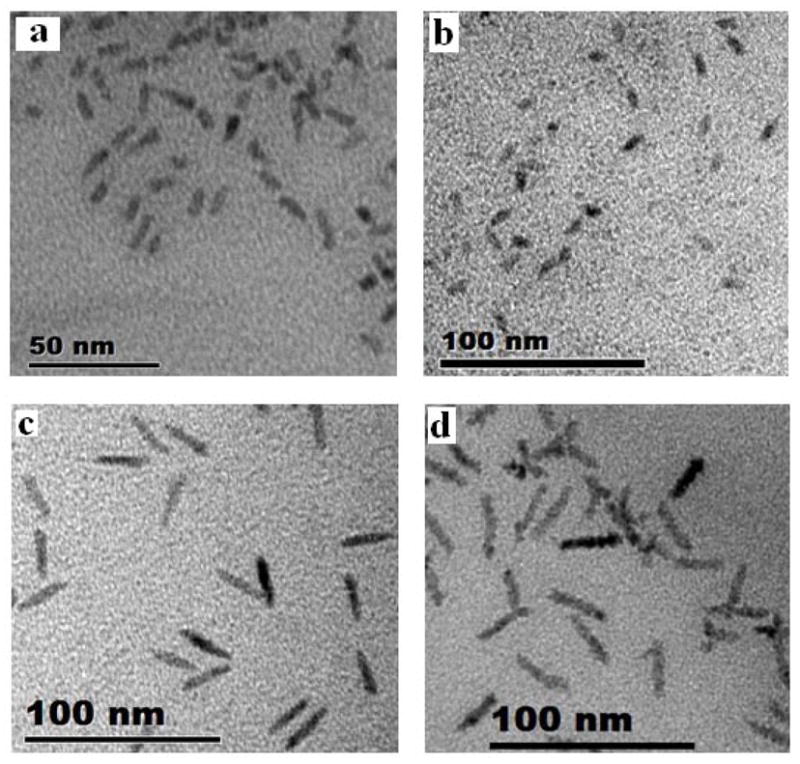
TEM pictures of NRs of different aspect ratios. (a) QDC 605 QDs, (b) 5×13 nm NRs, (c) 5×25 nm NRs, (d) 5×32 nm NRs.
Using linearly or circularly polarized excitation light (denoted as X or C in Fig. 2), we derived cross-correlation functions from two channels that detect linearly polarized or non-polarized emission light (denoted as XX, YY, XY, or NP, depending on the configuration of the polarization analyzer for each channel). We measured FCS curves GIJK(τ) (the correlation of the detected J-polarized signal with the detected K-polarized signal under excitation polarization I) for all investigated samples. They all displayed two distinct decays: one correlation contribution with a characteristic relaxation time on the order of milliseconds, which is attributed to translational diffusion through the confocal observation volume; and a second contribution decaying on shorter time scales, and which is strongly dependent on the polarization configuration (Fig. 2). Data from all experimental configurations of pol-FCS of NRs can be fitted with a 2D diffusion model and an additional exponential correlation term (eq. 5). At a time scale below 10 μs, curves from different experimental configurations start diverging from each other, indicating that the differences in FCS curves can only be due to polarization effects. We therefore attribute exponential decays on microsecond time scales unambiguously to rotational diffusion of NRs and will lay out all evidence in the following sections.
Figure 2.

Polarization-dependent FCS (pol-FCS) curves of NRs of different aspect ratios. (a) QDC 605 QDots; (b) 5×13 nm NRs; (c) 5×25 nm NRs; (d) 5×32 nm NRs. The panels show pol-FCS data G(t) recorded under xyz configuration, with x-polarized excitation and cross-correlated y, z-polarized emission channels. C refers to circularly polarized excitation, NP refers to nonpolarized emission, X and Y refers to polarization components perpendicular to the optical axis and to each other. All data were recorded with an excitation power of 9 μW.
Interpreting the Data
Various theoretical investigations deal with exact or approximate expressions of correlation functions from pol-FCS 7,15,16 and show that rotational diffusion of linear absorption/emission dipoles is detected in FCS as approximately exponential decays in the correlation function on the time scale of the rotational correlation time. It was found that auto-correlation and cross-correlation functions between differently polarized detection channels differ with respect to relaxation times, amplitudes and, to less extent, the exact shape. We found corresponding behavior when comparing GXXX, GXYY, GXXY, GCXY, and GXNP as presented in Fig. 2. We compared the pol-FCS results for all NRs with calculations based on analytical expressions for the correlation function as presented by Kask et al.16 The translational and rotational diffusion coefficients of samples derived from the experimental pol-FCS data were used to calculate and plot theoretical FCS curves (Fig. 3). Our experimental pol-FCS data show good agreement with theory, confirming that the fast exponent in the correlation curve is due to rotational diffusion of NRs.
Figure 3.
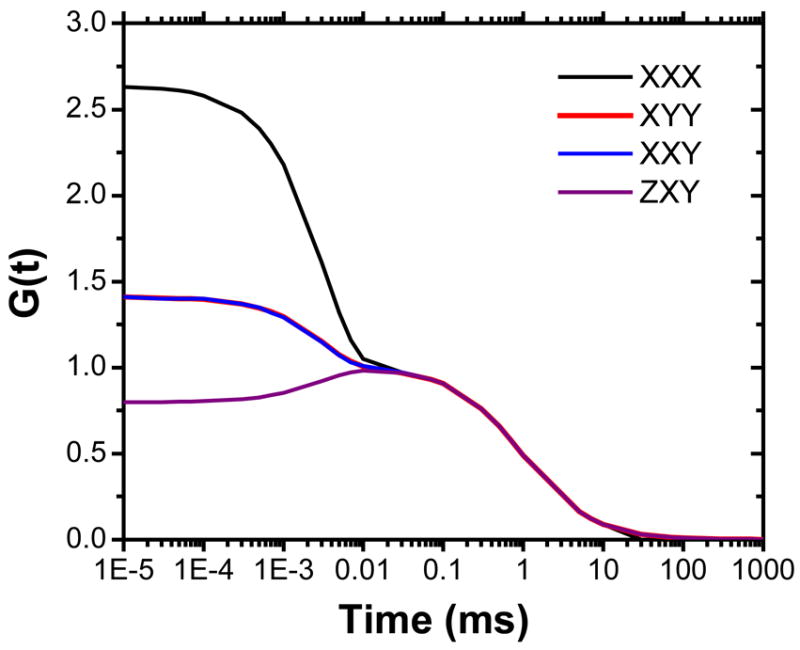
pol-FCS curves derived from analytical expressions given by Kask et al. 16 taking into account fitted rotational and translational diffusion constants as measured for 5×25 nm NRs (Fig. 1). Rotational diffusion was described as first approximation with l=2; translational diffusion was described following eqs. 2 and 3.
As a control, 26 nm polystyrene beads were measured under all experimental polarization configurations. Only small changes at microsecond time scales were observed for all polarization configurations (Fig. 4). This observation can be explained by the fact that many dyes (each having different orientation) are embedded in each bead, thus averaging out most of the polarization effect under rotation. These results agree with those of Enderlein et al.,36 showing a negligible polarization effect on FCS curves for polystyrene beads.
Figure 4.
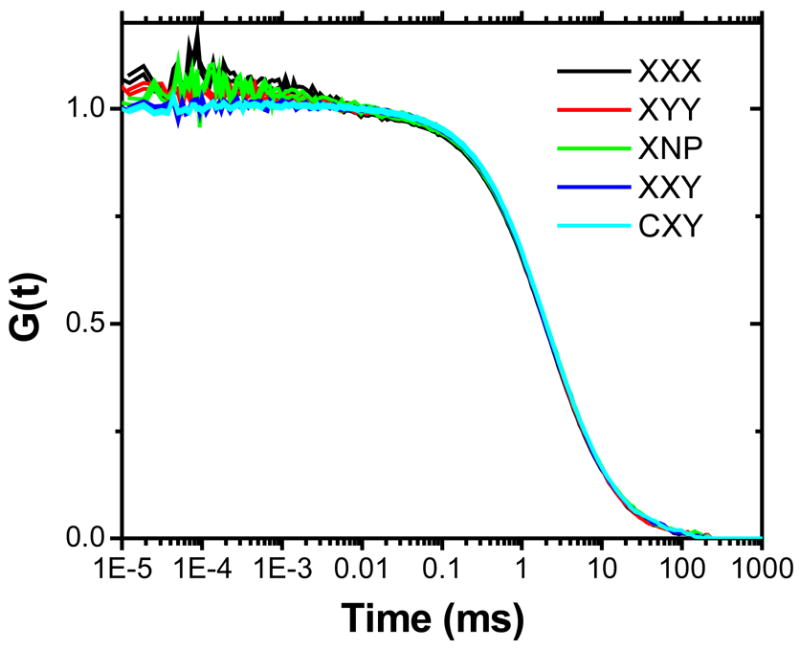
pol-FCS curves of 26 nm fluorescent beads under the same experimental configurations as shown in Fig. 2.
In more detail, pol-FCS data for NRs show, in agreement with theory, that an auto-correlation GXXX of the emission polarization component parallel to the excitation polarization yields the largest rotational correlation amplitude. A cross-correlation GXNP between non-polarized emission channels and the auto-correlation GXYY of the component being perpendicular to the excitation polarization yield comparable amplitudes, both smaller than that of GXXX. Cross-correlations of X and Y polarization components GXXY show a slightly negative rotational diffusion amplitude (anti-correlation) for all NRs studied (Fig. 2). The anti-correlation is even more pronounced for circularly polarized excitation (GCXY). Theoretical work has shown that cross-correlation curves GZXY, where the excitation light is polarized in Z-direction perpendicular to both emission polarization components behave in a similar way.16 In our experiment there is a certain degree of Z-polarized excitation light due to depolarization in the high NA objective,37 possibly contributing to the negative correlation. Another source that has not been characterized yet is a slight ellipticity in the polarization of the NRs emission.
Fitting and extracting diffusion constants
We found that a 2D diffusion model with an exponential decay describing the contribution from rotational diffusion (eq. 5) could indeed be used to fit all GXXX, GXYY, and GCXX curves.
However, small differences were found depending on the surface modification of NRs and their solubilization in polar (millipore water) or non-polar (toluene) solvents. In Fig. 5 we present GXXX data for TOPO-coated NRs in toluene and peptide-coated NRs in water and appropriate fits of the model from eq. 5. From the quality of the fits it becomes obvious that TOPO-coated NRs are in even better agreement with the proposed model than peptide-coated NRs. The fact that deviations were found on time scales related to rotational as well as translational diffusion suggests that their origin is not due to changes in either diffusion behavior. A more likely source for this effect is due to fluorescence intermittency, or blinking,38 which so far was found to be omnipresent in colloidal nanoparticles.
Figure 5.

(a) pol-FCS curves (solid lines - experimental data; circles - fitted function) of TOPO-capped 5×25 nm NRs in toluene (left) and in water (right), fitted to an FCS model for rotational and translation diffusion (eq. 5); (b) corresponding residuals.
Blinking/Saturation Effects
It has been previously shown that quantum dots can, but do not necessarily, show changes in the correlation function related to blinking.9 This was attributed to the fact that quantum dots follow power law blinking behavior,39 i.e. blinking occurs on all time scales (there is no characteristic blinking time), in contrast to blinking of organic fluorophores (where intersystem crossing leads to a population of long-lasting triplet states and thus causes blinking on a microsecond time scale). For systems rotating in the microsecond time scale it would be difficult to unambiguously distinguish between significant contributions from triplet state kinetics or from rotation. If, however, the blinking contribution is small, or blinking and rotational diffusion occur on different time scales, rotational diffusion can be isolated from pol-FCS curves.
To test the contribution of blinking to the increases in correlation amplitude at microsecond time scales, 5×25 nm NRs were excited with 2, 10, 50, and 100 μW laser power. Increasing excitation power should cause differences in blinking behavior and thus influence the correlation function.9 However, we found no such change in the shape of the correlation function of both TOPO-coated and pc-NRs at different excitation powers. Because it has been shown that blinking in QDs may increase with higher excitation power, possibly without being reflected in FCS data,9 all subsequent measurements were done at low excitation powers of 2–9 μW, thus minimizing both blinking and saturation effects. Nevertheless, the imperfect fits for pc-NRs (Fig. 5) leave the possibility that blinking contributions have not been completely eliminated. The better fits for TOPO-coated NRs, as compared to pc-NRs, might suggest a change in blinking behavior due to peptide coating.
Amplitude Changes
When comparing FCS curves GXXX for different NRs and QDs at short time scales (< 10 μs), we noticed that the correlation amplitude factors R (eq. 5) were smaller than predicted by theory. R can be influenced by various factors under non-ideal experimental conditions: (i) elliptical (rather than linear) polarization of NRs emission; (ii) elliptical (rather than linear) excitation polarization due to e.g. depolarization in the high NA objective; (iii) particle aggregation.
We found that 2D emitters such as CdSe quantum dots exhibit smaller R factors (R<0.6) than longer rods (aspect ratio > 2.5; 0.7<R<1.0) do. The current understanding is that past an aspect ratio of 1.25 a transition in energy between the degenerate Se 4px and 4py orbitals and the 4pz orbitals takes place, converting the emission of CdSe NCs from elliptically polarized (2D) to linearly polarized (1D).6 Differences in correlation amplitude factors R between the various samples suggest that FCS is sensitive to the degree of polarization (Fig. 2). The smallest NRs (5×13 nm; aspect ratio 2.5; R=0.8) have smaller polarization factors than the intermediate sized NRs (5×25 nm; aspect ratio 5; R=1.0) in both water and toluene, consistent with the prediction that increasing aspect ratio should lead to increasing linear polarization of emission. For the largest peptide-coated NRs (5×32 nm; aspect ratio 6.4; R=0.7), the R factor extracted from FCS data is significantly lower. Although the literature indicates that there should be a slight decrease in polarization at very large aspect ratios,6 the differences found in these experiments are larger than predicted. A more likely influence is from aggregation of NRs in solution that averages out polarization effects. For larger NRs we observed larger fluctuations in the average NR concentration N, extracted from 20 short successive measurements (30 sec each), compared to all other samples studied (data not shown; the significance of fluctuations in N as a signature for aggregation was previously discussed).9 In contrast, 5×25 nm and 5×32 nm NRs in toluene consistently exhibited uniform R values and small fluctuations in average N in multiple measurements.
Translational Diffusion Coefficients
CdSe NRs of approximately the same diameter but varying lengths were studied. We investigated the effect of rod length on rotational and translational diffusion coefficient. Three models were tested for these samples: hydrodynamic stick theory for rods (HS theory),40 Tirado and Garcia de la Torre’s relations (TT theory),28,41,42 and Broersma’s relations.29,30 The theories predict the following translational diffusion constants DT:
Stick Theory
| (6) |
with
Tirado and Garcia de la Torre
| (7) |
with
Broersma’s Relations
| (8) |
with
and δ = ln(2L/d)
In all of the expressions above L is the rod length, d is the rod diameter, kB is the Boltzmann constant, T is the temperature, η and is the solvent viscosity. Broersma’s relations are appropriate for long cylinders of aspect ratios > 3.5 (our shortest rods - 5×13 nm - can not be properly described by this model). TT theory and HS theory for rods are valid for all the samples. Because TT theory follows stick boundary conditions, but takes into account a rod like shape instead of a prolate ellipsoid, it should describe longer rods more accurately. As can be seen in Table 1, the translational diffusion constants for NRs estimated from HS theory are larger than observed in the experiment. However, experimental values extracted for 5×13 nm, 5×25 nm, and 5×32 nm agree quite well with TT theory, when the peptide coating is taken into account. Meanwhile values extracted from FCS for 5×25 nm and 5×32 nm NRs are also relatively consistent with values calculated from Broersma’s relations. In agreement to our previous investigation for QDs,9 peptide coating increases the hydrodynamic radius of NRs (addition of ~2 nm on all sides, somewhat smaller than found for QDs). Overall, our measurements confirm that the translational diffusion constant scales approximately as DT ~ L−1. The exact prediction according to TT theory is shown in Fig. 6b.
Table 1.
Comparison of experimental and theoretical translational diffusion constants of pc-NRs in water.
| NRs | FCS (10−7 cm2/s) | HS (10−7 cm2/s) | HS (10−7 cm2/s) w/peptides | TT (10−7 cm2/s) | TT (10−7cm2/s) w/peptides | B (10−7 cm2/s) | B (10−7 cm2/s) w/peptides |
|---|---|---|---|---|---|---|---|
| 5×13 nm | 4.2±0.1 | 3.42 | 1.75 | 5.37 | 3.77 | NA | NA |
| 5×25 nm | 3.4±0.1 | 3.12 | 1.96 | 3.93 | 2.76 | 3.28 | 2.59 |
| 5×32 nm | 2.5±0.1 | 2.81 | 1.92 | 3.42 | 2.47 | 2.87 | 2.09 |
| QDC 605 | 1.4±0.1 | 3.89 | NA | 5.07 | NA | NA | NA |
HS: hydrodynamic Stick theory; TT: Tirado and Garcia de la Torre theory; B: Broersma theory. NA: not applicable. It is assumed that peptides add 2 nm to all sides of NRs.
Figure 6.

Rotational (a) and translational (b) diffusion constants as a function of NR length (squares). Diffusion constants are averages of extracted values from GXXX(t), GXYY(t), GCXX(t), GCYY(t), GYYY(t), GYXX(t). The errors are standard deviations. The dotted line represents theoretical predictions according to the Tirado/de la Torre theory and is normalized to superimpose with the first data point.
Rotational Diffusion Coefficients
As discussed above, the rotational diffusion of NRs is reflected in pol-FCS curves as a fast exponential decay in the correlation curve (microsecond regime). The expressions for the rotational diffusion constant, as theoretically predicted by the same three theories, are:
Stick Theory
| (10) |
with:
and:
Tirado and Garcia de la Torre
| (11) |
with:
Broersma’s Relations
| (12) |
with:
Here again L is the rod length, d is the rod diameter, kB is the Boltzmann constant, T is the temperature, and η is the solvent viscosity.
pol-FCS is not sensitive to rotation of NRs around their long axes because the absorption dipole is unchanged in this mode. However, pol-FCS should be sensitive to end-over-end rotations since the amount of absorption and the emission polarization vary with rotation.
The various pol-FCS auto-correlation data could be fit well and were used to extract rotational diffusion constants. As clearly shown for pc-NRs (Table 2), the rotational diffusion coefficient of NRs (derived by fitting eq. 5) strongly decreases with NR length. Rotational diffusion is much more sensitive to changes in length compared to translational diffusion since it varies as 1/L3 as opposed to 1/L for translational diffusion. The difference is clearly shown in Fig. 6a and b for the three longest pc-NRs under study.
Table 2.
Comparison of experimental and theoretical rotational diffusion constants of pc-NRs in water.
| NRs | FCS (105 s−1) | HS (105 s−1) | HS (105 s−1) w/peptides | TT (105 s−1) | TT (105 s−1) w/peptides | B (105 s−1) | B (105 s−1) w/peptides | Polarization Factor (R) |
|---|---|---|---|---|---|---|---|---|
| 5×13 nm | 1.5±0.2 | 21.90 | 7.22 | 12.18 | 3.85 | NA | NA | 0.79 |
| 5×25 nm | 0.5±0.1 | 5.02 | 2.42 | 3.15 | 1.41 | 2.83 | 1.08 | 1.00 |
| 5×32 nm | 0.3±0.2 | 2.72 | 1.47 | 1.78 | 0.89 | 1.61 | 0.78 | 0.70 |
| QDC 605 | 0.4±0.1 | 41.40 | NA | 22.67 | NA | NA | NA | 0.31 |
HS: hydrodynamic Stick theory; TT: Tirado and Garcia de la Torre theory; B: Broersma theory. NA: not applicable. It is assumed that peptides add 2 nm to all sides of NRs.
The rotational diffusion of TOPO-coated NRs dispersed in toluene was also measured (Table 3). The model taking into account translational diffusion through a Gaussian observation volume and rotational diffusion (eq. 5) fits the pol-FCS data of these samples well. The rotational diffusion constants extracted agreed reasonably well with Garcia de la Torre’s and Broersma’s relations for the smaller NRs of all sizes (5×13 nm, 5×25 nm and 5×32 nm). The good agreement with theory shows that pol-FCS is an excellent method for measuring rotational diffusion on the microsecond time scale.
Table 3.
Comparison of experimental and theoretical rotational diffusion constants of TOPO-NRs in toluene.
| NRs | FCS (105 s−1) | HS (105 s−1) | HS (105 s−1) w/TOPO | TT (105 s−1) | TT (105 s−1) w/TOPO | B (105 s−1) | B (105 s−1) w/TOPO | Polarization Factor (R) |
|---|---|---|---|---|---|---|---|---|
| 5×13 nm | 6.5±1.1 | 33.30 | 18.24 | 18.50 | 9.84 | NA | NA | 0.80 |
| 5×25 nm | 2.2±0.1 | 7.63 | 5.17 | 4.79 | 3.11 | 4.31 | 2.70 | 1.00 |
| 5×32 nm | 1.3±0.2 | 4.13 | 2.92 | 2.71 | 1.87 | 2.44 | 1.67 | 0.99 |
HS: hydrodynamic Stick theory; TT: Tirado and Garcia de la Torre theory; B: Broersma theory. NA: not applicable. It is assumed that TOPO adds 1nm to all sides of NRs.
Ligand Effects
As previously seen for translational diffusion, the organic coatings (TOPO or peptides) contribute to the particles’ hydrodynamic radius. Rotational diffusion is even more sensitive to the addition of organic coating. Rotational diffusion constants extracted for TOPO-coated NRs were consistent with a NR size increased by 1.3–2 nm on all sides (as compared to TEM data), close to the predicted 1.1 nm ligand length addition (Table 3). Previous analysis of translational diffusion yielded similar increase in hydrodynamic radii by peptide coating of QDs on the order of ~1–3.5 nm.9 HPLC results showed a ligand length addition of approximately 4.5 nm.3 This added size could explain why the extracted rotational diffusion constants of peptide-coated NRs are smaller than predicted by the HS theory for prolate ellipsoids, the TT and Broersma’s theories for rods with dimensions equal to those derived from TEM.
Even though different lengths of the pc-NRs measured by TEM correlate with the changes in rotational diffusion time, the absolute values extracted were larger than expected. To match experimental values to theory, an additional 4–6 nm peptide coating on all sides had to be assumed. In contrast to these results, translational diffusion measurements suggest smaller hydrodynamic radius contributions from peptides (0–2 nm). However, due to the particles’s rod shape it is not certain that the peptide coating is evenly distributed adding an equal peptide amount on all sides. Meanwhile, QDC 605 particles, which were measured to have a 30 nm hydrodynamic diameter from analysis of their translational diffusion were measured to have ~32 nm hydrodynamic diameter from their rotational diffusion time, showing rather good agreement. The observation that theoretical values of rotational diffusion agreed better for TOPO-coated NRs, than for peptide-coated NRs, implies that the peptides contribute a thicker organic coat than TOPO molecules do. It is noted that this observation is made considerably simpler through monitoring rotational diffusion, since translational diffusion is affected by the different solutions’ indexes of refraction (water vs. toluene), resulting in non-comparable confocal observation volumes, and therefore different apparent diffusion times. Rotational diffusion, on the other hand, does not depend on the observation volume.
Viscosity Effects
To further prove that accurate rotational diffusion constants can be extracted using pol-FCS, we show effects of viscosity on 5×13 nm pc-NRs dispersed in solutions of 0%, 10%, 20%, 30% and 40% glycerol (by volume) in water. Both rotational and translational diffusion constants were found to be inversely proportional to viscosity, as expected from theory (eqns. 6–12). Viscosity values for glycerol/water mixtures were taken from the literature.43 The similarity in the viscosity dependence for both translational and rotational diffusion constants (Fig. 7) gives further support for the correct interpretation of the fast exponent.
Figure 7.

(a) Rotational and (b) translational diffusion constants of 5×13 nm pc-NRs as a function of viscosity. Solid lines are linear fits and show the linear dependence of diffusion constants on inverse viscosity. Diffusion constants are averages of extracted values from GXXX(t), GXYY(t), GCXX(t), GCYY(t), GYYY(t), GYXX(t). The errors are standard deviations. (c) Rotational diffusion constants as a function of translational diffusion constants follow a linear trend, confirming identical viscosity dependence.
Titration of BSA with Peptide-Coated NRs
The increased sensitivity of pol-FCS to NR size (via rotational diffusion) suggests the utilization of NRs for an accurate binding assay. The advantage of pol-FCS in monitoring rotational diffusion of bioconjugated NRs over steady-state florescence polarization immunoassays (FPIs) to show binding is its independence of fluorescence lifetimes of the fluorophores. The requirement for lifetimes and rotational diffusion times to be on the same order of magnitude limits dye-based FPIs to the study of analytes of small molecular-weight (MW < 20,000 Da),44 as opposed to pol-FCS with NRs where rotational time scales between 100s of nanoseconds and the maximum observation time, limited by diffusion through the observation volume, could be relevant (and therefore imposing a less stringent MW limit).
To demonstrate this point, NRs were coated with peptides (sequence 1) and titrated with Bovine Serum Albumin (BSA) in HEPES buffer solution. NRs rotational diffusion is more sensitive to size changes the shorter the NRs are, provided that they still emit linearly polarized light. For this reason we chose 5×13 nm NRs for this assay. As shown in Fig. 8 the relative change of 22% in translational diffusion of NRs due to BSA binding is smaller than the relative change in the rotational diffusion (59%). Since no details are known about the binding interaction, its stoichiometry, and the geometry of the bound complex, a discussion of relative size changes estimated from these numbers is not realistic. Given that BSA is ~5.4 nm in diameter,45 a mixture of BSA-NR complexes with very different geometries, and large variation in the corresponding translational and rotational diffusion constants, should occur depending on where and how BSA is bound to NRs. The BSA binding curve (rotational diffusion coefficient as a function of the logarithm of BSA concentration) is fitted well to a sigmoidal plot, suggesting that binding between NRs and BSA is indeed taking place. Errors in both translational and rotational diffusion constants were estimated to be comparable and ~10%. These results confirm that pol-FCS can monitor binding of biomolecules to NRs more accurately through changes in rotational diffusion than changes in translational diffusion.
Figure 8.

Change of (a) rotational and (b) translational diffusion coefficients of pc-NRs titrated with BSA. Relative scales are shown on the right axis. The plots demonstrate that rotational diffusion is more sensitive to binding. Diffusion constants were extracted from GXXX(t) as shown in Fig. 2. Errors are standard deviations from three or more measurements done on the sample at different times in the XXX configuration. Sigmoidal fits y=(A1−A2)/((1+(x−x0)P)+A2) (shown as red lines) yield consistent parameters: x0=0.018±.005, P=0.57±0.12 for (a)) and x0=0.012±0.009, P=0.66±0.42 for (b).
Conclusions
We have shown that pol-FCS is an effective method for measuring colloidal properties of NRs related to translational and rotational diffusion. We demonstrated that, in the size range of NRs, rotational diffusion is more sensitive to size variations than translational diffusion, in agreement with theoretical predictions. Deviations between theoretical estimates from the inorganic core sizes and experimental values were found for rotational diffusion constants of pc-NRs, demonstrating the high sensitivity of pol-FCS to the contribution of organic ligands to the particles’ hydrodynamic size. Finally, a sensitive binding assay that utilizes the rotational diffusion of pc-NRs was established. Future work will focus on end-specific and stochiometric attachment of NRs to large biomolecules, FCS of NRs in live cells, and extraction of conformational dynamics through polarization analysis.
Supplementary Material
A diagram of the experimental setup for pol-FCS is provided in the supporting information. This material is available free of charge via the internet at http://pubs.acs.org.
Acknowledgments
We thank Fabien Pinaud and Xavier Michalet for helpful discussions. This work was supported with funding from the National Institute of Health, Grant No. 5-R01 EB000312-04, DARPA and AFOSR, Grant No. FA955004-10048. We would also like to acknowledge the W. M. Keck Foundation for their support to this work from the W. M. Keck Epithelial Cell Cancer Biology Program at UCLA (Grant # 04074070). Fluorescence correlation spectroscopy was performed at the UCLA/CNSI Advanced Light Microscopy/Spectroscopy Shared Facility.
References
- 1.Bruchez M, Moronne M, Gin P, Weiss S, Alivisatos AP. Science. 1998;281:2013. doi: 10.1126/science.281.5385.2013. [DOI] [PubMed] [Google Scholar]
- 2.Chan WCW, Nie SM. Science. 1998;281:2016. doi: 10.1126/science.281.5385.2016. [DOI] [PubMed] [Google Scholar]
- 3.Pinaud FKD, Moore H, Weiss S. J Am Chem Soc. 2004;126:6115. doi: 10.1021/ja031691c. [DOI] [PMC free article] [PubMed] [Google Scholar]
- 4.Tsay JM, Doose S, Pinaud F, Weiss S. J Phys Chem B. 2005;109:1669. doi: 10.1021/jp046828f. [DOI] [PMC free article] [PubMed] [Google Scholar]
- 5.Michalet X, Pinaud F, Bentolila LA, Tsay JM, Li JJ, Doose S, Weiss S. Science. 2005;307:538. doi: 10.1126/science.1104274. [DOI] [PMC free article] [PubMed] [Google Scholar]
- 6.Hu JT, Li LS, Yang WD, Manna L, Wang LW, Alivisatos AP. Science. 2001;292:2060. doi: 10.1126/science.1060810. [DOI] [PubMed] [Google Scholar]
- 7.Magde D, Elson EL, Webb WW. Biopolymers. 1974;13:29. doi: 10.1002/bip.1974.360130103. [DOI] [PubMed] [Google Scholar]
- 8.Rigler R, Mets U, Widengren J, Kask P. European Biophysics Journal. 1993;22:169. [Google Scholar]
- 9.Doose S, Tsay JM, Pinaud F, Weiss S. Analytical Chemistry. 2005;77:2235. doi: 10.1021/ac050035n. [DOI] [PubMed] [Google Scholar]
- 10.Berland KM, So PTC, Gratton E. Biophysical Journal. 1995;68:694. doi: 10.1016/S0006-3495(95)80230-4. [DOI] [PMC free article] [PubMed] [Google Scholar]
- 11.Brock R, Hink MA, Jovin TM. Biophysical Journal. 1998;75:2547. doi: 10.1016/S0006-3495(98)77699-4. [DOI] [PMC free article] [PubMed] [Google Scholar]
- 12.Politz JC, Browne ES, Wolf DE, Pederson T. Proceedings of the National Academy of Sciences of the United States of America. 1998;95:6043. doi: 10.1073/pnas.95.11.6043. [DOI] [PMC free article] [PubMed] [Google Scholar]
- 13.Schwille P, Haupts U, Maiti S, Webb WW. Biophysical Journal. 1999;77:2251. doi: 10.1016/S0006-3495(99)77065-7. [DOI] [PMC free article] [PubMed] [Google Scholar]
- 14.Ehrenberg M, Rigler R. Chemical Physics. 1974;4:390. [Google Scholar]
- 15.Aragon SR, Pecora R. Biopolymers. 1975;14:119. [Google Scholar]
- 16.Kask P, Piksarv P, Pooga M, Mets U, Lippmaa E. Biophysical Journal. 1989;55:213. doi: 10.1016/S0006-3495(89)82796-1. [DOI] [PMC free article] [PubMed] [Google Scholar]
- 17.Lakowicz JR. Principles of Fluorescence Spectroscopy. 2. Plenum Press; New York, NY: 1999. [Google Scholar]
- 18.Corrie JET, Craik JS, Munasinghe VRN. Bioconjugate Chemistry. 1998;9:160. doi: 10.1021/bc970174e. [DOI] [PubMed] [Google Scholar]
- 19.Weber G. Adv Protein Chem. 1953;8:415. doi: 10.1016/s0065-3233(08)60096-0. [DOI] [PubMed] [Google Scholar]
- 20.Weber G. J Opt Soc Am. 1956;46:962. [Google Scholar]
- 21.Dandliker WB, Feigen GA. Biochem Biophys Res Commun. 1961;5:299. doi: 10.1016/0006-291x(61)90167-x. [DOI] [PubMed] [Google Scholar]
- 22.Alms GR, Bauer DR, Brauman JI, Pecora R. Journal of Chemical Physics. 1973;59:5310. [Google Scholar]
- 23.O’Konski CT, Zimm BH. Science. 1950;111:113. doi: 10.1126/science.111.2875.113. [DOI] [PubMed] [Google Scholar]
- 24.Li LS, Alivisatos AP. Physical Review Letters. 2003:90. doi: 10.1103/PhysRevLett.90.097402. [DOI] [PubMed] [Google Scholar]
- 25.Zero KM, Pecora R. Macromolecules. 1982;15:87. [Google Scholar]
- 26.Snyder G, Chen BZ, Vereb G, Jovin T, Selvin P. Biophysical Journal. 1998;74:A179. doi: 10.1016/S0006-3495(98)77930-5. [DOI] [PMC free article] [PubMed] [Google Scholar]
- 27.Vasanthi R, Ravichandran S, Bagchi B. Journal of Chemical Physics. 2001;114:7989. [Google Scholar]
- 28.Garcia de la Torre J, Lopez Martinez MC, Tirado MM. Biopolymers. 1984;23:611. [Google Scholar]
- 29.Broersma SJ. J Chem Physics. 1960;32:1626. [Google Scholar]
- 30.Broersma SJ. J Chem Physics. 1960;32:1632. [Google Scholar]
- 31.Widengren J, Mets U, Rigler R. Chemical Physics. 1999;250:171. [Google Scholar]
- 32.Larson DR, Zipfel WR, Williams RM, Clark SW, Bruchez MP, Wise FW, Webb WW. Science. 2003;300:1434. doi: 10.1126/science.1083780. [DOI] [PubMed] [Google Scholar]
- 33.Murray CB, Norris DJ, Bawendi MG. Journal of the American Chemical Society. 1993;115:8706. [Google Scholar]
- 34.Manna L, Scher EC, Li LS, Alivisatos AP. Journal of the American Chemical Society. 2002;124:7136. doi: 10.1021/ja025946i. [DOI] [PubMed] [Google Scholar]
- 35.Peng ZA, Peng XG. Journal of the American Chemical Society. 2002;124:3343. doi: 10.1021/ja0173167. [DOI] [PubMed] [Google Scholar]
- 36.Enderlein J, Gregor I, Patra D, Fitter J. Curr Pharm Biotechnol. 2004;5:155. doi: 10.2174/1389201043377020. [DOI] [PubMed] [Google Scholar]
- 37.Ha T, Laurence TA, Chemla DS, Weiss S. Journal of Physical Chemistry B. 1999;103:6839. [Google Scholar]
- 38.Nirmal M, Dabbousi BO, Bawendi MG, Macklin JJ, Trautman JK, Harris TD, Brus LE. Nature. 1996;383:802. [Google Scholar]
- 39.Kuno M, Fromm DP, Hamann HF, Gallagher A, Nesbitt DJ. Journal of Chemical Physics. 2000;112:3117. [Google Scholar]
- 40.Vasanthi R, Bhattacharyya S, Bagchi B. Journal of Chemical Physics. 2002;116:1092. [Google Scholar]
- 41.Tirado MM, Garcia de la Torre J. J Chem Physics. 1979;73:1986. [Google Scholar]
- 42.Tirado MM, Lopez Martinez MC, Garcia de la Torre J. J Chem Physics. 1984;81:2047. [Google Scholar]
- 43.Sheely ML. Industrial and Engineering Chemistry. 1932;24:1060. [Google Scholar]
- 44.Guo XQ, Castellano FN, Li L, Lakowicz JR. Analytical Chemistry. 1998;70:632. doi: 10.1021/ac970827k. [DOI] [PMC free article] [PubMed] [Google Scholar]
- 45.Tanner RE, Herpigny B, Chen SH, Rha CK. Journal of Chemical Physics. 1982;76:3866. [Google Scholar]
Associated Data
This section collects any data citations, data availability statements, or supplementary materials included in this article.
Supplementary Materials
A diagram of the experimental setup for pol-FCS is provided in the supporting information. This material is available free of charge via the internet at http://pubs.acs.org.