

Abstract
The primary goal of this study was to establish whether inhibition of GABA synthesis was sufficient to induce network hyperexcitability in a rat hippocampal slice model comparable to that seen with GABA receptor blockade. We used field and intracellular recordings from the CA1 region of rat hippocampal slices to determine the physiological effects of blocking GABA synthesis with the convulsant, 3-mercaptoproprionic acid (MPA). We measured the rate of synthesis of GABA and glutamate in slices using 2-13C-glucose as a label source and liquid chromatography-tandem mass spectrometry. There was little effect of 3.5 mM MPA on evoked events under control recording conditions. Tissue excitability was enhanced following a series of stimulus trains; this effect was enhanced when GABA transport was blocked. Evoked inhibitory potentials (IPSPs) failed following repetitive stimulation and MPA. Spontaneous epileptiform activity was seen reliably with elevated extracellular potassium (5 mM). GABA synthesis decreased by 49% with MPA alone and 45% with the combination of MPA and excess potassium; GABA content was not substantially altered. Our data indicate: 1) GABAergic inhibition cannot be significantly compromised by MPA without network activation; 2) GABAergic synaptic inhibition is mediated by newly synthesized GABA; 3) There is a depletable pool of GABA that can sustain GABAergic inhibition when synthesis is impaired under basal, but not activated conditions and 4) overt hyperexcitability is only seen when newly synthesized GABA levels are low.
Introduction
There is significant ongoing work aimed at understanding the specific roles of synaptic and extrasynaptic GABA in regulating neural activity in both normal and pathological conditions. Precise GABAergic synaptic signaling is critical to the accurate transmission of information within neural circuits and even slight disruptions can produce hypersynchronous activity, for example (Chagnac-Amitai and Connors, 1989). Moreover, changes in ambient GABA can alter tonic inhibition and thus the overall synaptic tone of a brain region (Farrant and Nusser, 2005). The majority of these studies have assumed a stable level of presynaptic GABA and the goal of the present work was to determine the effect of blockade of GABA synthesis on network excitability.
The mechanisms of GABA synthesis and degradation are well understood. Glutamate (either transported into the neuron via EAAT3 or synthesized from glutamine) is decarboxylated to GABA via glutamic acid decarboxylase (GAD). GABA that is released into the synaptic cleft is transported into both astrocytes and interneurons through specific transporters. Transported GABA can be repackaged for subsequent release in interneuronal terminals while astrocytic GABA is usually metabolized via GABA-transaminase (GABA-T). These metabolic cycles are reviewed in (Martin and Tobin, 2000) and (Bak et al., 2006)
However, there is an increasing recognition that regulating neurotransmitter metabolism provides another avenue for neuromodulation. In terms of the GABAergic system, the anticonvulsant vigabatrin enhances the GABA content of neurons and glia by blocking its degradation, thereby increasing vesicular concentrations (e.g. (French, 1999)) while the expression of the synthetic enzyme, GAD, is enhanced following a seizure (Esclapez and Houser, 1999, Feldblum et al., 1990). Moreover, both experimental and modeling studies have shown that modulating the intracellular content determines the degree of vesicular GABA release (Axmacher et al., 2004, Engel et al., 2001, Wu et al., 2001). More recently, Liang et al, 2006 showed that blocking neuronal glutamine uptake reduces evoked inhibitory potentials (IPSCs) in a highly use-dependent fashion, presumably by limiting glutamate availability within interneurons. Similar data were presented by Fricke et al, 2007.
Studies using isotopically labeled compounds suggest that the bulk of GABA that is released during neurotransmission is freshly synthesized from glutamine rather than transported from the extracellular space (Waagepetersen et al., 2001). In addition, there is evidence that GAD and the vesicular transporter for GABA (vGAT) form a protein complex (Jin et al., 2003). These data suggest that newly synthesized GABA may be a preferred substrate for vesicle loading. Consistent with the hypothesis that synaptic inhibition relies on newly synthesized GABA, transported glutamate is used for GABA synthesis (Mathews and Diamond, 2003) and blocking neuronal glutamate transport is associated with seizure activity in vivo (Sepkuty et al., 2002). The consequences of this dependence on freshly synthesized GABA, as compared to transported and repackaged transmitter, have not been studied in detail using in vitro preparations where better controlled studies of physiological responses can be obtained.
There is an extensive literature showing that seizures can be provoked by blocking GABA synthesis with 3-mercaptoproprionic acid (MPA) in vivo (Mares et al., 1993). However, little work has been done using MPA in vitro. The studies of Engel et al, (2001) found that there was a small decrease in both the frequency and amplitude of spontaneous IPSCS following MPA exposure in organotypic slices. However, there was no apparent depletion of GABA as determined ultrastructurally. Similar findings were reported by Golan et al, 1996. We hypothesize that the absence of sufficient synaptic activity needed to drive GABA metabolism could account for the limited effect of MPA in these reports. We tested this hypothesis using physiological recording from rat hippocampal slices; the effect of MPA on GABA synthesis was also directly measured in a parallel set of experiments using mass spectrometry to measure the synthesis of GABA from 13C labeled glucose. The primary goal of this study was to establish whether GABA synthesis inhibition was sufficient to induce network hyperexcitability in a rat hippocampal slice model comparable to that seen with GABA receptor inhibition and thus the extent to which interruptions in GABA metabolism can induce seizure-like activity.
Experimental Procedures
Slice preparation
We used adult rats, 2-4 months of age because of the in vivo data showing that MPA has differential effects in mature and immature brain when studied in vivo (Netopilova et al., 1995). The animals were deeply anesthetized with Na pentobarbital and decapitated. The brain was rapidly removed and placed in oxygenated ice cold cutting solution for 3-5 minutes. The cutting solution was made of artificial cerebrospinal fluid (ACSF) in which the NaCl was replaced iso-osmotically with sucrose. When the brain was firm, it was bisected and the dorsal surface of the brain was trimmed to provide a flat mounting surface. The hemibrains were glued, ventral side up to the stage of a vibratome (The Vibratome Company, St. Louis, MO) and 400 μm slices were prepared. Slices were transferred to an interface type recording chamber (Fine Science Tools, Foster City, CA) where they were maintained with oxygenated (95% O2/5% CO2) artificial cerebrospinal fluid (ACSF; flow rate = 1-2 ml/min; 31-32°C). The ACSF contained in mM: 124 NaCl, 3 KCl, 2 CaCl2, 26 NaHCO3, 1.3 MgSO4, 1.25 NaH2PO4, and 10 glucose. The slices equilibrated for 1½ - 2 hrs prior to recording.
These experiments were approved by the Yale IACUC and are in compliance with NIH animal care regulation. All efforts were made to minimize animal suffering and to limit the number of animals used,
Electrophysiology
Field potential recordings were made using ACSF-filled patch pipettes with resistances of 5-20 MΩ. The recording electrode was placed in the pyramidal cell layer of CA1 and a twisted bipolar electrode was placed in stratum radiatum to activate the Schaffer collaterals. The stimulus intensity was set at twice that needed to evoke a 2 mV population spike; the stimulus duration was set at 0.1 ms. This stimulus intensity ranged from 0.2 to 0.7 mA. Only slices in which a stable > 5 mV population spike could be obtained were studied. The variables that were measured include the population spike amplitude, the slope of the postsynaptic potential (psp), the duration of the event and the number of population spikes. Only spikes with amplitudes > 2 mV were included in the analysis. Data were acquired using an Axoclamp 2B and Axograph 4.9 software (Molecular Devices, Sunnyvale, CA). Data were stored on a Macintosh G3 computer.
Intracellular recordings were made using sharp electrodes filled with 4M K-Acetate, resistances 50 to 100 MΩ. The criteria for including a cell in the analysis were a resting membrane potential more hyperpolarized than -55 mV with an input resistance greater than 40 MΩ. The IPSP conductance (GIPSP) was determined using previously described methods (Patrylo et al., 2001). Briefly, an IPSP was elicited at membrane potentials ranging from -90 to -50 The intensity used was twice that needed to evoke a single spike from -70 mV. The conductance was taken as the difference between the membrane conductance measured before the stimulus and at the peak of the fast IPSP. In cases where there was not a clear IPSP, the conductance was measured at 21 ms. The conductance was only used for statistical analysis when the event reversed near -70 mV as a pronounced depolarizing event was observed following GAD inhibition that confounded the analysis.
Measurement of GABA. Glutamine, Glutamate, and Creatine using liquid chromatography-tandem-mass-spectrometry (LC/MS/MS)
In order to quantify the changes in GABA concentration and synthesis following bath application of MPA, we used tandem mass spectrometry of hippocampal slices exposed to the same conditions as those used in the physiological studies. This method uses two mass spectrometers in series to identify compounds by their molecular mass and characteristic fragmentation.
For these experiments, hippocampal slices were allowed to recover in normal ACSF in tissue culture plates. These plates were placed in a warmed (35oC), oxygenated chamber. After a two hour recovery period, the slices were moved to the experimental wells which contained 10 mM 2-13C glucose and either 3.5 mM MPA, 5 mM potassium(K+) or both. The osmolarity of the ACSF was maintained constant using sucrose. The slices were removed at 0.5, 1 and 2 hours of incubation in 2-13C glucose and frozen on dry ice. The tissue (two slice per sample 14-16 mg wet weight) was then homogenized in 0.1 M phosphate buffer at approximately 20% w/v.
Following homogenization, the protein was precipitated by addition of an internal standard solution containing 0.1 mM d5-glutamate, 0.1 mM L d3-creatine, 0.1 mM d6-GABA, and 5 μM 13C5, 15N2-glutamine in acetonitrile. The standards were purchased from (Cambridge Isotope, Cambridge, MA). The compounds were separated with baseline resolution by chromatography on a short Supelcosil LC-8 column using 1mmol/L aqueous pentadecafluorooctanoic acid (PDFOA) and methanol in a linear gradient (20% PDFOA to 100% methanol). Analysis time for each sample was 2.5 minutes.
GABA concentration was measured by LC/MS/MS after butylation as previously described (Bolteus et al., 2005). After centrifugation to remove precipitated proteins, 25 μl supernatant was transferred to a V-bottom polypropylene microplate and evaporated using warm air. Butanolic HCl (25 μl) was added, and the plate was sealed and heated to 60 °C for 20 min. The butanolic HCl was evaporated with warm air and the residue was dissolved in 25 μl 80% methanol/water. Butylated GABA was quantified using an Applied Biosystems API2000 triple quadrupole mass spectrometer using the TurboIonSpray ionization probe. The butylated GABA (5 μl) was injected onto a Supelcosil LC-CN column (3.3 by 46 mm, 3 μm, Supelco) and eluted with a 0.5 min gradient of 25% to 100% methanol with solvent A = 1 mM pentadecafluorooctanoic acid in water. The column was held at 100% methanol for 1 min after the gradient and then allowed to equilibrate for 1 min at 25% methanol. Although butylated GABA eluted at 1.7 to 1.8 min, shortening the gradient resulted in earlier elution and lower peak heights. The effluent was split 1:5 before entering the mass spectrometer that was operated in positive ion mode. Data were acquired at unit resolution for both resolving quadrupoles (0.7 amu width at half height), monitoring for the 160 to 87 m/z and 166 to 93 m/z transitions for butylated GABA and d6-GABA, respectively. Nitrogen was used as collision gas at an instrument setting of 6. All of the mass spectrometer parameters including the orifice and collision voltages were automatically optimized by the Quantitative Optimization feature of the Analyst software using a continuous infusion of 10 nM butylated GABA. Butylated GABA concentrations were calculated using Analyst software by comparison with a standard curve of identically prepared standards containing 0.025 to 15 μM GABA in PBS. The limit of quantitation of the assay is <5 nM with coefficient of variation of 5%.
Glutamate, glutamine and creatine were quantified in 20% of the column effluent using the electrospray interface of a triple quadrupole tandem mass spectrometer (Applied Biosystems API2000, Foster City, CA) in positive ion mode. All analyses were performed using multiple reactions monitoring with unit resolution in both resolving quadrupoles. The transitions used for quantification of the unlabeled, singly labeled, and doubly labeled glutamine are: 147 to 130 m/z, 148 to 131 m/z, and 149 to 132 m/z, respectively. This allows differentiation of glutamate singly labeled in the first carbon (149 to 102 m/z transition) from glutamate labeled in other positions (149 to 103 m/z transition). For doubly labeled glutamate, the corresponding transitions are 150 to 103 m/z and 150 to 104 m/z. Creatine, which was used as an internal concentration reference, was quantified by monitoring the 132 to 44 m/z transition with the 44 m/z fragment. corresponding to the guanidino group. Singly labeled creatine is the sum of the 133 to 44 m/z and 133 to 45 m/z transitions. Concentrations of each compound were calculated using Analyst software by comparison to a standard curve which is prepared using horse serum dialyzed against PBS to compensate for matrix effects. The limit of quantitation of the assay is 0.1 μM for unlabeled compounds and 10-50 nM for labeled compounds. Quality control samples, prepared with dialyzed horse serum, were analyzed with each run and have an inter-assay coefficient of variation of 2-4% for each unlabeled compound.
All drugs were made up immediately prior to the experiment and were bath applied. Both NO-711 and MPA were obtained from Sigma-Aldrich (St. Louis, MO). The 13C glutamate and LC/MS/MS standards were was obtained from Cambridge Isotope Laboratories (Andover, MA) or Sigma-Aldrich (St. Louis, MO).
Analysis
The isotopic enrichment (IE) of glutamate or GABA from 2-13C glucose was quantified as the % labeled amino acid/total amino acid. The data for each experimental condition and at each time point was averaged. A t-test was used to compare the effects of MPA between groups for both the physiological and spectrometric data. Data are given as mean ± standard error of the mean. Significance was set at p<0.05.
Results
Field Potential Recordings
In the first set of experiments, we examined the effect of MPA on field potentials in the CA1 region using low frequency stimulation (0.1 to 0.2 Hz). We examined the effect of 2.5, 3.5 and 5 mM MPA. We saw no clear effects under any recording conditions at MPA concentrations < 1.0 mM and evidence of toxicity at 5.0 mM. This included a decrease in the amplitude and slope of the population spike over a one hour period. Therefore, for the balance of these studies, we used 3.5 mM MPA in which the synaptic responses could be maintained for over 5 hours.
We found that there was little effect of MPA on any of the variables tested when the slices were not stimulated. First, we obtained stable synaptic responses in control ACSF and washed on 3.5 mM MPA for 30 minutes while stimulating at 0.1 Hz. Figure 1A shows that at this time point, there were no changes in the amplitude, slope or duration of the field potentials when the slices were stimulated at a low frequency, n=6. In the second set of experiments, unstimulated slices were examined at varying times following the wash-on of MPA ranging from 50 to 300 minutes, n=7. These data are shown in Figure 1B. Note that there was no correlation between the duration of exposure to MPA and the physiological responses. These data demonstrate that decreasing GABA synthesis in slices does not affect network excitability in the absence of robust synaptic activity.
Figure 1.
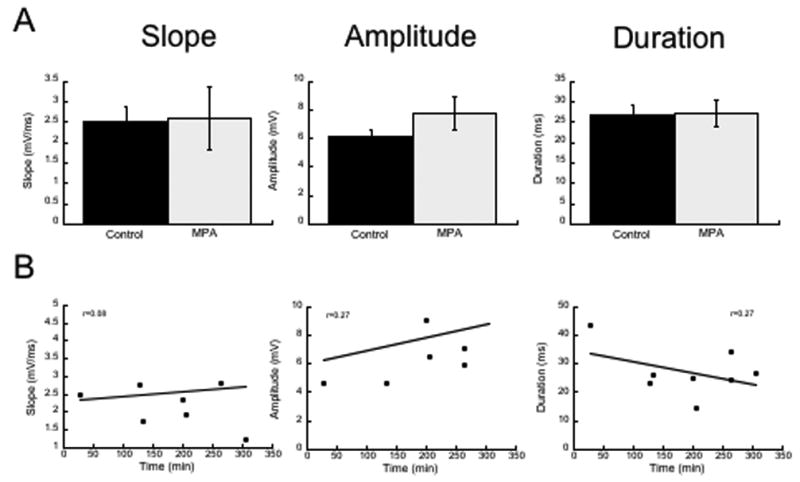
Incubation in 3.5 mM MPA does not alter the synaptic properties in the CA1. A Shows the group data for the three variables measured. B Shows that there was no relationship between the duration of exposure to the drug and these variables.
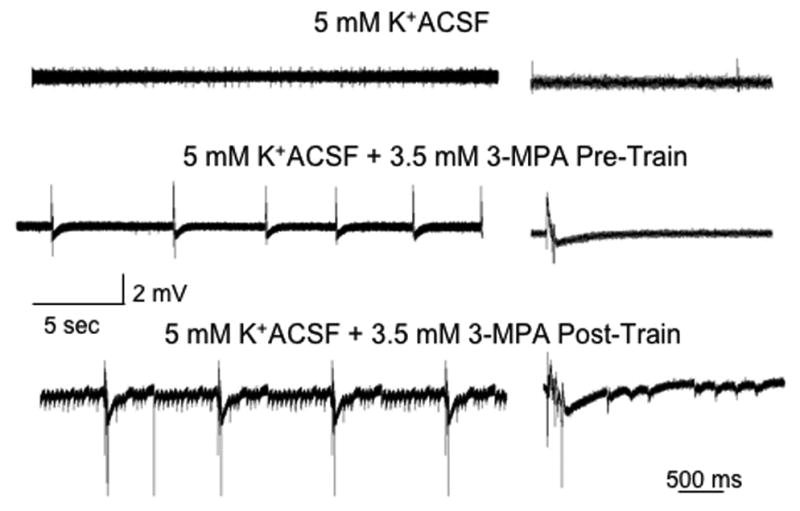
However, as shown in Figure 2, the effects of MPA on evoked responses were highly activity dependent. This was tested by delivering three 10 Hz, 10 sec trains (5 minute interval between trains) in control and following a 30 minute application of MPA, n=6. The effects of the trains were assayed at least 10 minutes following the last train to limit the possibility of short term plasticity. In control medium, there is no significant change in these variables following this stimulation paradigm, data not shown.
Figure 2.

A. Examples of the evoked responses seen in the presence of MPA. The upper traces show the response at 2T (see Methods) and the maximum response evoked are shown below. Note that there is little evidence for hyperexcitability until a series of stimulus trains were delivered. The inset shows that first 45 ms of the response on an expanded time scale. B Shows that there was a significant increase in the duration of the evoked response following stimulus trains, but not of the amplitude or slope. C shows the data presented as percent change. D demonstrates the significant increase in the number of evoked population spikes before and after the trains (delivered at 2T).
Figure 2A shows representative traces at twice threshold and for the maximal response before and following synaptic trains. Note that there was a highly significant increase in the percent change in the response duration following the trains following bath application of MPA (p<0.01), Figure 2C. This effect was seen for the grouped data for the duration and the number of population spikes seen following a single stimulus (Figure 2B).
Effects of NO711 to block uptake
It was notable, however, that we were unable to induce spontaneous activity in any slices in response to repeated 10 Hz, 10 sec stimulus trains in spite of the obvious loss of inhibitory potentials following repetitive stimulation. In 2/12 experiments, we were able to induce spontaneous seizure-like activity following more than eight, 10 Hz, 10 sec trains. These data suggest that it is possible, albeit difficult, to deplete GABA stores sufficiently to induce spontaneous activity reminiscent of that seen in the presence of GABAA receptor antagonists. We hypothesized that the inability to generate spontaneous activity could be due to repackaging and subsequent release of transported GABA. To test this, we repeated these studies in the presence of 100 μM NO-711, an antagonist of GAT-1, the principal neuronal GABA transporter in the hippocampus. We observed a significant difference in the duration of the post-train responses between control ACSF and in NO-711 (42.9 ± 4.09 ms MPA, 56.3 ± 5.2 ms MPA+NO-711; p<0.01). There was a prolongation of the mean duration of the pre-train evoked response in NO-711 compared to control ACSF, but this did not reach significance. However, there were no significant differences between the slope and PS amplitude when NO-711 was bath applied with MPA, either pre- or post-train.
However, as above, we did not observe any spontaneous activity in the presence of NO-711 after three to six stimulus trains. Taken together, these data suggest that there is a contribution of GABA transport that helps to limit the effects of MPA, but this shift is not sufficient to induce network hyperexcitability.
Effect of MPA and Elevated potassium
Our central hypothesis was that the effects of MPA would require robust afferent input to be observed. This was the case and, as shown, in Figure 2 and Table 1, there was a pronounced use-dependence for the effects of MPA. It was surprising, however, that this shift in excitability was insufficient to induce spontaneous seizure-like activity generated in CA3.
Table 1.
Effects of NO-711 on field potential properties recorded in MPA
| Slope (mV/ms) | Amplitude (mV) | Duration (ms) | |
|---|---|---|---|
| MPA Pre-Train | 2.64 ± 0.56 | 7.75 ± 1.15 | 27.32 ± 3.21 |
| MPA Post-Trains | 2.53 ± 0.63 | 6.4 ± 0.72 | 42.93 ± 4.08* |
| NO-711 +MPA Pre-Train | 2.99 ± 0.64 | 5.77 ± 1.08 | 35.00 ± 4.5 |
| NO-711 +MPA Post-Train | 2.53 ± 0.63 | 6.42 ± 0.72 | 42.93 ± 4.08 ** |
There were no significant effects of bath application of the GAT1 inhibitor NO-711 on the slope or amplitude of the evoked responses. However, NO-711 produced a significant prolongation of the evoked response both pre (* p<0.05) and post-train (** p<0.01).
We hypothesized that the inability to generate spontaneous network driven activity under these recording conditions reflected the focal nature of the stimuli and that insufficient numbers of CA3 pyramidal neurons were sufficiently disinhibited to produce synchronous activity in CA1. We tested this hypothesis by increasing tissue excitability by raising extracellular K+ ([K+]o). It is well established that elevations in extracellular K+ enhance network activity through a number of mechanisms and can produce spontaneous seizure-like activity in CA1 at 8.0 mM (McBain, 1995, Rutecki et al., 1985, Sanchez-Vives and McCormick, 2000) Therefore, we only used concentrations of K+ that were not associated with spontaneous activity in control ACSF, i.e.<6.0 mM.
Consistent with previous data, we did not observe spontaneous activity either following low frequency or a series of stimulus trains in concentrations of [K+]o ranging from 4 to 5.5 mM. When MPA was applied to the bath (at least 20 minutes; stimulation rate 0.1 Hz), the ability to observe spontaneous activity was variable, depending on the [K+]o. No spontaneous activity was seen either before or following stimulus trains in [K+]o below 4.5 mM, n=5 slices. However spontaneous bursting activity was seen 1/8 slices before and 5/8 slices following a series of stimulus trains (p<0.05 using Chi2). At both 5 and 5.5 mM, spontaneous activity was seen in the majority of slices before trains and in all slices following trains, Figure 3B. The frequency or duration of these events was not dependent on the [K+]o, Figure 3C. There was, however a significant increase in the frequency of seizure-like events (duration >1 sec) with afterdischarges at higher concentrations (p<0.05).
Figure 3.
A modest elevation in the extracellular K from 3.5 to 5.0 mM had no effect on baseline activity. Following the addition of 3.5 mM MPA, we noted the development of spontaneous synchronized activity. Following a series of stimulus trains, these events became more prolonged and had clear tonic and clonic components.
MPA-Induced Decrease in Evoked IPSPs was also Use-dependent
The field potential allows for the assessment of slow changes in synaptic events as the evoked responses are stable for hours. However, they do not provide much information on any underlying mechanisms. We verified that GABA-mediated events were affected using intracellular recordings in control and in MPA to measure changes in the evoked IPSP. Consistent with the field potential data, there was little change in the fast, GABAA receptor-mediated IPSP conductance in MPA with low frequency stimulation over a 90 minute time frame; examples are shown in Figure 4A. As shown in Figure 4B, there was a slow decrease in the IPSP conductance over the course of three hours in the drug, but there was no significant difference in GIPSP between control and in the presence of MPA for < 90 minutes, p>0.05. The mean IPSP conductance in control ACSF was 78.1 ± 8.5 mS (n=10) and was 85.3 ± 14.7 mS (n=8) in MPA under 90 minutes. After 90 minutes, however, there was a steady decrease in the IPSP conductance in slices stimulated at less than 0.1 Hz. There was a significant correlation between the IPSP conductance and time in MPA demonstrating that even in unstimulated conditions, the drug is having an effect on inhibitory function, p<0.05. However, as with the field recordings, we did not note a significant increase in spontaneous synaptic activity with these intracellular recordings.
Figure 4.
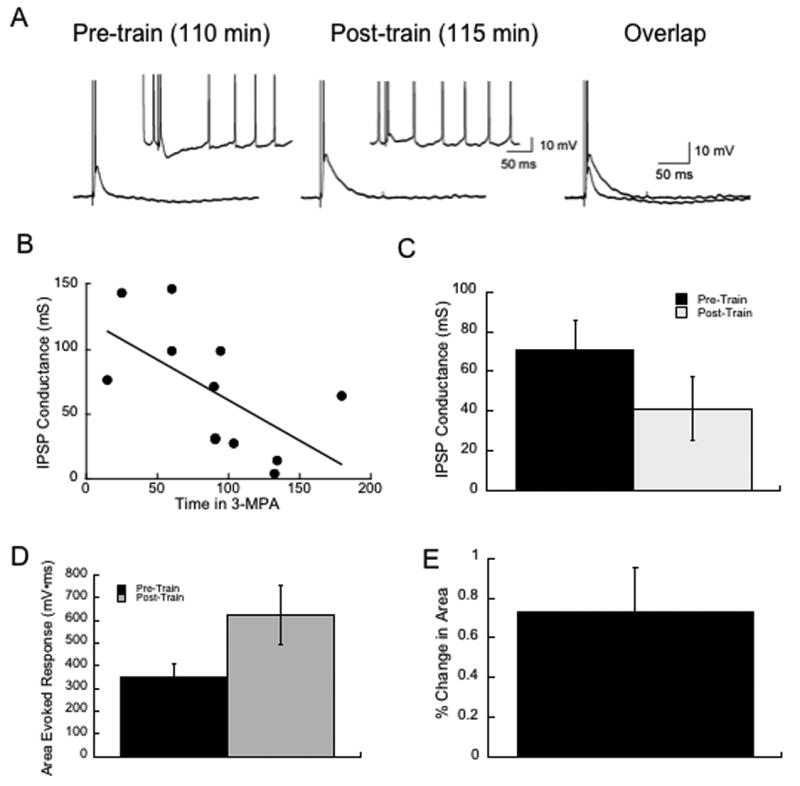
Intracellular recordings show that IPSPs are preserved in MPA up to 90 minutes following bath application Example traces are shown in A. B. Shows the relationship between time and the IPSP conductance. C shows that there was a drop in the IPSP conductance following a train, p=0.08. D Shows that there was a significant increase in the area of the evoked response between the pre- and post train events, measured at -70 to reduce any effect of the IPSP itself. E. Shows the % Change in area produced by the trains.
However, independent of the time in MPA, following repetitive stimulation, the IPSP failed rapidly and was often replaced with a large depolarization mediated presumably by unchecked excitatory input. We used the area of the evoked response at -70 mV as a measure of this shift from inhibition to excitation. Figure 4C1 and 2 show that there is a significant increase in the area of the evoked response after a single 10 Hz, 10 sec stimulus train is shown both as the raw data and as the percent change. This effect was significant by a paired t-test, p<0.02, n=12. The degree to which the area increased was not correlated with the time in drug or in the area of the baseline response.
In contrast, as previously shown, repetitive stimulation in control ACSF was associated with an increased GABAergic conductance (e.g. (Liang et al., 2006)). In our hands we noted a similar, but non-significant increase in the IPSP conductance and a corresponding decrease in the area of the evoked response in cells studied in control ACSF, n=6, data not shown.
The IPSP studies provide a measure of phasic inhibition but do not address any possible changes in tonic inhibition, i.e. GABA acting at slowly inactivating extrasynaptic receptors (see (Farrant and Nusser, 2005) for review). We cannot directly measure tonic inhibition with these methods, but can estimate it by measuring changes in neuronal input resistance. In ten cells from eight rats we compared the input resistance before and ten minutes following a 10 Hz, 10 sec train in the presence of MPA (average exposure time 173.8 ± 88.4 minutes). We noted a significant increase in the neuronal input resistance following the train of 27.1 ± 3.1%, p<0.001, paired t-test. The mean pre-train input resistance was 40.8 ±3.05 MΩ and 52.4 ± 3.9 MΩ post-train. This change is likely to be mediated by a reduction in tonic inhibition as we did not observe this effect in the presence of MPA and bicuculline, (pre-train 39.5 ± 7.7 MΩ; post-train 40.0 ± 8.7 MΩ, n=5).
LC/MS/MS studies of GABA metabolism
A critical question in the interpretation of these data is the extent to which both total GABA levels and GABA synthesis are altered by MPA. To address this issue, we incubated slices in the presence of 2-13C-glucose and measured the total GABA and glutamate slice content and the isotopic enrichment (%13C) of GABA and glutamate. The isotopic enrichment of glutamate and GABA measures the viability of the brain slice preparation and the ability of neuronal mitochondria to synthesize glutamate from 2-13C-glucose (Petroff et al., 2002, Petroff et al., 2000, Rothman et al., 1985). As glutamate is the immediate precursor of most freshly synthesized GABA, the ratio of %13C-GABA to %13C-glutamate approaches unity (1.0) at steady state. As noted above, we used liquid chromatography coupled to tandem mass spectrometry (LC/MS/MS) to measure both the total slice content and isotopic enrichment (%13C) of GABA, glutamate and creatine. The sensitivity of LC/MS/MS allows for a determination of the change in mass associated with the 13C label.
In a preliminary series of experiments, we used a manual chopper (Harvard Apparatus, Cambridge, MA) and found that these slices were metabolically less viable (based on the mass spectrometry data) than those prepared using the vibratome. Notably, the chopped slices had a lower isotopic enrichment of GABA and glutamate than slices prepared with a vibratome, n=4 replications from 3 animals. Based on these data, all the data presented below are based on vibratome slices.
We incubated slices for 0.5, 1 and 2 hours under four different conditions: control ACSF, 3.5 mM MPA, 5 mM K+ and 5 mM K+ and 3.5 mM MPA. A total of six animals were used for this experiment and two slices were used for each determination. The experiments were performed in quadruplicate. As shown in Figure 5A, %13C-glutamate steadily increased during the two hour experiments, thereby demonstrating the viability of the brain slices under all conditions tested. Glutamate is synthesized by all functioning mitochondria, primarily by those localized in glutamatergic neurons. After two hours of incubation, isotopic enrichments of 31-37% were achieved; under steady state conditions, isotopic enrichments of about 50% would be expected using 2-13C-glucose as the label source (Sibson et al., 2001). Surprisingly, the tricarboxylic acid cycle rate was not increased in the slices (combined group) that were treated with both MPA and higher potassium and, therefore, would be expected to have spontaneous epileptiform activity (see Figure 3).
Figure 5.

A. Panel A shows the increase in the isotopic enrichment of glutamate over two hours, which demonstrates the ability of mitochondria, primarily located in glutamatergic neurons, to synthesize glutamate during the two hour experiment. The rate of glutamate synthesis under all four conditions was the same. The error bars indicate the standard error. Panel B shows the increase in the isotopic enrichment of GABA, which demonstrates the ability of mitochondria located in GABAergic neurons to synthesize GABA. As expected, MPA inhibited GABA synthesis. Panel C shows the change of the intracellular glutamate content of the slice over two hours. Glutamate content decreased steadily with MPA (p<0.018) over two hours. Panel D shows the change in intracellular GABA content over two hours. There were no significant differences in GABA content after two hours among the four conditions tested.
Under conditions of normal (3.5 mM) and elevated (5.5 mM) potassium, the isotopic enrichment of GABA followed the isotopic enrichment of its precursor glutamate (Figure 5B). After two hours the ratio of %13C-GABA to %13C-glutamate reached 0.83 ± 0.03 for the control potassium and 0.78 ± 0.02 for the higher concentration. The data demonstrate that the GABAergic neurons were actively synthesizing new GABA from the freshly synthesized 13C-glutamate. In contrast, there was a profound inhibition of GABA synthesis in the presence of both MPA (p<0.005) and MPA plus 5.5 mM potassium (p<0.001). This effect was greater in the presence of MPA and elevated potassium, although there was no significant difference between the two MPA experiments. The two hour mark was based on the timing of the electrophysiological studies described above.
The intracellular glutamate content decreased steadily with MPA (p<0.018) over two hours. The combination of higher potassium and MPA increased intracellular glutamate content (p < 0.014) compared with the effect of MPA alone by two hours. Surprisingly, there was no significant change in the total intracellular GABA (Figure 5D) content under these different experimental conditions.
Discussion
Summary
In this set of experiments, we used a variety of physiologic and analytic methods to examine the consequences of GAD inhibition on network excitability in the rat hippocampus. There is a renewed awareness of the interaction between metabolism and excitability as the relationships between different aspects of neurotransmitter cycling are established. The majority of the studies detailing the metabolic fate of GABA and its distribution in different pools have relied on NMR studies in cultured cells or from ex vivo extracts and there have been few attempts to link the metabolic fluxes with physiologic consequences. In order to fully understand the physiologic consequences on GABAergic inhibition of altering neurotransmitter cycling, our approach was to start at the final step and work backwards. Thus, the primary goal of this study was to establish whether GAD inhibition alone was sufficient to induce network hyperexcitability in an isolated preparation comparable to that seen with GABA receptor inhibition.
The key findings of this study are that inhibition of GABA synthesis via GAD only produces hyperexcitability following repetitive stimulation, demonstrating a pronounced use dependence when studied both intra and extracellularly. This is consistent with the data showing that the regulation of IPSC amplitudes and of GABA release can be regulated by glutamine availability in use-dependent fashion (Fricke et al., 2007, Liang et al., 2006, Rae et al., 2003). In addition, our data with NO-711 indicate that under baseline conditions, neuronal GABA uptake does not provide a significant degree of GABA that is available for release under resting conditions, but does once frank hyperexcitability has been produced by repetitive stimulation. Despite this clear disinhibition, we were unable to observe seizure-like activity comparable to that seen with GABAA receptor blockade until basal excitability was increased with elevated K+. Finally, the LC/MS/MS data demonstrate that there is no significant change in the size of the GABA pool, even under conditions where synchronized activity is present (MPA + 5 mM K+). However, as expected, MPA significantly decreased the amount of newly formed GABA. These biochemical data demonstrate that full blown network excitability is seen only with a combination of >70% decrease in newly synthesized GABA with a concomitant moderate elevation in neuronal excitability. Thus, these data are comparable to those in circuit modeling studies showing that GABAergic inhibition is highly context-dependent (Tagamets & Horowitz, 2000).
GABA Pools in Cortical Tissue
Our data provide additional evidence that there are distinct pools of GABA within the brain (e.g. (Rae et al., 2003)); as demonstrated by the LC/MS/MS data showing that there is no significant change in total GABA levels when GAD is impaired. Our measurements are consistent with the data from Engel et al, 2001, who found no changes in GABA levels in cultured hippocampal neurons following incubation in MPA as determined with immunogold, and Fan et al, 1981, who reported that incubation or perfusion with 1.0 mM MPA for 1-2 hours failed to significantly alter intracellular GABA content of rat hippocampal or neocortical slices under basal conditions, but inhibited the potassium-evoked release of endogenous GABA.
The total tissue GABA concentration is dominated by cytosolic GABA that is generated by GAD67, which comprises ∼30% of total GAD, exists primarily in the active holo-enzyme isoform and synthesizes over half the GABA under basal conditions in vivo (Battaglioli et al 2003, Patel et al 2006). The non-vesicular release of GABA by the GAT-1 transporter, which is modulated by the cytosolic concentrations of GABA (synthesized by GAD67) and sodium, regulates tonic inhibition by controlling ambient non-synaptic extracellular GABA concentrations and can contribute to phasic inhibition by buffering synaptic GABA concentration (Wu et al 2007). Therefore, disruption of GAD67 activity by MPA would be expected to decrease cytosolic GABA levels, decrease extrasynaptic tonic GABA inhibition and impair regulation of synaptic GABAergic inhibition. However, in our experiments, cytosolic GABA remained the same within the timeframe of the current study and was able to maintain tonic inhibition and perhaps phasic inhibition under basal, but not activated conditions. Our data suggest, therefore, that MPA does not have a significant effect on GAD67 and that this GABA pool is relatively inert during the time frame studied here.
In contrast, the GABA that is involved in inhibitory synaptic transmission is generated predominately by GAD65 from astrocytically derived glutamine as determined by both physiologic and isoptomer studies (Fricke et al., 2007, Liang et al., 2006, Waagepetersen et al.,1999; Chowdhury et al, 2007) and is likely to be a small fraction of the total GABA concentration. Moreover, there is evidence that GAD65 and the vesicular transporter for GABA (vGAT) form a protein complex (Jin et al., 2003). These data suggest that neurotransmitter pools of GABA, freshly synthesized by the GAD65-vGAT aggregates clustered about the vesicular membranes, may be the preferred GABA source for vesicle loading (Wu et al 2007). Given that increased neuronal activity increases the rate of synaptic GABA synthesis by the GAD65-vGAT complex (Patel et al 2006, Chowdhury et al 2007), phasic inhibition by local GABA interneurons appears to reflect the function of the GAD65-vGAT complex.
Analysis of the effects of MPA on GAD65 is complicated because apo-GAD65, which is metabolically inactive, comprises the dominant state (catalytically inactive) of the enzyme. Because GAD65 operates at a small fraction of its maximal catalytic capacity, GAD65 may be involved in short-term changes in GABA synthesis flux and GABAergic function in phasic inhibitory neurons (Battaglioli et al 2003). Tissue GABA levels are about the same in wild type and homozygous GAD65-deficient mice; absence of GAD65 did not altered brain GABA concentrations significantly. Mild stress induces spontaneous seizures affecting limbic structures in these mice, and they are very sensitive to convulsants (reviewed in Martin & Tobin 2000, Petroff 2002). The cortical GABA content of adult mice heterozygous for GAD67 (+/−) deficiency are 21% lower than wild type; tissue GABA levels are exceedingly low (∼7% of normal) in mice born without GAD67. Taken together, these data support the hypothesis that MPA primarily inhibits GAD65 with relatively little impact on the GAD67 isoform.
Incubation in MPA Does Not Completely Block GABA Synthesis
In our brain slice model, high concentrations (3.5 mM) of MPA reduced GAD activity to 45-50% of control activity. We expected nearly complete inhibition, based on the published enzymological studies that reported inhibitory Michaelis coefficients (Ki) between 4.8 to 7.1 μM for rat brain and 2.7 μM for human cortex (Blindermann et al., 1978, Lamar, 1970, Netopilova et al., 1997). However, in vivo studies using rat models also reported only partial inhibition of GAD activity by 43-54% with a dose of 850 micromoles/kg and 38% inhibition after a dose of 660 micromoles/kg (Karlsson et al., 1974, Netopilova et al., 1997). Both groups reported maximal GAD inhibition 4-5 minutes after injection of MPA, which suggests that MPA rapidly crosses the blood-brain barrier and enters GABAergic neurons. Therefore, MPA would be expected to permeate the brain slice fully over the 30 to 120 minutes of our experiments.
However, these enzymological studies did not differentiate between GAD65 and GAD67. The degree of GAD inhibition seen in vivo and in the brain slice may depend on a variety factors; glutamate content would be critical because MPA inhibits GAD by competing with glutamate for the enzyme (Adcock and Taberner, 1978, Horton and Meldrum, 1973, Lamar, 1970). The intracellular glutamate content of GABAergic neurons controls the degree of GAD inhibition produced by MPA and could contribute to the partial (∼50%) inhibition reported consistently by studies of intact animal, cell culture and slice models including our own that used MPA concentrations 100-1000 fold greater the Ki of GAD. Alternately, in vitro ezymological studies suggest that MPA inhibits 4-aminobutyrate-transaminase (GABA-T) at concentration of 50-100 μM (Lamar, 1970, Loscher and Vetter, 1985). Therefore, MPA concentrations of 3.5 mM would be expected to inhibit GABA-T thereby potentially masking the decrease in intracellular GABA content that should accompany a reduction in GABA synthesis.
Finally a recent study, which paired microdialysis based measurements of MPA with electrocorticography, reported seizure onset at cortical extracellular concentrations of 58 and 92 μM following intraperitoneal injections of 470 micromoles/kg and 940 micromoles/kg with a lower threshold of 45 μM for seizure onset following intravenous administration (Crick et al., 2007). During status epilepticus, steady state extracellular concentrations of 120-130 μM for the cortex and 190-200 μM for the hippocampus were reported. These MPA concentrations are ten fold higher than the Ki for GAD measured in vitro. This dissociation calls into question whether GAD inhibition alone is sufficient to induce seizure activity. For example, Loscher reported that pre-treatment with the GABA-T inhibitor, gamma-acetylenic-GABA, failed to prevent seizures induced by MPA (470 micromoles/kg) and maintained above normal intracellular GABA concentrations, including above normal synaptosomal GABA concentrations (Loscher, 1986). In our brain slice model, spontaneous epileptiform activity was seen reliably only with the combination of MPA plus elevated extracellular potassium, even though GABA synthesis was decreased comparably by 45-50% under both conditions.
These changes in GABA synthesis seen in our slice model cannot, however, be attributed to impaired mitochondrial metabolism or tissue viability. First, the physiologic responses were very stable over time when exposed to MPA (Fig 1). Second, the pseudo-first order time constant for GABA synthesis, which reflects turnover time, increased three-fold (control 2.9 hours, MPA 9.2 hours), which demonstrated the significant inhibitory effects of MPA on GABA synthesis in our brain slice preparation. MPA stimulated neuronal mitochondrial activity by ∼25% (time constant for glutamate synthesis control 2.1 hours, MPA 1.6 hours), which demonstrated that the dose of MPA used was not toxic to synaptic mitochondria. Combined treatment with 5 mM potassium and 3.5 mM MPA, further slowed GABA synthesis rates (GABA time constant 13.4 hours) without evidence of mitochondrial toxicity (glutamate time constant 1.9 hours). Thus the smaller than expected effect of MPA on GABA synthesis reflects the complexity of the GABAergic system and the proposed selectivity of MPA for GAD65.
Use-dependence of MPA Effects
What was surprising, however, was the mismatch between the physiology and biochemical data. The data showing use-dependence for MPA effects on field potential duration, the presence of synchronized activity and IPSP conductances were all consistent and highly reproducible. However, the LC/MS/MS data show that the IE GABA was comparably depressed in MPA and MPA + 5 mM K+. These data suggest several possibilities. First, the IE GABA that we are detecting using 13C glucose relies on TCA cycle generated intermediates. Thus, the depletion in IE that we are observing will not pick up GABA synthesized from unlabeled glutamine and our values may underestimate the true effect of MPA on vesicular GABA synthesis. Second, we cannot rule out plasticity in glutamine transport; it is established that there can be rapid translocation of glutamate transporters from the cytosol to the membrane under physiological conditions. Similar changes may occur for both the System A and N glutamine transporters under activated conditions, allowing for a dilution of isotopically labeled glutamine. Finally, there is recent evidence for a decrease in glutamate release during prolonged neural activation due to altered vesicle priming (Moulder et al., 2006, Moulder et al., 2006). Similar changes could occur in the presence of impaired GABA synthesis and thus slow the development of frank hyperexcitability. Additional studies will have to be done to fully dissect the role of physiologically relevant stimuli on GABA metabolism and the subsequent effects on neural excitability.
An important confound to acknowledge for these studies relates to the slice preparation itself. While physiological responses in slices are stable for hours, it has been established that slices lose glutamine disproportionately compared to other amino acids (Duarte et al., 2007, Kapetanovic et al., 1993). Indeed work in undercut neocortical slices showed that hyperexcitability could be induced in injured cortex by adding physiologic concentrations of glutamine (Tani et al., 2007). Thus, the loss of glutamine from the slices may also account for the reduced excitability in the presence of MPA in the slices relative to the in vivo situation whereby MPA produces robust seizures despite evidence for intact mitochondrial function as described above (Mares et al., 1993, Netopilova et al., 1995).
Contributions of Transported GABA to Excitability during GAD inhibition
The effects of MPA on synaptic excitability in CA1 were clearly use-dependent, however, we anticipated more evidence for network effects that resembled the spontaneous activity seen in bicuculline. We hypothesized that GABA transport could account for this discrepancy as GABA into neurons could be repackaged for release. While the bulk of GABA transport is mediated by astrocytes, there is a robust expression of GABA transporters on presynaptic terminals of GABAergic interneurons (e.g. (Sepkuty et al., 2002)) and thus recycled GABA could limit the effects of MPA. As shown in Table 1, the GAT-1 inhibitor NO-711 was associated with only modest effects in unstimulated conditions, indicating that baseline excitability was not significantly modified by GABA transport. However, following the stimulus trains that will actively deplete vesicular GABA stores, NO-711 had a highly significant effect on the response duration. However, this is a relatively modest effect compared to that seen by Liang et al (2006) using MeAIB to block glutamine entry into neurons. Taken together, these data suggest that neurons rely on both transported and synthesized GABA to maintain inhibitory tone at the CA3-CA1 synapse, but that transported GABA cannot substitute for synthesized transmitter in terms of controlling network excitability in a reduced preparation.
It is interesting to note that there are more significant effects of blocking glutamate transport on GABAergic inhibition than GABA transport. Sonnewald and McKenna (2003) showed that, in a synaptosomal preparation, there was a preferential conversion of glutamate derived via glutaminase into GABA over transported glutamate. Moreover, data from both Mathews and Diamond (2003) and Sepkuty et al, 2002 indicate that functional changes in inhibition occur when glutamate uptake is impaired, showing that a biologically relevant fraction of released GABA is synthesized from transported glutamate. Finally, the data from Liang et al, 2006 indicate that GABAergic function is highly dependent on transported glutamine, the substrate for glutaminase.
Synaptic vs. tonic inhibition
The NO-711 experiments provide one confound in that tonic inhibition is enhanced by GABA transport blockade (e.g. (Keros and Hablitz, 2005, Maguire et al., 2005, Nusser and Mody, 2002). By blocking transport, more GABA is available to bind extrasynaptic GABA receptors and thus provide a low level of baseline inhibition. This enhanced tonic inhibition throughout the hippocampal circuit could counteract some of the effects associated with reduced presynaptic GABA.
There is an increased awareness of the role of tonic inhibition in the regulation of network excitability and behavior (Chiu et al., 2005, Maguire et al., 2005). These studies have been primarily done primarily in the dentate gyrus because of the presence of the highly modulated delta subunit-containing GABA receptors. These effects include hormone actions, anxiety and alcohol sensitivity. However, there has been little work on the role of GABA availability on tonic inhibition.
There was no correlation between the time in MPA and the input resistance. This is distinct from the evoked IPSP conductance where there was a steady decrease in the amplitude of the evoked response over time, Figure 4B. We hypothesize that this distinction arises from the slower turnover of the cytosolic pool that may contribute to tonic inhibition, and/or the role of glial GABA release (Wu et al., 2003). These data provide further evidence for functionally distinct GABA pools (see above). Moreover, the change in input resistance following a train supports the hypothesis that MPA also inhibits the synthesis of the GABA involved in tonic inhibition in a use-dependent manner.
Conclusion
In summary, these data demonstrate that, in an isolated preparation, inhibition of GABA synthesis only affects synaptic excitability when the neuronal network is activated. Moreover, the data demonstrate that newly synthesized GABA is involved in synaptic inhibition and that total GABA levels do not predict inhibitory efficacy. Finally, these studies demonstrate the power of using joint physiologic and metabolic studies to understand the relationships between metabolism and excitability.
Acknowledgments
Supported by: NIH grants 045792 to AW, OAP and CG; 054038 to AW and OAP and a fellowship from the Turkish Research Council to ND. We would also like to thank Mr. Daniel Czyck and Ms Farah Refai for their work on sample preparation and to Dr. Youlan Lee for technical assistance.
Footnotes
Publisher's Disclaimer: This is a PDF file of an unedited manuscript that has been accepted for publication. As a service to our customers we are providing this early version of the manuscript. The manuscript will undergo copyediting, typesetting, and review of the resulting proof before it is published in its final citable form. Please note that during the production process errors may be discovered which could affect the content, and all legal disclaimers that apply to the journal pertain.
References
- Adcock T, Taberner PV. Measuring changes in cerebral glutamate and GABA metabolism prior to convulsions induced by 3-mercaptopropionate. Biochem Pharmacol. 1978;27:246–248. doi: 10.1016/0006-2952(78)90309-x. [DOI] [PubMed] [Google Scholar]
- Axmacher N, Stemmler M, Engel D, Draguhn A, Ritz R. Transmitter metabolism as a mechanism of synaptic plasticity: a modeling study. J Neurophysiol. 2004;91:25–39. doi: 10.1152/jn.00797.2003. [DOI] [PubMed] [Google Scholar]
- Bak LK, Schousboe A, Waagepetersen HS. The glutamate/GABA-glutamine cycle: aspects of transport, neurotransmitter homeostasis and ammonia transfer. J Neurochem. 2006;98:641–653. doi: 10.1111/j.1471-4159.2006.03913.x. [DOI] [PubMed] [Google Scholar]
- Battaglioli G, Liu H, Martin DL. Kinetic differences between the isoforms of glutamate decarboxylase: implications for the regulation of GABA synthesis. J Neurochem. 2003;86:879–887. doi: 10.1046/j.1471-4159.2003.01910.x. [DOI] [PubMed] [Google Scholar]
- Blindermann JM, Maitre M, Ossola L, Mandel P. Purification and some properties of L-glutamate decarboxylase from human brain. Eur J Biochem. 1978;86:143–152. doi: 10.1111/j.1432-1033.1978.tb12293.x. [DOI] [PubMed] [Google Scholar]
- Bolteus AJ, Garganta C, Bordey A. Assays for measuring extracellular GABA levels and cell migration rate in acute slices. Brain Res Brain Res Protoc. 2005;14:126–134. doi: 10.1016/j.brainresprot.2004.12.005. [DOI] [PubMed] [Google Scholar]
- Chagnac-Amitai Y, Connors BW. Horizontal spread of synchronized activity in neocortex and its control by GABA-mediated inhibition. J Neurophysiol. 1989;61:747–758. doi: 10.1152/jn.1989.61.4.747. [DOI] [PubMed] [Google Scholar]
- Chiu CS, Brickley S, Jensen K, Southwell A, McKinney S, Cull-Candy S, Mody I, Lester HA. GABA transporter deficiency causes tremor, ataxia, nervousness, and increased GABA-induced tonic conductance in cerebellum. J Neurosci. 2005;25:3234–3245. doi: 10.1523/JNEUROSCI.3364-04.2005. [DOI] [PMC free article] [PubMed] [Google Scholar]
- Chowdhury GM, Patel AB, Mason GF, Rothman DL, Behar KL. Glutamatergic and GABAergic neurotransmitter cycling and energy metabolism in rat cerebral cortex during postnatal development. J Cerebr Blood Flow Metab. 2007;27:1895–1907. doi: 10.1038/sj.jcbfm.9600490. [DOI] [PubMed] [Google Scholar]
- Crick EW, Osorio I, Bhavaraju NC, Linz TH, Lunte CE. An investigation into the pharmacokinetics of 3-mercaptopropionic acid and development of a steady-state chemical seizure model using in vivo microdialysis and electrophysiological monitoring. Epilepsy Res. 2007;74:116–125. doi: 10.1016/j.eplepsyres.2007.02.003. [DOI] [PMC free article] [PubMed] [Google Scholar]
- Diamond JS, Jahr CE. Transporters buffer synaptically released glutamate on a submillisecond time scale. J Neurosci. 1997;17:4672–4687. doi: 10.1523/JNEUROSCI.17-12-04672.1997. [DOI] [PMC free article] [PubMed] [Google Scholar]
- Duarte JM, Cunha RA, Carvalho RA. Different metabolism of glutamatergic and GABAergic compartments in superfused hippocampal slices characterized by nuclear magnetic resonance spectroscopy. Neuroscience. 2007;144:1305–1313. doi: 10.1016/j.neuroscience.2006.11.027. [DOI] [PubMed] [Google Scholar]
- Engel D, Pahner I, Schulze K, Frahm C, Jarry H, Ahnert-Hilger G, Draguhn A. Plasticity of rat central inhibitory synapses through GABA metabolism. J Physiol. 2001;535:473–482. doi: 10.1111/j.1469-7793.2001.00473.x. [DOI] [PMC free article] [PubMed] [Google Scholar]
- Esclapez M, Houser CR. Up-regulation of GAD65 and GAD67 in remaining hippocampal GABA neurons in a model of temporal lobe epilepsy. J Comp Neurol. 1999;412:488–505. [PubMed] [Google Scholar]
- Fan SG, Wusteman M, Iversen LL. 3-mercaptopropionic acid inhibits GABA release from rat brain slices in vitro. Brain Res. 1981;229:371–377. doi: 10.1016/0006-8993(81)91001-5. [DOI] [PubMed] [Google Scholar]
- Farrant M, Nusser Z. Variations on an inhibitory theme: phasic and tonic activation of GABA(A) receptors. Nat Rev Neurosci. 2005;6:215–229. doi: 10.1038/nrn1625. [DOI] [PubMed] [Google Scholar]
- Feldblum S, Ackermann RF, Tobin AJ. Long-term increase of glutamate decarboxylase mRNA in a rat model of temporal lobe epilepsy. Neuron. 1990;5:361–371. doi: 10.1016/0896-6273(90)90172-c. [DOI] [PubMed] [Google Scholar]
- French JA. Vigabatrin. Epilepsia. 1999;40 5:S11–16. doi: 10.1111/j.1528-1157.1999.tb00914.x. [DOI] [PubMed] [Google Scholar]
- Fricke MN, Jones-Davis DM, Mathews GC. Glutamine uptake by System A transporters maintains neurotransmitter GABA synthesis and inhibitory synaptic transmission. J Neurochem. 2007;102:1895–1904. doi: 10.1111/j.1471-4159.2007.04649.x. [DOI] [PubMed] [Google Scholar]
- Horton RW, Meldrum BS. Seizures induced by allylglycine, 3-mercaptopropionic acid and 4-deoxypyridoxine in mice and photosensitive baboons, and different modes of inhibition of cerebral glutamic acid decarboxylase. Br J Pharmacol. 1973;49:52–63. doi: 10.1111/j.1476-5381.1973.tb08267.x. [DOI] [PMC free article] [PubMed] [Google Scholar]
- Jin H, Wu H, Osterhaus G, Wei J, Davis K, Sha D, Floor E, Hsu CC, Kopke RD, Wu JY. Demonstration of functional coupling between gamma -aminobutyric acid (GABA) synthesis and vesicular GABA transport into synaptic vesicles. Proc Natl Acad Sci U S A. 2003;100:4293–4298. doi: 10.1073/pnas.0730698100. [DOI] [PMC free article] [PubMed] [Google Scholar]
- Kapetanovic IM, Yonekawa WD, Kupferberg HJ. Time-related loss of glutamine from hippocampal slices and concomitant changes in neurotransmitter amino acids. J Neurochem. 1993;61:865–872. doi: 10.1111/j.1471-4159.1993.tb03597.x. [DOI] [PubMed] [Google Scholar]
- Karlsson A, Fonnum F, Malthe-Sorenssen D, Storm-Mathisen J. Effect of the convulsive agent 3-mercaptopropionic acid on the levels of GABA, other amino acids and glutamate decarboxylase in different regions of the rat brain. Biochem Pharmacol. 1974;23:3053–3061. doi: 10.1016/0006-2952(74)90281-0. [DOI] [PubMed] [Google Scholar]
- Keros S, Hablitz JJ. Subtype-specific GABA transporter antagonists synergistically modulate phasic and tonic GABAA conductances in rat neocortex. J Neurophysiol. 2005;94:2073–2085. doi: 10.1152/jn.00520.2005. [DOI] [PubMed] [Google Scholar]
- Lamar C., Jr Mercaptopropionic acid: a convulsant that inhibits glutamate decarboxylase. J Neurochem. 1970;17:165–170. doi: 10.1111/j.1471-4159.1970.tb02197.x. [DOI] [PubMed] [Google Scholar]
- Liang SL, Carlson GC, Coulter DA. Dynamic regulation of synaptic GABA release by the glutamate-glutamine cycle in hippocampal area CA1. J Neurosci. 2006;26:8537–8548. doi: 10.1523/JNEUROSCI.0329-06.2006. [DOI] [PMC free article] [PubMed] [Google Scholar]
- Loscher W. gamma-Acetylenic GABA antagonizes the decrease in synaptosomal GABA concentrations but not the seizures induced by 3-mercaptopropionic acid in rats. Biochem Pharmacol. 1986;35:3176–3180. doi: 10.1016/0006-2952(86)90408-9. [DOI] [PubMed] [Google Scholar]
- Loscher W, Vetter M. In vivo effects of aminooxyacetic acid and valproic acid on nerve terminal (synaptosomal) GABA levels in discrete brain areas of the rat. Correlation to pharmacological activities. Biochem Pharmacol. 1985;34:1747–1756. doi: 10.1016/0006-2952(85)90645-8. [DOI] [PubMed] [Google Scholar]
- Maguire JL, Stell BM, Rafizadeh M, Mody I. Ovarian cycle-linked changes in GABA(A) receptors mediating tonic inhibition alter seizure susceptibility and anxiety. Nat Neurosci. 2005;8:797–804. doi: 10.1038/nn1469. [DOI] [PubMed] [Google Scholar]
- Mares P, Kubova H, Zouhar A, Folbergrova J, Koryntova H, Stankova L. Motor and electrocorticographic epileptic activity induced by 3-mercaptopropionic acid in immature rats. Epilepsy Res. 1993;16:11–18. doi: 10.1016/0920-1211(93)90034-5. [DOI] [PubMed] [Google Scholar]
- Martin DL, Tobin AJ. Mechanisms controlling GABA synthesis and degredation in the brain. In: Martin DL, Olsen R, editors. GABA in the Nervous System. Philadelphia: Liponcott, Williams & Wilkins; 2000. pp. 25–41. [Google Scholar]
- Mathews GC, Diamond JS. Neuronal glutamate uptake Contributes to GABA synthesis and inhibitory synaptic strength. J Neurosci. 2003;23:2040–2048. doi: 10.1523/JNEUROSCI.23-06-02040.2003. [DOI] [PMC free article] [PubMed] [Google Scholar]
- McBain CJ. Hippocampal inhibitory neuron activity in the elevated potassium model of epilepsy. J Neurophysiol. 1995;73:2853–2863. doi: 10.1152/jn.1995.73.2.2853. [DOI] [PubMed] [Google Scholar]
- Moulder KL, Jiang X, Taylor AA, Olney JW, Mennerick S. Physiological activity depresses synaptic function through an effect on vesicle priming. J Neurosci. 2006;26:6618–6626. doi: 10.1523/JNEUROSCI.5498-05.2006. [DOI] [PMC free article] [PubMed] [Google Scholar]
- Moulder KL, Meeks JP, Mennerick S. Homeostatic regulation of glutamate release in response to depolarization. Mol Neurobiol. 2006;33:133–153. doi: 10.1385/MN:33:2:133. [DOI] [PubMed] [Google Scholar]
- Netopilova M, Drsata J, Haugvicova R, Kubova H, Mares P. Inhibition of glutamate decarboxylase activity by 3-mercaptopropionic acid has different time course in the immature and adult rat brains. Neurosci Lett. 1997;226:68–70. doi: 10.1016/s0304-3940(97)00241-3. [DOI] [PubMed] [Google Scholar]
- Netopilova M, Drsata J, Kubova H, Mares P. Differences between immature and adult rats in brain glutamate decarboxylase inhibition by 3-mercaptopropionic acid. Epilepsy Res. 1995;20:179–184. doi: 10.1016/0920-1211(94)00068-8. [DOI] [PubMed] [Google Scholar]
- Nusser Z, Mody I. Selective modulation of tonic and phasic inhibitions in dentate gyrus granule cells. J Neurophysiol. 2002;87:2624–2628. doi: 10.1152/jn.2002.87.5.2624. [DOI] [PubMed] [Google Scholar]
- Patel AB, de Graaf RA, Martin DL, Battaglioli G, Behar KL. Evidence that GAD65 mediates increased GABA synthesis during intense neuronal activity in vivo. J Neurochem. 2006;97:385–396. doi: 10.1111/j.1471-4159.2006.03741.x. [DOI] [PubMed] [Google Scholar]
- Patrylo PR, Spencer DD, Williamson A. GABA uptake and heterotransport are impaired in the dentate gyrus of epileptic rats and humans with temporal lobe sclerosis. J Neurophysiol. 2001;85:1533–1542. doi: 10.1152/jn.2001.85.4.1533. [DOI] [PubMed] [Google Scholar]
- Petroff OAC. GABA and Glutamate in the Human Brain. Neuroscientist. 2002;8:562–573. doi: 10.1177/1073858402238515. [DOI] [PubMed] [Google Scholar]
- Petroff OA, Errante LD, Rothman DL, Kim JH, Spencer DD. Glutamate-glutamine cycling in the epileptic human hippocampus. Epilepsia. 2002;43:703–710. doi: 10.1046/j.1528-1157.2002.38901.x. [DOI] [PubMed] [Google Scholar]
- Petroff OA, Mattson RH, Rothman DL. Proton MRS: GABA and glutamate. Adv Neurol. 2000;83:261–271. [PubMed] [Google Scholar]
- Rae C, Hare N, Bubb WA, McEwan SR, Broer A, McQuillan JA, Balcar VJ, Conigrave AD, Broer S. Inhibition of glutamine transport depletes glutamate and GABA neurotransmitter pools: further evidence for metabolic compartmentation. J Neurochem. 2003;85:503–514. doi: 10.1046/j.1471-4159.2003.01713.x. [DOI] [PubMed] [Google Scholar]
- Rothman DL, Behar KL, Hetherington HP, den Hollander JA, Bendall MR, Petroff OA, Shulman RG. 1H-Observe/13C-decouple spectroscopic measurements of lactate and glutamate in the rat brain in vivo. Proc Natl Acad Sci U S A. 1985;82:1633–1637. doi: 10.1073/pnas.82.6.1633. [DOI] [PMC free article] [PubMed] [Google Scholar]
- Rutecki PA, Lebeda FJ, Johnston D. Epileptiform activity induced by changes in extracellular potassium in hippocampus. J Neurophysiol. 1985;54:1363–1374. doi: 10.1152/jn.1985.54.5.1363. [DOI] [PubMed] [Google Scholar]
- Sanchez-Vives MV, McCormick DA. Cellular and network mechanisms of rhythmic recurrent activity in neocortex. Nat Neurosci. 2000;3:1027–1034. doi: 10.1038/79848. [DOI] [PubMed] [Google Scholar]
- Sepkuty JP, Cohen AS, Eccles C, Rafiq A, Behar K, Ganel R, Coulter DA, Rothstein JD. A neuronal glutamate transporter contributes to neurotransmitter GABA synthesis and epilepsy. J Neurosci. 2002;22:6372–6379. doi: 10.1523/JNEUROSCI.22-15-06372.2002. [DOI] [PMC free article] [PubMed] [Google Scholar]
- Sibson NR, Mason GF, Shen J, Cline GW, Herskovits AZ, Wall JE, Behar KL, Rothman DL, Shulman RG. In vivo (13)C NMR measurement of neurotransmitter glutamate cycling, anaplerosis and TCA cycle flux in rat brain during 2-13C glucose infusion. J Neurochem. 2001;76:975–989. doi: 10.1046/j.1471-4159.2001.00074.x. [DOI] [PubMed] [Google Scholar]
- Sonnewald U, McKenna M. Metabolic compartmentation in cortical synaptosomes: influence of glucose and preferential incorporation of endogenous glutamate into GABA. Neurochem Res. 2002;27:43–50. doi: 10.1023/a:1014846404492. [DOI] [PubMed] [Google Scholar]
- Tagamets MA, Horwitz B. Interpreting PET and fMRI measures of functional neural activity: the effects of synaptic inhibition on cortical activation in human imaging studies. Brain Res Bull. 2001;54:267–273. doi: 10.1016/s0361-9230(00)00435-4. [DOI] [PubMed] [Google Scholar]
- Tani H, Bandrowski AE, Parada I, Wynn M, Huguenard JR, Prince DA, Reimer RJ. Modulation of epileptiform activity by glutamine and system A transport in a model of post-traumatic epilepsy. Neurobiol Dis. 2007;25:230–238. doi: 10.1016/j.nbd.2006.08.025. [DOI] [PMC free article] [PubMed] [Google Scholar]
- Ventura R, Harris KM. Three-dimensional relationships between hippocampal synapses and astrocytes. J Neurosci. 1999;19:6897–6906. doi: 10.1523/JNEUROSCI.19-16-06897.1999. [DOI] [PMC free article] [PubMed] [Google Scholar]
- Waagepetersen HS, Sonnewald U, Gegelashvili G, Larsson OM, Schousboe A. Metabolic distinction between vesicular and cytosolic GABA in cultured GABAergic neurons using 13C magnetic resonance spectroscopy. J Neurosci Res. 2001;63:347–355. doi: 10.1002/1097-4547(20010215)63:4<347::AID-JNR1029>3.0.CO;2-G. [DOI] [PubMed] [Google Scholar]
- Waagepetersen HS, Sonnewald U, Schousboe A. The GABA paradox: multiple roles as metabolite, neurotransmitter, and neurodifferentiative agent. J Neurochem. 1999;73:1335–1342. doi: 10.1046/j.1471-4159.1999.0731335.x. [DOI] [PubMed] [Google Scholar]
- Wu H, Jin Y, Buddhala C, Osterhaus G, Cohen E, Jin H, Wei J, Davis K, Obata K, Wu JY. Role of glutamate decarboxylase (GAD) isoform, GAD65, in GABA synthesis and transport into synaptic vesicles - Evidence from GAD65-knockout mice studies. Brain Res. 2007;1154:80–83. doi: 10.1016/j.brainres.2007.04.008. [DOI] [PubMed] [Google Scholar]
- Wu Y, Wang W, Richerson GB. GABA transaminase inhibition induces spontaneous and enhances depolarization-evoked GABA efflux via reversal of the GABA transporter. J Neurosci. 2001;21:2630–2639. doi: 10.1523/JNEUROSCI.21-08-02630.2001. [DOI] [PMC free article] [PubMed] [Google Scholar]
- Wu Y, Wang W, Richerson GB. Vigabatrin induces tonic inhibition via GABA transporter reversal without increasing vesicular GABA release. J Neurophysiol. 2003;89:2021–2034. doi: 10.1152/jn.00856.2002. [DOI] [PubMed] [Google Scholar]
- Wu Y, Wang W, Diez-Sampedro A, Richerson GB. Nonvesicular inhibitory neurotransmission via reversal of the GABA transporter GAT-1. Neuron. 2007;56:851–865. doi: 10.1016/j.neuron.2007.10.021. [DOI] [PMC free article] [PubMed] [Google Scholar]