The visualization of biomolecules as they function in living systems is important for understanding complex biological processes. Genetically encoded fluorescent tags are widely used for visualizing proteins; however, these labels are large and can cause structural perturbations to the target.1 In addition, they are not widely applicable to other classes of biomolecules such as glycans, lipids, nucleic acids, and secondary metabolites. An alternative strategy has emerged that can label all classes of biomolecules and circumvents the problem of size. This approach involves the incorporation of a small functional group—the bioorthogonal chemical reporter—into a target molecule using the cell's own biosynthetic machinery.2 The chemical reporter is inert to the biological environment, but it can be detected with exogenously delivered probes via highly selective covalent reactions. Here, we applied the bioorthogonal chemical reporter technique to image cell surface glycans using multiple metabolic labels. We introduced two different chemical reporters into sialic acid and N-acetylgalactosamine (GalNAc) residues and then simultaneously imaged their associated cell-surface glycans with fluorescent probes.
The two chemical reporters used in this study are the ketone and the azide.2 Ketones undergo selective reactions with hydrazide and aminooxy derivatives. Although the pH optimum for these reactions is 5−6, which cannot be achieved in vivo, ketones have been employed for labeling biomolecules in cell-based systems.2-3 The azide has been used to label many biomolecules, including proteins, lipids, and glycans, in both cells and living animals.2 Azides can be covalently tagged by Staudinger ligation with triaryl phosphines4 or by [3+2] azide-alkyne cycloaddition.5 In principle, these reactions of ketones and azides can be performed in one pot to visualize two distinct metabolic labels, as shown schematically in Figure 1.
Figure 1.
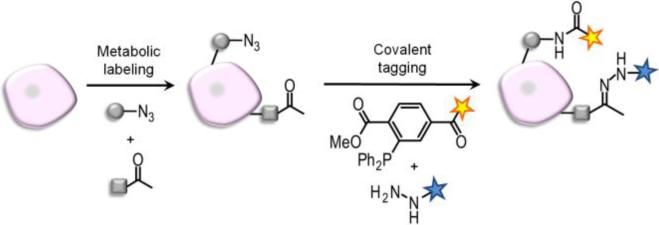
Strategy for dual imaging of azide- and ketone-labeled cell surface biomolecules.
Our first goal was to develop reagents for direct visualization of azides. Coumarin- and fluorescein-phosphine conjugates have been employed for biochemical detection of azide-labeled proteins6 and nucleotides.7 Although these reagents could potentially be adapted for cell imaging, near-infrared probes have emerged as the preferred choice for cellular and whole-animal imaging.8 Thus, we prepared the Cy5.5-phosphine conjugate 1 (Figure 2), which absorbs and emits near-infrared light. For comparative purposes, we also synthesized the fluorescein- and rhodamine-phosphine conjugates 29 and 310. The photophysical parameters of the probes were similar to those of their parent fluorophores (Figure 2).
Figure 2.
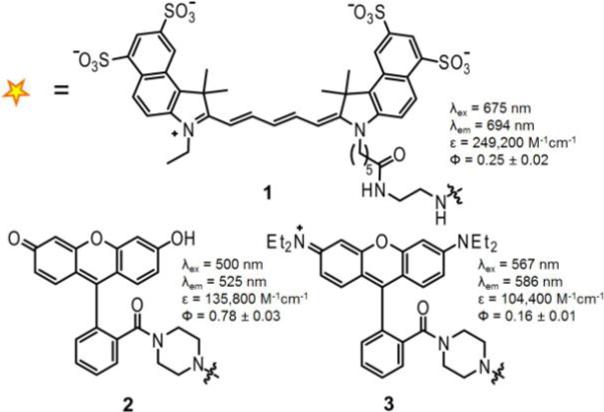
Panel of phosphine probes (1−3).
To confirm the reactivity of these phosphines with azide-labeled biomolecules, we incubated 1-3 with recombinant murine dihydrofolate reductase (mDHFR) bearing azidohomoalanine in place of native methionine.4a Analysis by gel electrophoresis and in-gel fluorescence imaging showed selective labeling of the azidoprotein and no detectable labeling of the native protein (Figure 3A-C).
Figure 3.
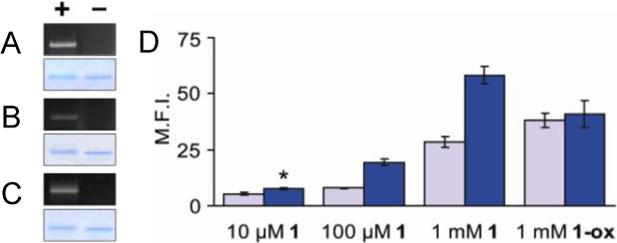
(A–C) Specific labeling of azido-mDHFR with 1−3. Purified azido-mDHFR (+) and native mDHFR (−) were incubated overnight with 1−3 (10 μM), and the samples were analyzed by SDS-PAGE. The extent of Staudinger ligation was determined by fluorescence (top) and total protein content was determined by staining with Coomassie Blue (bottom). (A) 1. (B) 2. (C) 3. (D) Flow cytometry analysis of Jurkat cells labeled with 1 or the phosphine oxide of 1 (1-ox). The cells were first incubated for 3 d in the presence (blue bars) or absence (gray bars) of Ac4ManNAz (25 μM) and then incubated with 1 or 1-ox for 1 h at rt at various concentrations. M.F.I. = mean fluorescence intensity (arbitrary units). Error bars represent standard deviation of the mean for three replicate experiments. *P < 0.004 (t-test, two-tailed distribution).
We next evaluated the three fluorescent phosphines in cell imaging experiments. Azides were introduced into Jurkat cell surface glycans by metabolic labeling of their sialic acids using the precursor peracetylated N-azidoacetylmannosamine (Ac4ManNAz).4b The cells bearing azido sialic acids (SiaNAz) were then reacted with various concentrations of 1-3 (10 μM – 1 mM) and their fluorescence was quantified by flow cytometry. Compounds 2 and 3 showed high background labeling at all concentrations tested, which obscured any potential azide-specific labeling (Figure S1-S2). Although reducing the dye concentration could diminish background labeling, the corresponding decrease in Staudinger ligation rate would also diminish azide detection sensitivity.
Compound 1, however, was superior with respect to background labeling. Even at 10 μM, 1 showed detectable fluorescent labeling of SiaNAz-labeled Jurkat cells compared to control cells lacking azides (Figure 3D). Background labeling remained low at 100 μM 1 and only became significant at concentrations approaching 1 mM. We attribute the lower background labeling observed with 1 to its higher charge density, and therefore greater solubility, which allows for efficient removal of excess probe during the washes. As a control, we synthesized an oxidized form of 1 in which the phosphine was converted to an unreactive phosphine oxide (1-ox). Incubation of SiaNAz-labeled Jurkat cells with 1-ox revealed labeling that was identical to that of cells lacking azides.
Having validated 1 in flow cytometry experiments, we next employed the compound for cell imaging. Chinese hamster ovary (CHO) cells were grown in the presence or absence of Ac4ManNAz and then reacted with 1 for 2 h at 37 °C. The cells were fixed and permeabilized and then washed to remove any excess unreacted probe. CHO cells expressing azides showed labeling of the cell surface with 1 (Figure 4A). Colocalization studies suggest that the intracellular punctate staining is due to glycoprotein recycling to the Golgi complex during incubation with 1 (Figure S3).11 By contrast, the cells with no azides displayed no significant fluorescence (Figure 4B).
Figure 4.
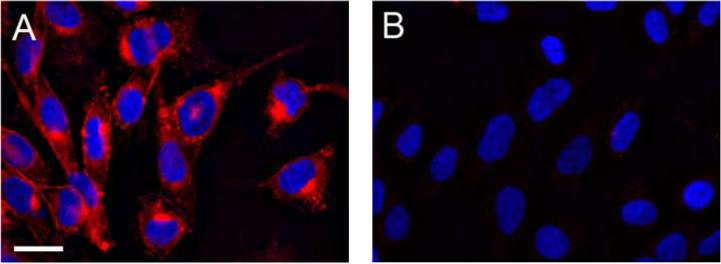
Fluorescence microscopy of CHO cells labeled with 1. Cells incubated for 3 d in the presence (A) or absence (B) of Ac4ManNAz (100 μM) were treated with 1 (200 μM) for 2 h at 37 °C. The cells were then fixed and permeabilized with MeOH and stained with DAPI before imaging. Red = Cy5.5 channel. Blue = DAPI channel. Scale bar = 20 μm.
The ability to detect multiple chemical reporters would allow for simultaneous monitoring of different glycan subtypes. We explored this possibility by imaging two different sugars on the same cells–sialic acids, which are common terminal components of glycans, and GalNAc residues, which are found in all mucin-type O-linked glycans. Ketone groups were introduced into sialic acids using peracetylated N-levulinoylmannosamine (Ac4ManLev) as a metabolic precursor,3c and azides were introduced into GalNAc residues using the salvage pathway substrate peracetylated N-azidoacetylgalactosamine (Ac4GalNAz).12 Jurkat cells were fed the metabolic labels either singly or in combination and then reacted with both 1 and biotin hydrazide in one pot, followed by staining with FITC-avidin. As shown in Figure 5, cells that were grown in the presence of Ac4ManLev only (Figure 5D) and Ac4GalNAz only (Figure 5A) exhibited an increase in signal over background (Figure 5C). Jurkat cells incubated with both metabolic labels showed dual labeling with both dyes (Figure 5B). As expected, cells that were incubated with both sugars and reacted with 1-ox and FITC-avidin showed no fluorescence above background (Figure S4). Thus, sialic acid and GalNAc residues can be simultaneously visualized on the same cells.
Figure 5.
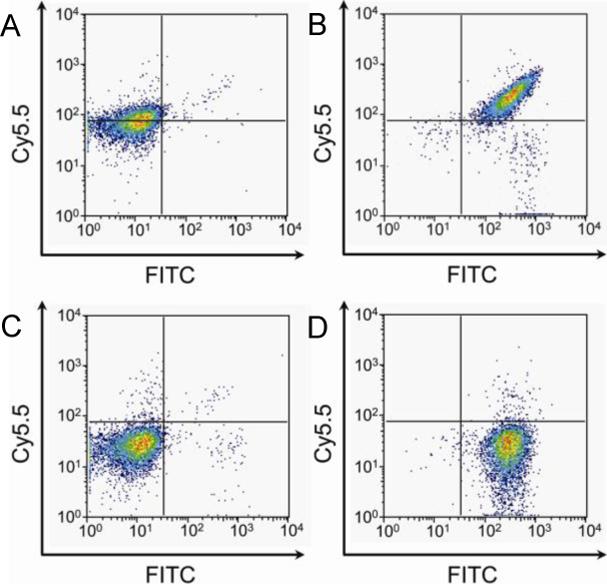
Labeling of live cells bearing two bioorthogonal chemical reporters. Jurkat cells were incubated with combinations of Ac4ManLev (50 μM), Ac4GalNAz (150 μM), and no sugar for 2 d, followed by labeling with both 1 and biotin hydrazide at pH 6.5 and, subsequently, with FITC-avidin. The fluorescence of each sample was measured by flow cytometry. x-axis: FITC fluorescence; y-axis: Cy5.5 fluorescence. (A) – Ac4ManLev, + Ac4GalNAz. (B) + Ac4ManLev, + Ac4GalNAz. (C) – Ac4ManLev, – Ac4GalNAz. (D) + Ac4ManLev, – Ac4GalNAz.
In summary, glycan imaging can be achieved using the bioorthogonal chemical reporter technique. This capability should enable monitoring of glycan expression and dynamics, processes that were previously inaccessible in an imaging context.
Supplementary Material
Acknowledgement
This work was supported by NIH Grant GM058867. We thank S. Laughlin and Dr. H. van Halbeek for assistance, T. Nguyen and A. Lo for materials, and J. Czlapinski for helpful discussions. P.V.C., J.A.P., and M.J.H. were supported by National Science Foundation, Howard Hughes Medical Institute, and National Defense Science and Engineering Graduate predoctoral fellowships, respectively.
Footnotes
Supporting Information Available: Procedures for the synthesis of 1-3, cell imaging and photophysical measurements, and additional data (PDF). This material is available free of charge via the Internet at http://pubs.acs.org.
References
- 1.Zhang J, Campbell RE, Ting AY, Tsien RY. Nat. Rev. Mol. Cell. Biol. 2002;3:906–918. doi: 10.1038/nrm976. [DOI] [PubMed] [Google Scholar]
- 2.Prescher JA, Bertozzi CR. Nature Chem. Biol. 2005;1:13–21. doi: 10.1038/nchembio0605-13. [DOI] [PubMed] [Google Scholar]
- 3.a Zhang Z, Smith BAC, Wang L, Brock A, Cho C, Schultz P. Biochemistry. 2003;42:6735–6746. doi: 10.1021/bi0300231. [DOI] [PubMed] [Google Scholar]; b Chen I, Howarth M, Lin W, Ting AY. Nat. Methods. 2005;2:99–104. doi: 10.1038/nmeth735. [DOI] [PubMed] [Google Scholar]; c Mahal LK, Yarema KJ, Bertozzi CR. Science. 1997;276:1125–1128. doi: 10.1126/science.276.5315.1125. [DOI] [PubMed] [Google Scholar]
- 4.a Kiick KL, Saxon E, Tirrell DA, Bertozzi CR. Proc. Natl. Acad. Sci. U.S.A. 2002;99:19–24. doi: 10.1073/pnas.012583299. [DOI] [PMC free article] [PubMed] [Google Scholar]; b Saxon E, Bertozzi CR. Science. 2000;287:2007–2010. doi: 10.1126/science.287.5460.2007. [DOI] [PubMed] [Google Scholar]
- 5.a Rostovtsev VV, Green LG, Fokin VV, Sharpless KB. Angew. Chem. Int. Ed. Engl. 2002;41:2596–2599. doi: 10.1002/1521-3773(20020715)41:14<2596::AID-ANIE2596>3.0.CO;2-4. [DOI] [PubMed] [Google Scholar]; b Agard NJ, Prescher JA, Bertozzi CR. J. Am. Chem. Soc. 2004;126:15046–15047. doi: 10.1021/ja044996f. [DOI] [PubMed] [Google Scholar]
- 6.a Tsao ML, Tian F, Schultz PG. ChemBioChem. 2005;6:2147–2149. doi: 10.1002/cbic.200500314. [DOI] [PubMed] [Google Scholar]; b Lemieux GA, de Graffenried CL, Bertozzi CR. J. Am. Chem. Soc. 2003;125:4708–4709. doi: 10.1021/ja029013y. [DOI] [PubMed] [Google Scholar]
- 7.Wang CC, Seo TS, Li Z, Ruparel H, Ju J. Bioconjugate Chem. 2003;14:697–701. doi: 10.1021/bc0256392. [DOI] [PubMed] [Google Scholar]
- 8.Massoud TF, Gambhir SS. Genes Dev. 2003;17:545–580. doi: 10.1101/gad.1047403. [DOI] [PubMed] [Google Scholar]
- 9.Slais K, Horka M, Novackova J, Friedl Z. Electrophoresis. 2002;23:1682–1688. doi: 10.1002/1522-2683(200206)23:11<1682::AID-ELPS1682>3.0.CO;2-Q. The fluorescein-piperazine core was synthesized with modifications to procedures previously described. [DOI] [PubMed] [Google Scholar]
- 10.Nguyen T, Francis MB. Org. Lett. 2003;5:3245–3248. doi: 10.1021/ol035135z. The rhodamine-piperazine core was synthesized according to procedures previously described. [DOI] [PubMed] [Google Scholar]
- 11.Huang KM, Snider MD. J. Biol. Chem. 1993;268:9302–9310. [PubMed] [Google Scholar]
- 12.Hang HC, Yu C, Kato DL, Bertozzi CR. Proc. Natl. Acad. Sci. U.S.A. 2003;100:14846–14851. doi: 10.1073/pnas.2335201100. [DOI] [PMC free article] [PubMed] [Google Scholar]
Associated Data
This section collects any data citations, data availability statements, or supplementary materials included in this article.


