

Abstract
Humans normally listen in mixed environments, in which sounds originating from more than one source overlap in time and in frequency. The auditory system is able to extract information specific to the individual sources that contribute to the composite signal and process the information for each source separately; this is called “auditory scene analysis” or “sound-source determination.” Sounds that are simultaneously present but generated independently tend to differ along relatively simple acoustic dimensions. These dimensions may be temporal, as when sounds begin or end asynchronously, or spectral, as when the sounds have different fundamental frequencies. Psychophysical experiments have identified some of the ways in which human listeners use these dimensions to isolate sources of sound. A simple but useful stimulus, a harmonic complex tone with or without a mistuned component, can be used for parametric investigation of the processing of spectral structure. This “mistuned tone” stimulus has been used in several psychophysical experiments, and more recently in studies that specifically address the neural mechanisms that underlie segregation based on harmonicity. Studies of the responses of single neurons in the chinchilla auditory system to mistuned tones are reviewed here in detail. The results of those experiments support the view that neurons in the inferior colliculus (IC) exhibit responses to mistuned tones that are larger and temporally more complex than the same neurons’ responses to harmonic tones. Mistuning does not produce comparable changes in the discharge patterns of auditory nerve (AN) fibers, indicating that a major transformation in the neural representation of harmonic structure occurs in the auditory brainstem. The brainstem processing that accomplishes this transformation may contribute to the segregation of competing sounds and ultimately to the identification of sound sources.
I. Introduction
We usually listen to sound in situations in which multiple sound-generating objects are present. For example, a person may be talking in the presence of other talkers or music, or two persons may be holding a conversation in the presence of unrelated environmental sounds. In these situations, the signals generated by multiple simultaneous sound sources add linearly and arrive at each of the listener’s ears as a single waveform whose spectrum includes all the components associated with all the sources. The signal that arises from the addition of multiple sounds will be referred to here as a “composite” signal. In the composite signal, the waveforms produced by the individual sources often overlap in time and in frequency. However, in what is a remarkable feat of signal processing, we tend to perceive the individual sound-generating objects accurately. We do not hear a single sound that has the characteristics of the entire mixture, or sounds that have the characteristics of inappropriate subsets of the mixture.
Different terminology has been used to describe the process of sorting out the spectrum and identifying the individual sound-generating objects that contribute to the composite signal. Bregman (1990) referred to the process as auditory scene analysis, a term that is widely used. The outcome of the process was called the perception of auditory entities by Hartmann (1988), auditory object perception by Handel (1995), and auditory image perception by Yost (1991). Yost later suggested the term sound-source determination (Yost, 1993; Yost and Sheft, 1993); this phrase will be used in this chapter. Setting aside differences in terminology, these authors agree that sound source determination is an essential function of the auditory system.
Although the psychophysical and perceptual literature emphasizes sound-source determination by humans, it is highly likely that individuals of any species that use hearing must have the ability to determine what sound sources exist in a composite signal. Without that ability, it would be difficult or impossible to identify the spectral profile (i.e., the pattern of amplitude as a function of frequency). The spectral profile, in turn, provides information about who or what made the sound: predator, prey, a conspecific, or something that may safely be ignored. The adaptive value of distinguishing enemies from friends even when listening conditions are less than perfect is obvious. The spectral profile also conveys meaning beyond simply identifying the source of the sound. For example, human speech would be less understandable if its spectral profile as represented by the auditory system were not stable in the presence of competing sounds.
Excellent reviews of perceptual and psychophysical phenomena relevant for sound source determination are already available (Bregman, 1990; Darwin and Carlyon, 1995; Hartmann, 1988; Yost, 1991, 1993; Yost and Sheft, 1993). This chapter will extend the scope of those reviews by emphasizing neural processing that may be relevant for understanding sound-source determination. The focus will be on microelectrode studies of the representation of complex tones conducted in the author’s laboratory. Neural mechanisms that underlie sound-source determination are only beginning to be understood, but it is likely that activity in this area of research will increase.
II. Processes That Underlie Sound-Source Determination
Sound-source determination surely involves more than one auditory mechanism. Bregman (1990) made a distinction between innate mechanisms, which he called “primitive scene analysis,” and those that are influenced by factors such as learning or attention, which he called “schema-based scene analysis.” In addition to being innate, primitive scene analysis includes processes that are tightly linked to properties of the acoustic signal. In contrast, schema-based scene analysis incorporates cognitive factors, such as the use of stored knowledge and hypothesis testing. The focus of this chapter will be on primitive mechanisms that can be investigated in non-human animal models. Since the general plan of the auditory pathway is relatively similar across species, especially across mammals, it can be argued that the neural circuitry and processing algorithms that underlie primitive auditory scene analysis are also highly conserved, making it likely that mechanisms identified in non-human animals can be generalized to humans. This is not always the case in observations of the neural processing of complex sounds. The processing of animal vocalizations, for example, may involve species-specific mechanisms even at relatively early stages of the auditory pathway (Portfors and Sinex, 2005).
As the first step toward the determination of sound sources, the parts of the composite signal originating from the individual sound generators must be isolated and extracted; this step is called “spectral segregation” or simply segregation. The spectral components that are segregated are often non-contiguous in the spectrum of the composite signal. This can be illustrated with examples from vowel perception. A typical voiced vowel is spoken with periodic vocal fold activity, and its spectrum will consist of components at integer multiples of the fundamental frequency (f0) of voicing, whose amplitudes are shaped by the resonances of the talker’s vocal tract—the spectral profile described in the previous text. In the case of two simultaneous vowels produced with slightly different f0, harmonics of one f0 will be interspersed with harmonics of the other f0. However, listeners are able to identify simultaneous vowels at levels well above chance (Assmann and Summerfield, 1989, 1990; Chalikia and Bregman, 1989, 1993; Culling and Darwin, 1994; de Cheveigné et al., 1997). To identify any single vowel presented in isolation, the listener makes use of the vowel’s spectral profile. A listener who can successfully identify two vowels presented simultaneously must have had access to information about the spectral profiles of each vowel separately. It follows that the listener must have been able to identify and associate the non-adjacent spectral components that belong to each vowel.
Segregation will usually be followed by “grouping,” a separate step in which the signal components originating from each sound source are combined, or fused, to produce a unitary percept. In the previous example of two simultaneous vowels, the identity of an individual vowel would not actually have been determined until the appropriately segregated components had been grouped. Grouping, although obviously important, is less easily studied in neurophysiological experiments than primitive segregation, and so little more will be said about it in this chapter.
A. Physical Cues That Promote Segregation
When two sounds are generated independently in real-world situations, they are likely to exhibit differences along relatively simple acoustic dimensions such as duration or periodicity that can be exploited for segregation and eventual sound-source determination. Table I lists six acoustic variables that could be used to segregate sound sources, as summarized by Yost and Sheft (1993). Some of these variables are temporal; for example, independently generated sounds usually do not begin and end simultaneously. A difference of as little as 30 msec in the relative onset times of two sounds promotes segregation, even when listeners are unaware of the onset disparity itself (Rasch, 1978). Ongoing amplitude modulation, another temporal cue, also contributes to segregation and grouping. Incoherently modulated components tend to be perceived as arising from separate sources. For example, it is difficult or impossible to hear the individual components in a harmonic signal, such as a vowel or complex tone. However, if amplitude modulation is applied to a single component in a harmonic complex tone, the modulated component can more easily be heard as separate from the remaining, unmodulated components (Duifhuis, 1970). Coherent modulation applied to more than one component in a complex sound promotes fusion or grouping of those components (Cohen, 1980; Hall and Grose, 1990; Hall et al., 1984). The intelligibility of sounds with components that are not easily grouped, such as sinewave speech, is increased by coherent modulation of the sinewave components (Carrell and Opie, 1992).
TABLE I.
Summary of Six Acoustic Dimensions Described by Yost and Sheft (1993) that may be used for Segregation and Grouping. Both Spectral and Temporal Cues are Available
| Physical variable | Type of cue | |
|---|---|---|
| 1 | Harmonicity | Spectral |
| 2 | Spectral separation | Spectral |
| 3 | Spectral profile | Spectral |
| 4 | Amplitude modulation | Temporal |
| 5 | Temporal separation | Temporal |
| 6 | Spatial separation | Spectral and temporal |
Spatial separation also facilitates segregation. Cherry (1953) found that competing sounds presented to the same ear as the target sound produced more interference than competing sounds presented to the other ear. Cherry’s paper introduced the phrase “cocktail party effect” as a general term to describe the ability to process one voice in the presence of others. Because the cocktail party effect is well known, the significance of binaural cues for sound-source determination may be occasionally overstated. Spatial separation improves the recognition of sounds in noise, in part because the listener’s head can be oriented to improve the ratio of the signal intensity to the noise intensity (Plomp and Mimpen, 1981). However, individual sources can be segregated from composite sounds that lack any interaural cues for location; for example, different musical instruments or voices can be identified in monophonic recordings or radio broadcasts. Listeners presented with simultaneous vowels can identify one or both vowels when they are presented to the same ear (Assmann and Summerfield, 1989, 1990) or diotically (Chalikia and Bregman, 1989; de Cheveigné, 1999).
Harmonic structure provides important spectral cues that can be used for segregation. The spectra of sounds produced by periodic vibration consist of equally spaced lines falling at integer multiples of the f0 of the vibration. These sounds are said to be harmonic, or to exhibit harmonicity (Kidd et al., 2003). Many natural sounds are periodic, or nearly so, and when heard in isolation, they have a low pitch that is determined by f0. Listeners typically are not able to hear the individual components in a harmonic complex tone; the harmonics are fused or grouped to produce a single integrated percept. Two objects that independently generate periodic signals typically do not vibrate with exactly the same f0, and the resulting sounds will have different pitches. Simultaneous periodic sounds that differ in f0, that is, that differ in harmonicity, are more easily segregated than sounds that have the same f0. The introduction of small differences in f0, on the order of 1% to 3%, leads to rapid improvement in identification accuracy, and f0 differences greater than 1 semitone usually produce only modest additional improvement (Assmann and Summerfield, 1989, 1990; Chalikia and Bregman, 1989, 1993; Culling and Darwin, 1994; de Cheveigné et al., 1997, 1999). Ongoing speech is more intelligible in the presence of a competing voice if the pitch of the second voice is different (Brokx and Nooteboom, 1982). Listeners can also use small differences in f0 to segregate pairs of non-speech harmonic complex tones presented simultaneously (Chalikia and Bregman, 1989; Carlyon and Shackleton, 1994).
The segregation of simultaneous harmonic sounds is usually thought to require the estimation of f0 for one or both sounds. Models of segregation usually make explicit use of an estimate of f0 (Meddis and Hewitt, 1992); if f0 is known, it can be used to enhance one harmonic sound or cancel the other, thereby improving recognition (de Cheveigné, 1993). One hypothetical mechanism that could enhance the representation of one harmonic sound within a composite sound is a “harmonic sieve” (Duifhuis et al., 1982; Goldstein, 1973). The harmonic sieve, usually invoked in the context of pitch perception, identifies spectral components that fall at integer multiples of a fundamental frequency, within a tolerance usually estimated to be about ±3%. The components passed by the sieve would normally belong to a single source and should be grouped, while those falling outside the sieve presumably arise from another sound generator and should be processed separately (Lin and Hartmann, 1998; Moore et al., 1986). However, not all observations of the processing of simultaneous vowels with differences in f0 are consistent with the expectations of a harmonic sieve. For example, Culling and Darwin (1994) presented listeners with “interleaved vowels,” in which the spectral profile of each individual vowel was defined by some harmonics of one f0 and some harmonics of the other f0. The interleaved vowels were presented in pairs, such that the total number and frequencies of harmonics in a pair was the same as in a control condition consisting of two simultaneous unmodified vowels. With these stimuli, a harmonic sieve would identify an unrelated set of spectral components, from which the intended vowel could not be identified. In fact, for small f0 separations, listeners were able to identify interleaved vowels as accurately as they identified the unmodified vowels. A computational model that used the pattern of beats produced by unresolved stimulus components as the basis for identification successfully predicted the listeners’ performance for interleaved vowels, and for normal vowels at small f0 separations. However, the model underestimated listeners’ performance at f0 separations of 1 semitone or more for the unmodified vowels, suggesting that a process more like a harmonic sieve may be usable for larger differences in f0.
B. The Perception and Processing of Mistuned Harmonics
Segregation based on harmonicity can be studied with a relatively simple stimulus, a “mistuned tone” (Grube et al., 2003; Hartmann, 1988, 2004; Hartmann et al., 1990; Moore et al., 1985, 1986; Roberts and Brunstrom, 1998). A mistuned tone is a harmonic complex tone in which the frequency of one component has been shifted so that it no longer falls at an integer multiple of f0. As noted in the previous section, the individual spectral components in a strictly harmonic tone are not perceived separately. However, under certain conditions, the mistuned component will be heard as a separate tone with its own pitch and timbre, against the background of the original tone, which has a lower pitch (Moore et al., 1986). When that happens, the auditory system can be said to have segregated the mistuned component from the harmonic tone. Presumably, this is accomplished by the same mechanisms that are engaged by naturally occurring composite sounds. Parameters of the mistuned tone can be varied systematically, to determine the conditions under which segregation does or does not occur. Results summarized in Fig. 1A indicate that mistuning one harmonic by 1% to 2% is sufficient to produce the percept of a second tone (Hartmann, 2004; Moore et al., 1986). Hartmann et al. (1990) reported that when one component of a harmonic tone was mistuned by 4%, subjects could consistently and accurately adjust a pure tone to match the pitch of the mistuned harmonic. The pattern of matches provided convincing evidence that the listeners based their responses on a perceived second sound, rather than some change in the overall quality of the complex tone. The threshold at which the mistuned harmonic emerges as a separate sound is relatively independent of the absolute frequency of the original harmonic component, for frequencies up to about 2 kHz (Hartmann et al., 1990). It is also relatively independent of f0, over the range from 0.1 to 0.4 kHz (Moore et al., 1986). The threshold is relatively independent of harmonic number, at least for harmonics above the second (Hartmann et al., 1990; Moore et al., 1986). It varies non-monotonically with the stimulus level, and is lowest over a range of levels between about 10 to 50 dB SPL per component (Hartmann, 2004).
Fig. 1.
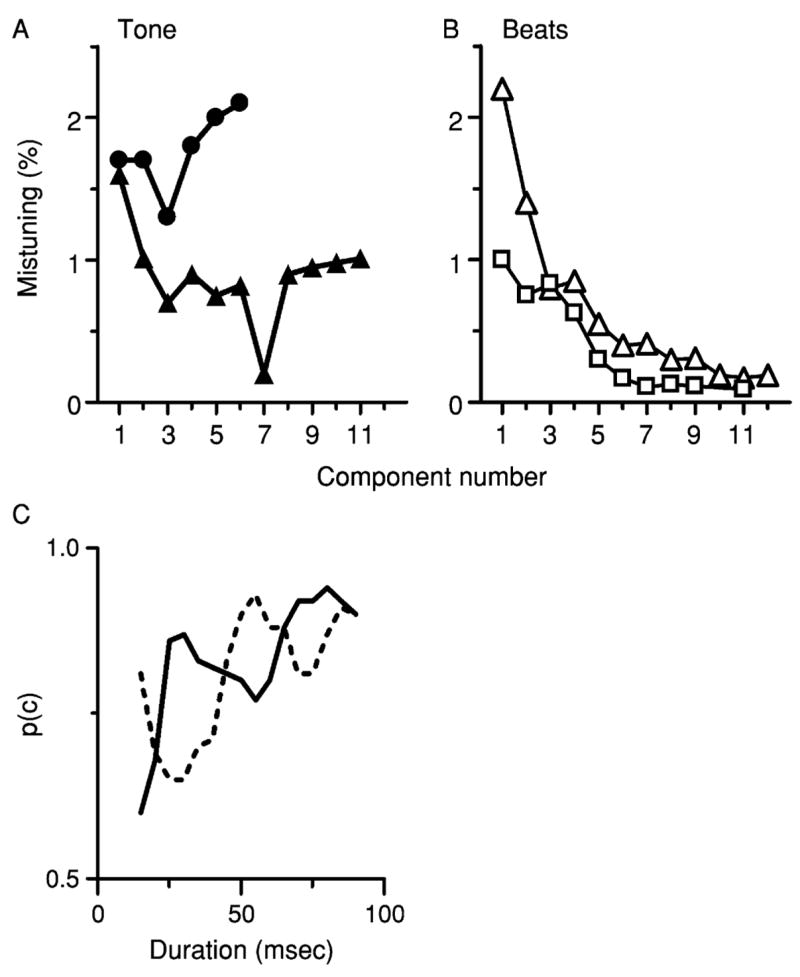
Psychophysics of mistuning. In each study summarized here, f0 for the harmonic tone was 0.2 kHz. (A) Thresholds at which a mistuned component is first heard as a separate tone. Circles = Data from Moore et al. (1986), Table I. Triangles = data from Hartmann et al. (1990), Fig. 5. Thresholds judged by Hartmann et al., to be based on the detection of roughness or beats were omitted. (B) Thresholds at which mistuning first produces any audible change. Triangles = data from Moore et al. (1985), Fig. 1, duration = 410 msec. Squares = data from Lee and Green (1994), “simultaneous-monotic” condition. (C) Effect of tone duration and phase on the detectability of a mistuned component. Data were redrawn from Hartmann (1988), Fig. 3. Solid line = all stimulus components added in sine phase. Dashed line = phase of the mistuned component was shifted by 180°.
The interpretation of experiments involving mistuned tones is complicated by the fact that it is possible to detect mistuning as a change in timbre, even if a second sound source is not perceived (Lee and Green, 1994; Moore et al., 1985). When listeners are allowed to report the detection of any change in the complex tone, their thresholds may be much smaller than 1% or 2% (Fig. 1B). Also, rather than being independent of frequency, thresholds for the detection of mistuning (expressed in percent) decrease with frequency, to values that can be an order of magnitude lower than the threshold at which a second tone was first heard (Grube et al., 2003; Lee and Green, 1994; Moore et al., 1985). Thresholds for detecting mistuning decrease as stimulus duration increases (Moore et al., 1985), but thresholds for perceiving a second sound source are less strongly dependent on duration (Moore et al., 1986). Moore et al. (1985, 1986) suggested that very low thresholds for detection may occur when listeners can hear beats or roughness produced by adjacent unresolved components of the complex sound. They suggested that a mistuned component will emerge as a second tone only if it is resolved by auditory filtering and if the mistuning exceeds the width of the slots in a hypothetical harmonic sieve. The dependence of detection thresholds on frequency and duration is consistent with that interpretation. As the frequency of the mistuned component increases, a smaller fractional change is required to produce a constant beat frequency. The decrease in threshold with duration can be accounted for because, other factors being equal, a longer stimulus includes more cycles of a low-frequency beat, providing the listener with more opportunities to detect the beat.
Hartmann (1988) reported the results of a preliminary experiment showing that the detectability of a mistuned component was affected by a phase shift applied to the mistuned component (but not to other components). Phase interacted with duration. For tones with durations between approximately 20 to 40 or 65 to 85 msec, the mistuned component was easier to detect if it was in-phase with the remaining harmonics, but for tones 40 to 65 msec long, the mistuned component was easier to detect if it was 180° out-of-phase with the other components (Fig. 1C). If the mistuned component were resolved, its phase relative to the adjacent components should have been irrelevant, so the result strongly suggests that the mistuned component was not resolved. Hartmann (2004) has also found that the detectability of mistuning is degraded if the tuned harmonics immediately adjacent to the mistuned component are deleted from the stimulus. Deleting components increases the frequency distance between the mistuned component and the adjacent components, which should make the mistuned component more resolvable. The design of these two experiments did not require listeners to indicate that they perceived the mistuned component as a second tone. However, the same 2.5% change in the fourth harmonic of 0.2 kHz exceeded the threshold for hearing a second tone in other experiments in which listeners were explicitly required to report what they heard (Hartman et al., 1990; Moore et al., 1986; Roberts and Brunstrom, 1998; also see Fig. 1A). These results are difficult to explain if the mistuned component must be resolved in order to be heard as a separate tone. Hartmann (2004) concluded that the findings were best accounted for by assuming that mistuning produces a tonotopically local perturbation of a neural response synchronized to f0, caused by interactions between adjacent unresolved components.
Up to this point, mistuning has been defined as a change in the frequency of one component in an otherwise harmonic tone. A slightly different experiment was conducted by Roberts and Brunstrom (1998), who measured listeners’ abilities to segregate components from inharmonic tones. In one condition they presented “frequency-shifted” tones, in which the spacing between components was a constant 0.2 kHz although the components were not multiples of 0.2 kHz (0.23, 0.43, 0.63 kHz, and so on). In another condition, the tones were “stretched,” so that the frequency interval between adjacent components increased by 3 Hz with each successive component number (0.200, 0.403, 0.609 kHz, and so on). For the two inharmonic conditions, the component that was shifted from its expected frequency was considered to be mistuned. Standard harmonic and mistuned tones were also presented as control conditions. Listeners were able to segregate mistuned components from the inharmonic tones, with sensitivity similar to that observed in the control conditions. The result suggested that harmonic structure was evaluated within restricted regions of the spectrum, and that interactions between adjacent components were more important than deviations from a global spectral pattern tied to f0, the pattern that would be detected by a harmonic sieve.
C. Evoked Potentials in Response to Mistuned Tones
Neural activity evoked by complex tones and recorded non-invasively from human listeners may vary with the harmonic structure of the evoking stimulus. Jones (2003) measured cortical evoked potentials during presentation of sequences of harmonic and inharmonic tones. The latencies of evoked potentials N1 and P1 measured from electrode Fz at the onset of a steady-state tone within the sequence were significantly longer when the evoking stimulus was an inharmonic tone. Harmonicity did not affect evoked potentials recorded at other electrode sites and at other times during the stimulus sequence. The stimulus configuration used in that study does not allow simple comparison to the psychophysical studies reviewed in the previous section.
Dyson and Alain (2004) collected middle-latency auditory-evoked responses (MLAER) in response to complex tones with and without mistuned components, stimuli similar to those used in previous psychophysical studies (Hartmann et al., 1990; Moore et al., 1986). They reported that the amplitude of component Pa of the MLAER increased with mistuning. Significant changes in Pa amplitude occurred at latencies as short as 32 msec, extending the authors’ previous studies in which mistuning had produced changes in evoked and event-related potentials with longer latencies (Alain et al., 2001, 2002). Perceptual segregation of the mistuned component was measured in a separate series of trials, from a subset of the listeners who provided the evoked-potential data. The probability that the listeners reported hearing two tones increased with the amount of mistuning, reaching 0.5 for approximately 6% mistuning, and the increase in Pa amplitude with mistuning roughly followed the increase in probability. The response magnitude increased, even though mistuning did not increase the intensity of the stimulus. The increase in MLAER magnitude with mistuning was not dependent on attention, suggesting that the amplitude increase was a correlate of primitive, rather than schema-based, segregation (Bregman, 1990). The shorter response latency, along with independent evidence that the MLAER originates in the primary auditory cortex (Eggermont and Ponton, 2002), was interpreted as indicating that mistuning is registered at a relatively early, preattentive stage of auditory processing.
III. Neural Representation of Harmonic and Mistuned Complex Tones
The effects on evoked potentials described in the previous section suggest that mistuning produces changes in the responses of neurons in the auditory pathway that are larger than expected given the actual physical change in the stimulus. However, only limited conclusions about the contributions of particular auditory nuclei or neurons within those nuclei to the encoding of mistuned tones can be drawn from evoked potential measurements. To provide information about cellular-level processing that may contribute to spectral segregation, the responses of individual neurons to harmonic and mistuned complex tones have been measured in my laboratory. As Hartmann and others have suggested, the mistuned tone is a relatively simple stimulus that appears to engage the same neural mechanisms that underlie the segregation of mixtures of natural sounds. The observations made so far indicate that mistuning produces disproportionate changes in the discharge patterns of neurons in the IC (Sinex et al., 2002, 2005). By disproportionate changes, it is meant that the discharge rates of individual IC neurons increase even though stimulus intensity does not, that mistuned tones are more likely to elicit temporally patterned responses than harmonic tones, that mistuning changes the periodicity of the response in a way that does not directly follow the change in the frequency of the mistuned component, and that mistuning affects the responses of neurons with characteristic frequencies (CF) remote from the frequency at which the mistuning was applied. The same stimulus manipulations that produce these changes in the IC have more modest effects in the peripheral auditory system; the responses of AN fibers change in proportion to the stimulus, and the changes that do occur are tonotopically local (Sinex et al., 2003). Thus, the representation of harmonic structure undergoes a major transformation at or just below the level of the IC, which appears to result from broadband integration of temporally patterned excitation and inhibition (Sinex et al., 2005). Consequently the IC appears to play a critical role in spectral segregation and, ultimately, sound-source determination.
A. Responses of Individual Neurons to Tones with Mistuned Harmonics
In general, mistuned tones elicit responses from IC neurons that are larger and exhibit unexpected temporal patterning, compared to the responses of the same neurons to harmonic tones. An example is shown in Fig. 2. The top panel (Fig. 2A) is the discharge pattern elicited by a complex tone consisting of the first eight harmonics of 0.4 kHz. The duration of the harmonic tone was 500 msec, but it elicited only a modest transient response from this neuron, similar to the responses elicited from the same neuron by pure tones. The lower panel illustrates the discharge pattern obtained when the fourth harmonic of the tone was mistuned by 12%, from 1.6 kHz to 1.792 kHz. Each presentation of the mistuned tone elicited approximately 10 spikes from the neuron, compared to a rate of <1 spike per presentation of the harmonic tone. The rate increase occurred in the absence of any change in stimulus intensity.
Fig. 2.
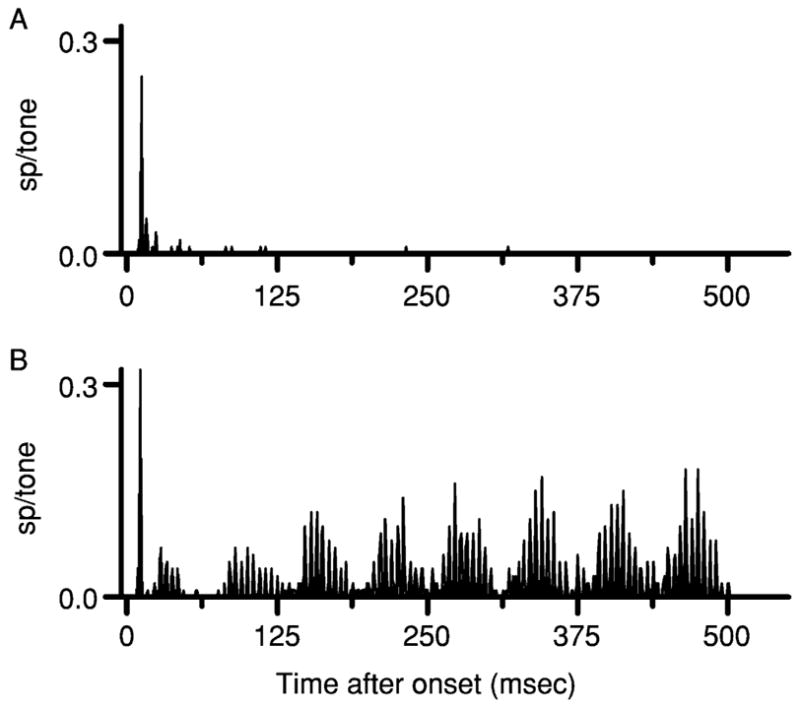
Discharge patterns elicited by complex tones from one IC neuron, shown as peristimulus time histograms. Neuron 0410–11, CF = 2 kHz. (A) Responses to a 500-msec harmonic tone. The tone included the first eight harmonics of 0.4 kHz, with all components having sine phase and equal amplitude. (B) Responses to the same tone with 12% mistuning of the 4th harmonic, from 1.600 to 1.792 kHz.
The mistuned tone also elicited a distinctive temporally patterned response characterized by peaks separated by about 5 msec and a slowly modulated envelope with a period of 62.5 msec. A Fourier transform (FFT) of the cycle histogram indicated that the discharge pattern included large components at 0.208, 0.192, and 0.016 kHz, frequencies that are generated directly or indirectly by beating between adjacent stimulus components. One of these frequencies, 0.208 kHz, matches the difference in frequency between the mistuned fourth harmonic and the tuned fifth harmonic. The stimulus does not have a component or potential beat at 0.192 kHz, but a response at that frequency could be generated by beating between response components synchronized to 0.208 kHz and another synchronized to f0, 0.4 kHz. The 0.016 kHz component could arise from beating between response components at 0.208 and 0.192 kHz. Although the particular frequencies in this example are different, all of these features observed in the response to this tone with f0 = 0.4 kHz have also been observed in the responses to mistuned tones with f0 = 0.25 kHz and with various amounts of mistuning by Sinex et al. (2002, 2005).
Although mistuning can produce dramatic changes in the responses of IC neurons, it has a much less effect on the responses of AN fibers. Figure 3 shows isointensity response areas for one AN fiber (Fig. 3A) and one IC neuron (Fig. 3B) that had the same CF, 1.2 kHz, and similar overall frequency selectivity. The responses of these two units to complex tones are directly compared in Fig. 4. The AN fiber responded with a rate of about 35 spikes per presentation of the harmonic tone (Fig. 4A). The response was highly synchronized to the stimulus, and FFT analysis of the cycle histogram elicited by the harmonic tone revealed large response components at the frequencies of components near CF, 1.2 and 1.6 kHz. As a result of beating between these two adjacent components, the envelope of the response was modulated at 0.4 kHz, the difference frequency and also f0 for the harmonic tone. Response components were also observed at 0.4 and 0.8 kHz that were more likely to be rectifier distortion products that are usually present in the FFT of neural response histograms (Young and Sachs, 1979).
Fig. 3.
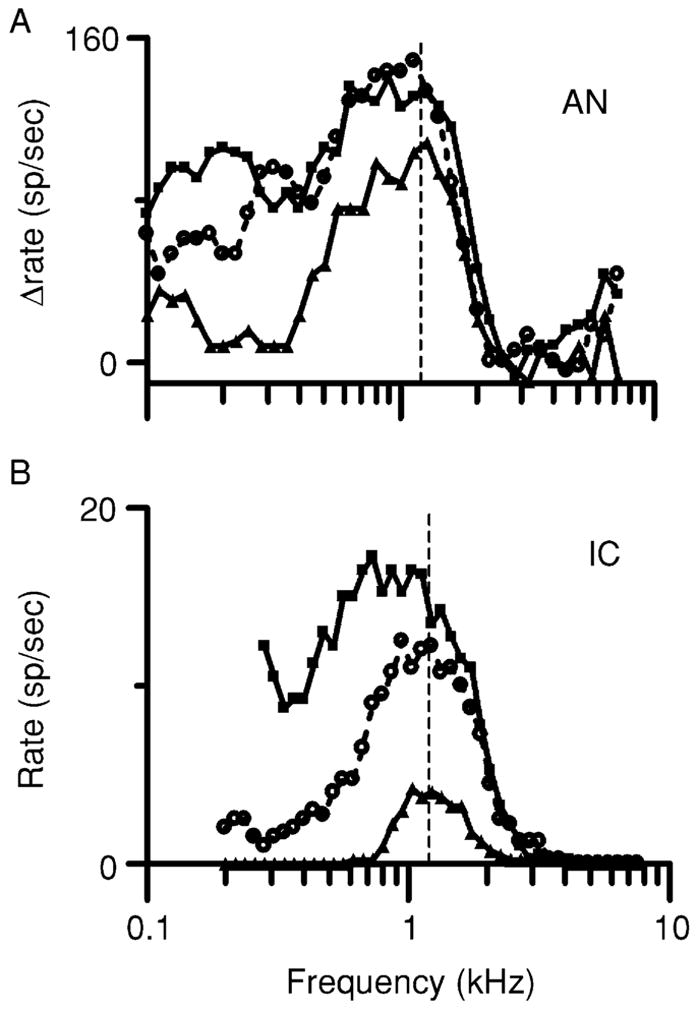
Isointensity response areas recorded at two levels of the chinchilla auditory pathway. (A) Responses from an auditory nerve fiber. Each line represents discharge rate elicited by single tones of variable frequency but constant level. Each rate in spikes/sec has been normalized by subtracting the fiber’s spontaneous rate. Triangles = 30 dB SPL; circles = 50 dB SPL; squares = 70 dB SPL. Fiber 0017–11, CF = 1.2 kHz (vertical dashed line). (B) Similar to A for a neuron in the IC. Discharge rates were not normalized, since the neuron was not spontaneously active. Neuron 0302–20, CF = 1.2 kHz (dashed line).
Fig. 4.
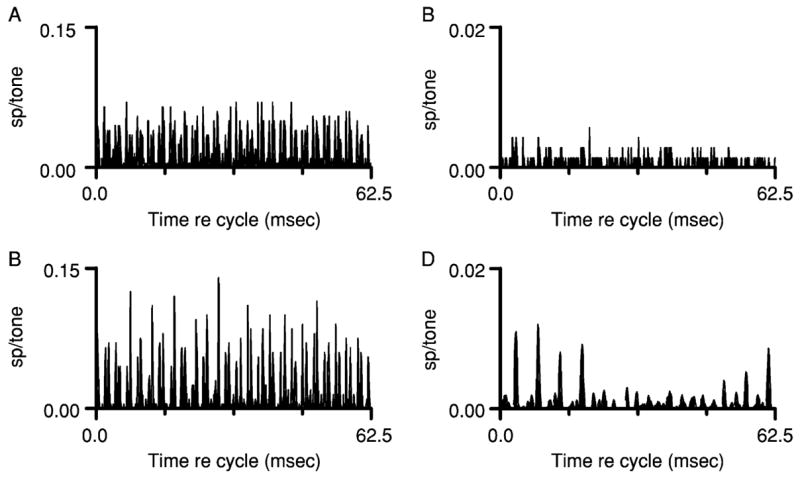
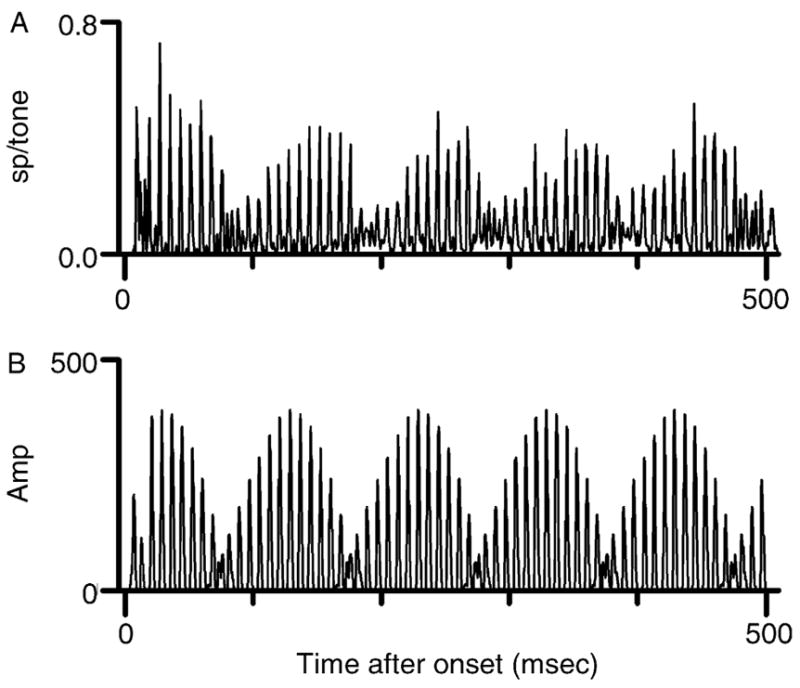
Discharge patterns elicited by complex tones, shown as cycle histograms. The cycle length for the histograms, 62.5 msec, includes 25 cycles of 0.4 kHz, the fundamental frequency of the harmonic tone, and one cycle of 0.016 kHz, the actual fundamental frequency for the mistuned tone. (A) Responses to the harmonic tone, from the chinchilla auditory nerve fiber whose response area was shown in Fig. 3A. (B) Responses of the same fiber to the mistuned tone. (C) Responses to the harmonic tone, from the chinchilla IC neuron whose response area was shown in Fig. 3B. (D) Responses of the same IC neuron to the mistuned tone.
The discharge pattern elicited by the mistuned tone (Fig. 4B) was qualitatively and quantitatively similar to the response to the harmonic tone. Although the peaks in the cycle histogram appear to be slightly larger than those in Fig. 4A, the average rate of 37 spikes per mistuned tone was not reliably higher than the rate in response to the harmonic tone. The major change was that the periodicity of the synchronized response changed as expected from the increase in the frequency of the fourth harmonic; a new response component appeared at the frequency of the mistuned harmonic, 1.792 kHz. Additional components most likely to be rectifier distortion products were also observed. Overall, these responses could be described as resulting from a relatively simple narrowband analysis, in which the complex stimulus was bandpass-filtered and half-wave rectified, comparable to responses observed in previous studies of the representation of harmonic complex tones (Deng and Geisler, 1987; Horst et al., 1986; Wang and Sachs, 1993).
For the IC neuron, the harmonic tone elicited a transient response at the onset of the harmonic tone, similar to the one in Fig. 2A, and a small sustained response (Fig. 4C). Although the pure-tone frequency selectivity of the IC neuron closely matched that of the AN fiber, its discharge rate was much lower, 8 spikes per tone. The cycle histogram (which excluded the onset response) exhibited no obvious temporal pattern that could be attributed to the stimulus. The absence of synchrony to stimulus components with frequencies >1 kHz or to the 0.4-kHz waveform envelope is consistent with previous measurements showing that synchrony to stimulus components and envelopes decreases at successive levels of the auditory pathway including the IC (Kuwada et al., 1984; Langner and Schreiner, 1988; Rees and Møller, 1987). As in the previous example, mistuning had a pronounced effect on the response of the IC neuron. The neuron’s discharge rate increased from 8 to 13 spikes per tone. Mistuning changed the fine structure and the envelope of the response, resulting in a temporal pattern consisting of low-frequency components similar to the example shown in Fig. 2B. These changes were not as easily predictable as they were for the AN fiber, and neither the fine structure nor the envelope appeared to have any counterpart in the responses of the AN fiber with the same CF. It is clear that in the case of the IC neuron, mistuning led to changes in the IC discharge pattern that could not be directly explained by the change in the frequency of one component, or attributed to simple features of IC neurons that distinguish them from AN fibers such as reduced temporal resolution (Joris and Yin, 1992; Langner and Schreiner, 1988). Discharge patterns analogous to the one illustrated in Fig. 4B have been observed in IC neurons that differ in CF and in other pure-tone response properties (Sinex et al., 2005). As a result, it appears that the responses elicited across the population of IC neurons by a mistuned tone are more homogeneous than the responses elicited from the same neurons by pure tones or harmonic complex tones. It is apparent from Fig. 4 that the effect of mistuning is greater at the level of the IC than at the level of the AN.
B. What Accounts for Differences Between AN Fiber and IC Discharge Patterns?
Many characteristics of the discharge patterns of AN fibers can be accounted for, at least to a first approximation. Their frequency selectivity, including the contribution of suppressive sidebands, is determined by the non-linear mechanics of the basilar membrane (BM) and organ of Corti (Ruggero et al., 2000). The discharges of AN fibers will synchronize to the waveforms of simple (Johnson, 1980) and complex sounds (Sinex and Geisler, 1983; Young and Sachs, 1979), within limits imposed by cochlear filtering and the properties of inner hair cells. Because these properties are relatively well understood, at least at the phenomenological level, it has been possible to develop computational models that provide accurate approximations of AN fiber discharge patterns (Meddis et al., 1990; Sumner et al., 2003; Tan and Carney, 2003; Zhang et al., 2001).
Although the frequency selectivity of IC neurons superficially resembles that of AN fibers (Fig. 3), individual IC neurons receive ascending inputs from several different brainstem nuclei (Oliver and Shneiderman, 1991; Roth et al., 1978), some of which are excitatory and some of which are inhibitory (Burger and Pollak, 2001; Li and Kelly, 1992; Saint Marie, 1996; Saint Marie and Baker, 1990). Small spiral ganglion lesions produce CF shifts and other unexpected changes in the shapes of IC frequency tuning curves that could not occur in peripheral neurons, demonstrating that IC neurons integrate frequency information in a complex way (Snyder and Sinex, 2002). In addition, IC neurons receive descending inputs whose effects on the discharge pattern are less well understood but may be as complex as those provided by the ascending innervation (Winer, 2005). Thus, for IC neurons, frequency selectivity measured with single tones usually does not provide a complete picture of the bandwidth or complexity of the inputs that the neuron receives.
A better appreciation of the integrative bandwidth of an IC neuron may be obtained if the frequency pattern of excitation and inhibition is estimated (Burger and Pollak, 2001; LeBeau et al., 2001; Portfors and Wenstrup, 2002; Ramachandran et al., 1999). Inhibitory effects of single tones can be measured if neurons are spontaneously active (Spirou and Young, 1991), but they are difficult or impossible to see in neurons with little or no spontaneous activity. However, inhibition can be seen if the frequency response area is remeasured in the presence of a second, excitatory tone that elicits a modest background discharge rate (Li et al., 2002). An example of the effects of inhibition on the frequency response area of a neuron from the chinchilla IC is shown in Fig. 5. The top panel (Fig. 5A) shows an isointensity contour obtained with single tones presented at 60 dB SPL. The neuron’s CF (estimated from similar contours obtained at lower SPL but not shown in the figure) was 2.3 kHz. The lower panel (Fig. 5B) shows a similar contour, obtained by presenting the same variable frequency, 60 dB SPL tones simultaneously with a fixed tone at 2.3 kHz and 30 dB SPL. Variable tones at frequencies between 0.2 to 0.7 kHz and 3 to 6 kHz strongly inhibited the response to the CF tone. The shaded areas shown in the figure indicate the width of the chinchilla’s psychophysical critical band, measured at 2 kHz with a variable bandwidth masker by Niemiec et al. (1992); the critical bandwidth was 0.92 kHz, or approximately 0.64 octaves (oct). Niemiec et al. (1992) also measured the width of the auditory filter using a notched-noise masker; that bandwidth was even smaller, 0.304 kHz or approximately 0.21 oct. In contrast to these measurements, the bandwidth over which inhibition was observed was nearly 5 oct, a value that far exceeded the width of the psychophysical estimates but was representative of the integrative bandwidth of neurons in our sample. Broadband inhibition like that illustrated in the figure is hypothesized to be essential for producing discharge patterns like the ones shown in Figs. 3B and 4B, as described in the following text.
Fig. 5.
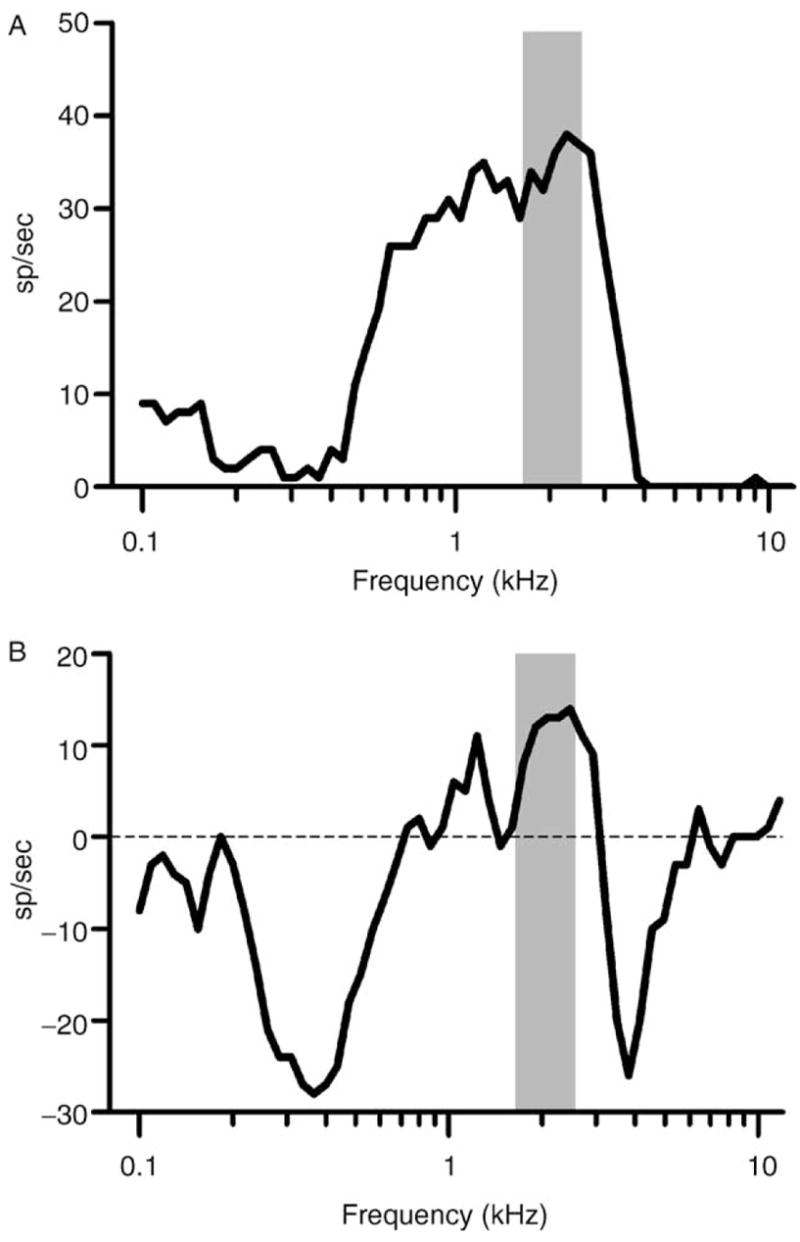
Neural and psychophysical frequency selectivity. (A) Isointensity response areas obtained at 60 dB SPL from one IC neuron, 0410–12, CF = 2.3 kHz. The shaded area marks the extent of the chinchilla’s critical band centered near the neuron’s CF (as reported by Niemiec et al., 1992). (B) Responses to the same tones presented with a simultaneous fixed tone at 2.3 kHz, 30 dB SPL. The average discharge rate elicited by the fixed tone was 29 sp/sec. The ordinate is the increase or decrease from that background discharge rate produced by the second, variable tone. Shaded area: chinchilla critical bandwidth, as in Panel A.
C. A Model That Duplicates the Discharge Patterns of IC Neurons to Mistuned Tones
A computer model that could duplicate the complex temporal discharge patterns of IC neurons was developed and reported by Sinex et al. (2002), and a simplified version of the model was described in greater detail by Sinex et al. (2005). The key features of the model are envelope extraction across a series of narrow bands with different center frequencies, integration over two or more of those bands, and the inclusion of temporally patterned excitatory and inhibitory input. The plots in Fig. 6 illustrate that the output of the model accurately reproduces the temporal discharge pattern elicited by a mistuned tone from a typical IC neuron. The significance of the integration bandwidth is considered further in Section IV.A.
Fig. 6.
Responses of the computational model compared to neural discharge patterns. (A) Responses of the neuron from the previous figure to a mistuned tone with f0 = 0.25 kHz and component 4 mistuned by 12% (from 1.000 to 1.120 kHz). (B) Response of the computational model to the same mistuned tone.
IV. The Possible Relation Between the Responses of IC Neurons and Psychoacoustic Data
Psychoacoustic experiments have established that mistuning creates a spectral cue that promotes perceptual segregation. Mistuning has now also been shown to produce disproportionate changes in the temporal discharge patterns of IC neurons. Manipulations of the complex tone that do not affect the perception of a second tone have more modest effects on IC discharge patterns. Changes in component phases or stimulus level over a moderate range, for example, do not change the frequency content of IC responses, although they can produce shifts in the phase of the response envelope (Sinex et al., 2005). The data support the following conclusions. First, the processing of complex composite signals undergoes a major transformation in the brainstem. Second, stimuli that are heard as more than one sound source generate highly modulated, partially coherent, spatially distributed discharge patterns at the level of the IC, and stimuli such as harmonic tones that do not lead to segregation generate weakly patterned or unpatterned responses in the IC.
A. Interactions Between Stimulus Components in Psychoacoustic and Neurophysiological Observations
There is disagreement about the role played by interactions between adjacent stimulus components in the processing of mistuned tones. Some psychophysical results have been interpreted as suggesting that a mistuned harmonic must be resolved in order to be heard as a separate tone (Moore et al., 1986), while other evidence argues for an important contribution from unresolved components (Hartmann, 1988, 2004). In the microelectrode studies summarized in the previous text, the stimuli were such that neural interactions between adjacent stimulus components nearly always occurred, and so it is fair to ask whether that limits the generality of the neurophysiological observations. A “resolved” component is one that conforms to an operational definition based on other psychophysical measurements (Carlyon and Shackleton, 1994; Plomp and Mimpen, 1968). Shackleton and Carlyon (1994), for example, considered components in harmonic tones to be completely resolved if fewer than two harmonics fell within the 10-dB bandwidths of the auditory filter originally reported by Glasberg and Moore (1990). The distinction between resolved and unresolved components is valid and useful, but it would be an error to assume that two tones that are resolved in the psychoacoustic sense cannot simultaneously influence the responses of a single auditory neuron. As Fig. 5 illustrated, the responses of an IC neuron to one tone or spectral component are routinely affected by other tones separated by much more than the width of the auditory filter. It seems plausible that discharge patterns like those reported by Sinex et al. and summarized here could also be generated in the human IC by harmonic and mistuned tones, including tones consisting only of psychophysically resolved components.
B. Simulated Neural Responses to Complex Tones Used in Psychophysical Experiments
The computational model described in Section III.C was used to estimate the responses of IC neurons to the mistuned-tone stimulus most often used in psychophysical studies. Figure 7A shows the response of the model to a harmonic tone with f0 = 0.2 kHz (Hartmann et al., 1990; Moore et al., 1985, 1986). In response to the harmonic tone, this simulated neuron exhibited a simple modulated envelope whose frequency, 0.2 kHz, was determined by the spacing of components but also matched f0. For the simulation shown in Fig. 7B, the model parameters remained the same but the fourth component of the tone was mistuned by 2.5%. The result was a deeply modulated response similar to those shown previously but with temporal details determined by the particular parameters of this mistuned tone. Peaks in the envelope occurred at approximately 25, 75, 125, and 175 msec.
Fig. 7.
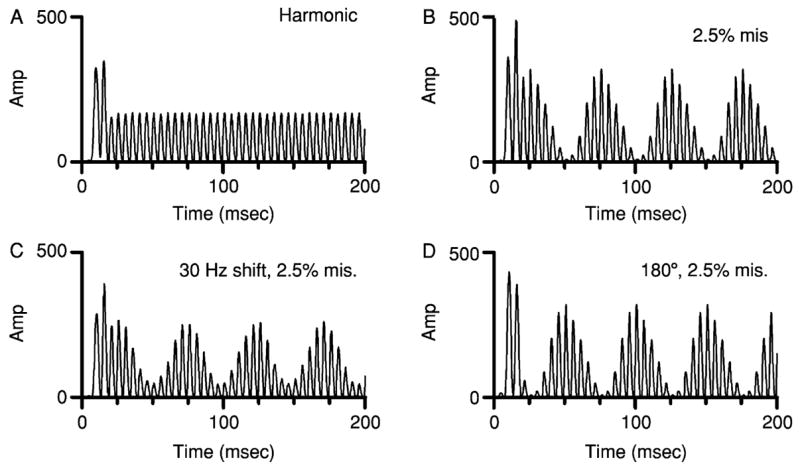
Responses of the computational model to mistuned-tone stimuli used in psychophysical experiments including those by Moore et al. (1986), Hartmann et al. (1990), and Roberts and Brunstrom (1998). Identical model parameters were used for each calculation. (A) Response to a harmonic tone with f0 = 0.2 kHz. (B) Response to a tone with f0 = 0.2 kHz and 2.5% mistuning of component 4. (C) Response to an inharmonic, frequency-shifted tone with component 1 at 0.230 kHz, frequency interval = 0.2 kHz, and 2.5% mistuning of component 4, as in Roberts and Brunstrom (1998). (D) Same as Panel B, except the starting phase of the mistuned component was shifted by 180°, as in Hartmann (1988).
The simulation was repeated with frequency-shifted inharmonic tones, as used by Roberts and Brunstrom (1998). Figure 7C shows the response of the model to a tone in which each component was shifted by 0.03 kHz before the fourth component was mistuned by 2.5%. The frequency shift had little effect on the simulated response; slow modulation was again apparent in the response envelope, and envelope peaks occurred with latencies that were nearly identical to those elicited by the original mistuned tone and shown in panel B. As noted in Section II.B, Roberts and Brunstrom (1998) found that the same frequency shift had little effect on the psychophysical processing of the mistuned component, and the results of the simulation appear to be consistent with that.
An additional set of simulations was based on Hartmann’s (1988) study of the effect of the phase of the mistuned component, results of which were summarized in Fig. 1C. Figure 7D shows the response to a mistuned tone in which a 180° phase shift was applied to the mistuned component. This pattern can also be compared to the pattern in Fig. 7B, the response to the in-phase condition in Hartmann’s experiment. Shifting the phase of one component by 180° produced a 180° shift in the phase of response envelope; envelope peaks occurred at about 50, 100, 150, and 200 msec, a shift of approximately 25 msec, or one-half of an envelope cycle, compared to the envelope of the response in Fig. 7B.
This difference in envelope phase may be related to Hartmann’s (1988) finding that the detectability of the mistuned component varied with duration. Meddis and Hewitt (1991) had previously simulated responses to the stimuli used in that experiment; their analysis based on autocorrelation of simulated AN fiber responses generally reproduced the phase effect, suggesting that psychophysical performance was constrained by the temporal information in the response. Here, simulations of IC responses like those shown in Fig. 7A, B, and D were used to estimate the detectability of mistuning as a function of phase and duration, to determine whether the effect of phase replotted in Fig. 8A might be produced by temporally based processes other than autocorrelation. The detectability of mistuning was assumed to be proportional to the difference between the neural representation of the harmonic tone and the mistuned tone. That was quantified by calculating the RMS difference in the amplitude of the response to the harmonic tone and the response to each mistuned tone, repeating the calculation for tones of varying duration. Each panel of Fig. 8B displays the results of the calculations for two simulated neurons with slightly different CFs. For each phase condition, the amplitude difference measure varied non-monotonically with duration. Across the two phase conditions, large RMS differences for one condition tended to occur for the durations that produced smaller RMS differences for the other condition. Although the patterns did not precisely duplicate the pattern of psychophysical sensitivity, there was a trend for the simulated responses to the in-phase mistuned tone to be larger for the tone durations at which the psychophysical detectability of the in-phase tone was higher, and vice-versa. This preliminary analysis suggests a possible link between the neural representation observed in the IC and psychophysical segregation based on harmonicity.
Fig. 8.
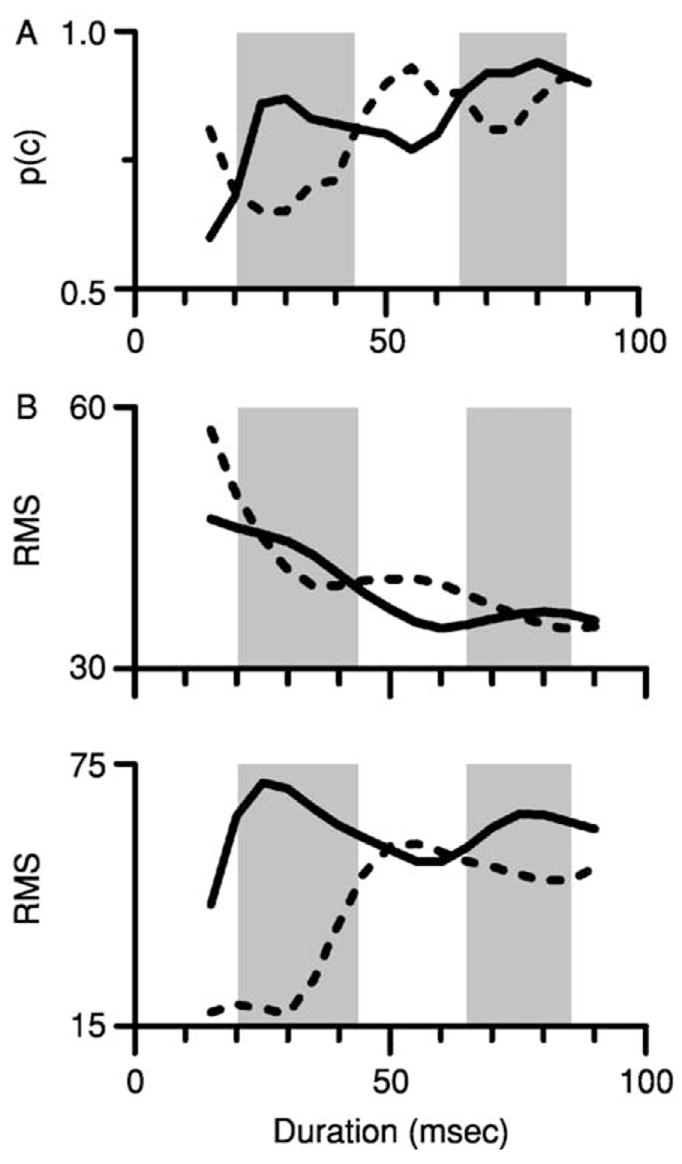
The effect of the phase of the mistuned component on the responses of two simulated IC neurons. (A) Hartmann’s (1988) psychophysical data showing an effect of the phase of the mistuned component on the detection of mistuning (also shown in Fig. 1C). Shaded areas highlight the tone durations at which a mistuned component with phase = 0° was more detectable than the same mistuned component with phase = 180°. (B) Estimates of the detectability of mistuning for the same two phase conditions, derived from the responses of two simulated IC neurons. See Section IV.B. for details. Solid line = mistuned component phase = 0°. Dashed line = mistuned component phase = 180°. Shaded areas highlight the same tone durations as in Panel A.
C. Strategies for Representing Spectral Structure
The fine structure of AN fiber responses encodes the frequencies of individual components of the spectrum. The precision of that representation as measured with pure tones begins to decline at about 1 to 2 kHz (Johnson, 1980; Palmer and Russell, 1986). The frequency range over which synchronized discharges are available is more or less in agreement with the range over which mistuned components can reliably be segregated (Hartmann et al., 1990), suggesting that the initial representation of those components is temporal. At the level of the AN, the temporal representation of components in complex sounds is affected by cochlear filtering but is not influenced by whether the components are part of a harmonic series or not (Sinex et al., 2003).
In contrast, the temporal representation of spectral structure and harmonicity in the IC is quite different from the representation at the level of the AN. IC neurons, because of their lower temporal resolution, do not represent individual components by discharge synchrony. Because their integrative bandwidths are large, they represent envelopes produced by interactions among stimulus components, rather than the components themselves. Harmonic structure determines how many unique response envelopes can be created. For harmonic tones, the frequency of the response envelope can only match f0. Sinex et al. (2005) found that when f0 = 0.25 kHz, a response component with the periodicity of f0 was common throughout the IC, although its magnitude was very low. Fewer observations of responses to the harmonic tone with f0 = 0.4 kHz are available, but one would expect even less synchrony in that case, since the ability of IC neurons to follow modulated envelopes falls rapidly in that frequency range (Langer and Schreiner, 1988; Rees and Møller, 1987). Stimulus-related periodicities other than the one determined by f0 have not been observed in IC responses to harmonic tones.
Unlike harmonic tones, mistuned tones generate response envelopes with multiple frequencies. Adjacent harmonic components beat with one periodicity, as described in the previous paragraph, but the mistuned component can beat with the adjacent harmonic to produce an envelope with a different frequency. The modeling results of Sinex et al. (2005) suggest that those first-order response envelopes also beat with one another, producing the stereotypical low-frequency envelope that is prominent in discharge patterns like the examples shown in Figs. 2B, 4D, and 6A.
According to this view of the determinants of IC discharge patterns, spectral structure is represented by a pattern of low-frequency beats that strongly reflects local spectral patterns. Beating responses also appear to play an important role in the perception of simultaneous vowels (Culling and Darwin, 1994) and in the neural representation of a similar composite stimulus consisting of two simultaneous harmonic tones (Sinex and Li, 2005). In the latter study, adjacent components in the composite signal produced low-frequency modulation in the responses of IC neurons that was quantitatively similar to the modulation produced by mistuned tones. When two harmonic sounds are summed, adjacent components in the composite signal nearly always arise from separate sources, and in most cases the frequency differences are unresolvable by the psychophysical definition, even if the original tones consisted of resolved harmonics. Since the frequency difference between adjacent components in the composite spectrum varies with component number, the range of possible envelope frequencies is even greater than it is for mistuned tones. However, despite this additional complexity in the stimulus, the periodicity of the responses of IC neurons followed the same rules that successfully accounted for the temporal patterns elicited by mistuned tones. As with mistuned tones, the pattern of low-frequency modulation in the responses of IC neurons encoded the relation between adjacent components in composite signals; the discharge patterns did not provide information about individual components.
V. Conclusions
Information about harmonic structure is conveyed in the IC by a code created by interactions between adjacent spectral components. This suggests that the auditory system must work backwards from the pattern of frequency differences to determine the spectra of the original sound sources; that is, an inverse problem must be solved. In the IC, information about individual spectral components is reduced or lost, and the representation of the mixture of envelopes produced by the components in a composite sound is widely distributed across the tonotopic axis. These observations seem to argue against mechanisms that resemble the harmonic sieve. As noted, some psychophysical data also argue against that kind of mechanism. It is not known how the information conveyed by the discharge patterns described here might be extracted at levels central to the IC, or to what extent the decoded information might underlie the determination of sound sources. Those are important issues that could be addressed by future research.
Acknowledgments
Supported by DC00341 from the NIDCD. Drs. Susan Nittrouer and Russell Snyder provided helpful comments on a draft of the manuscript.
References
- Alain C, McDonald KL, Ostroff JM, Schneider B. Age-related changes in detecting a mistuned harmonic. J Acoust Soc Am. 2001;109:2211–2216. doi: 10.1121/1.1367243. [DOI] [PubMed] [Google Scholar]
- Alain C, Schuler BM, McDonald KL. Neural activity associated with distinguishing concurrent auditory objects. J Acoust Soc Am. 2002;111:990–995. doi: 10.1121/1.1434942. [DOI] [PubMed] [Google Scholar]
- Assmann PF, Summerfield Q. Modeling the perception of concurrent vowels: Vowels with different fundamental frequencies. J Acoust Soc Am. 1990;88:680–697. doi: 10.1121/1.399772. [DOI] [PubMed] [Google Scholar]
- Assmann PF, Summerfield Q. Modeling the perception of concurrent vowels: Vowels with the same fundamental frequency. J Acoust Soc Am. 1989;85:327–338. doi: 10.1121/1.397684. [DOI] [PubMed] [Google Scholar]
- Bregman AS. Auditory Scene Analysis . MIT Press; Cambridge, MA: 1990. [Google Scholar]
- Brokx J, Nooteboom S. Intonation and the perceptual separation of simultaneous voices. J Phonet. 1982;10:23–26. [Google Scholar]
- Burger RM, Pollak GD. Reversible inactivation of the dorsal nucleus of the lateral lemniscus reveals its role in the processing of multiple sound sources in the inferior colliculus of bats. J Neurosci. 2001;21:4830–4843. doi: 10.1523/JNEUROSCI.21-13-04830.2001. [DOI] [PMC free article] [PubMed] [Google Scholar]
- Carlyon RP, Shackleton TM. Comparing the fundamental frequencies of resolved and unresolved harmonics: Evidence for two pitch mechanisms? J Acoust Soc Am. 1994;95:3541–3554. doi: 10.1121/1.409970. [DOI] [PubMed] [Google Scholar]
- Carrell TD, Opie JM. The effect of amplitude comodulation on auditory object formation in sentence perception. Percept Psychophys. 1992;52:437–445. doi: 10.3758/bf03206703. [DOI] [PubMed] [Google Scholar]
- Chalikia MH, Bregman AS. The perceptual segregation of simultaneous auditory signals: Pulse train segregation and vowel segregation. Percept Psychophys. 1989;46:487–496. doi: 10.3758/bf03210865. [DOI] [PubMed] [Google Scholar]
- Chalikia MH, Bregman AS. The perceptual segregation of simultaneous vowels with harmonic, shifted, or random components. Percept Psychophys. 1993;53:125–133. doi: 10.3758/bf03211722. [DOI] [PubMed] [Google Scholar]
- Cherry EC. Some experiments on the recognition of speech, with one and two ears. J Acoust Soc Am. 1953;25:975–979. [Google Scholar]
- Cohen E. The influence of nonharmonic partials on tone perception. Dissertation, Stanford University; 1980. [Google Scholar]
- Culling JF, Darwin CJ. Perceptual and computational separation of simultaneous vowels: Cues arising from low-frequency beating. J Acoust Soc Am. 1994;95:1559–1569. doi: 10.1121/1.408543. [DOI] [PubMed] [Google Scholar]
- Darwin CJ, Carlyon RP. Auditory grouping. In: Moore BC, editor. Hearing. Academic Press; San Diego: 1995. pp. 387–424. [Google Scholar]
- de Cheveigné A. Separation of concurrent harmonic sounds: Fundamental frequency estimation and a time-domain cancellation model of auditory processing. J Acoust Soc Am. 1993;93:3271–3290. [Google Scholar]
- de Cheveigné A. Vowel-specific effects in concurrent vowel identification. J Acoust Soc Am. 1999;106:327–340. doi: 10.1121/1.427059. [DOI] [PubMed] [Google Scholar]
- de Cheveigné A, Kawahara H, Tsuzaki M, Aikawa K. Concurrent vowel identification: I. Effects of relative amplitude and f0 difference. J Acoust Soc Am. 1997;101:2839–2847. [Google Scholar]
- Deng L, Geisler CD. Responses of auditory-nerve fibers to multiple-tone complexes. J Acoust Soc Am. 1987;82:1989–2000. doi: 10.1121/1.395643. [DOI] [PubMed] [Google Scholar]
- Duifhuis H. Audibility of high harmonics in a periodic pulse. J Acoust Soc Am. 1970;48:888–893. doi: 10.1121/1.1912228. [DOI] [PubMed] [Google Scholar]
- Duifhuis H, Willems LF, Sluyter RJ. Measurement of pitch in speech: An implementation of Goldstein’s theory of pitch perception. J Acoust Soc Am. 1982;71:1568–1580. doi: 10.1121/1.387811. [DOI] [PubMed] [Google Scholar]
- Dyson BJ, Alain C. Representation of concurrent acoustic objects in primary auditory cortex. J Acoust Soc Am. 2004;115:280–288. doi: 10.1121/1.1631945. [DOI] [PubMed] [Google Scholar]
- Eggermont JJ, Ponton CW. The neurophysiology of auditory perception: From single units to evoked potentials. Audiol Neurootol. 2002;7:71–99. doi: 10.1159/000057656. [DOI] [PubMed] [Google Scholar]
- Glasberg BR, Moore BC. Derivation of auditory filter shapes from notched-noise data. Hear Res. 1990;47:103–138. doi: 10.1016/0378-5955(90)90170-t. [DOI] [PubMed] [Google Scholar]
- Goldstein JL. An optimum processor theory for the central formation of the pitch of complex tones. J Acoust Soc Am. 1973;54:1496–1516. doi: 10.1121/1.1914448. [DOI] [PubMed] [Google Scholar]
- Grube M, von Cramon DY, Rubsamen R. Inharmonicity detection. Effects of age and contralateral distractor sounds. Exp Brain Res. 2003;153:637–642. doi: 10.1007/s00221-003-1640-0. [DOI] [PubMed] [Google Scholar]
- Hall JW, Grose JH. Comodulation masking release and auditory grouping. J Acoust Soc Am. 1990;88:119–125. doi: 10.1121/1.399957. [DOI] [PubMed] [Google Scholar]
- Hall JW, Haggard MP, Fernandes MA. Detection in noise by spectro-temporal pattern analysis. J Acoust Soc Am. 1984;76:50–56. doi: 10.1121/1.391005. [DOI] [PubMed] [Google Scholar]
- Handel S. Timbre perception and auditory object identification. In: Moore B, editor. Hearing. Academic Press; San Diego: 1995. pp. 425–461. [Google Scholar]
- Hartmann WM, McAdams S, Smith BK. Hearing a mistuned harmonic in an otherwise periodic complex tone. J Acoust Soc Am. 1990;88:1712–1724. doi: 10.1121/1.400246. [DOI] [PubMed] [Google Scholar]
- Hartmann WM. Michigan State Psychoacoustics. Report 129. 2004. Detecting a Mistuned Harmonic. [Google Scholar]
- Hartmann WM. Pitch perception and the segregation and integration of auditory entities. In: Edelman G, Gall W, Cowan W, editors. Auditory Function: Neurobiological Bases of Hearing. John Wiley & Sons; New York: 1988. pp. 623–645. [Google Scholar]
- Horst JW, Javel E, Farley GR. Coding of spectral fine structure in the auditory nerve. I Fourier analysis of period and interspike interval histograms. J Acoust Soc Am. 1986;79:398–416. doi: 10.1121/1.393528. [DOI] [PubMed] [Google Scholar]
- Johnson DH. The relationship between spike rate and synchrony in responses of auditory-nerve fibers to single tones. J Acoust Soc Am. 1980;68:1115–1122. doi: 10.1121/1.384982. [DOI] [PubMed] [Google Scholar]
- Jones SJ. Sensitivity of human auditory evoked potentials to the harmonicity of complex tones: Evidence for dissociated cortical processes of spectral and periodicity analysis. Exp Brain Res. 2003;150:506–514. doi: 10.1007/s00221-003-1482-9. [DOI] [PubMed] [Google Scholar]
- Joris PX, Yin TC. Responses to amplitude-modulated tones in the auditory nerve of the cat. J Acoust Soc Am. 1992;91:215–232. doi: 10.1121/1.402757. [DOI] [PubMed] [Google Scholar]
- Kidd G, Mason CR, Brughera A, Chiu CY. Discriminating harmonicity. J Acoust Soc Am. 2003;114:967–977. doi: 10.1121/1.1587734. [DOI] [PubMed] [Google Scholar]
- Kuwada S, Yin TC, Syka J, Buunen TJ, Wickesberg RE. Binaural interaction in low-frequency neurons in inferior colliculus of the cat. IV Comparison of monaural and binaural response properties. J Neurophysiol. 1984;51:1306–1325. doi: 10.1152/jn.1984.51.6.1306. [DOI] [PubMed] [Google Scholar]
- Langner G, Schreiner CE. Periodicity coding in the inferior colliculus of the cat. I Neuronal mechanisms. J Neurophysiol. 1988;60:1799–1822. doi: 10.1152/jn.1988.60.6.1799. [DOI] [PubMed] [Google Scholar]
- LeBeau FE, Malmierca MS, Rees A. Iontophoresis in vivo demonstrates a key role for GABA(A) and glycinergic inhibition in shaping frequency response areas in the inferior colliculus of guinea pig. J Neurosci. 2001;21:7303–7312. doi: 10.1523/JNEUROSCI.21-18-07303.2001. [DOI] [PMC free article] [PubMed] [Google Scholar]
- Lee J, Green DM. Detection of a mistuned component in a harmonic complex. J Acoust Soc Am. 1994;96:716–725. doi: 10.1121/1.410310. [DOI] [PubMed] [Google Scholar]
- Li H, Henderson J, Sinex DG. Responses of Inferior Colliculus Neurons to SAM Tones Located in Inhibitory Response Area. Abstr Assoc Research Otolaryngol. 2002;25:38. doi: 10.1016/j.heares.2006.07.012. [DOI] [PMC free article] [PubMed] [Google Scholar]
- Li L, Kelly JB. Inhibitory influence of the dorsal nucleus of the lateral lemniscus on binaural responses in the rat’s inferior colliculus. J Neurosci. 1992;12:4530–4539. doi: 10.1523/JNEUROSCI.12-11-04530.1992. [DOI] [PMC free article] [PubMed] [Google Scholar]
- Lin JY, Hartmann WM. The pitch of a mistuned harmonic: Evidence for a template model. J Acoust Soc Am. 1998;103:2608–2617. doi: 10.1121/1.422781. [DOI] [PubMed] [Google Scholar]
- Meddis R, Hewitt MJ. Modeling the identification of concurrent vowels with different fundamental frequencies. J Acoust Soc Am. 1992;91:233–245. doi: 10.1121/1.402767. [DOI] [PubMed] [Google Scholar]
- Meddis R, Hewitt MJ. Virtual pitch and phase sensitivity of a computer model of the auditory periphery. II: Phase sensitivity. J Acoust Soc Am. 1991;89:2883–2894. [Google Scholar]
- Meddis R, Hewitt MJ, Schackleton TM. Implementation details of a computational model of the inner hair cell/auditory nerve synapse. J Acoust Soc Am. 1990;87:1813–1816. [Google Scholar]
- Moore BC, Glasberg BR, Peters RW. Thresholds for hearing mistuned partials as separate tones in harmonic complexes. J Acoust Soc Am. 1986;80:479–483. doi: 10.1121/1.394043. [DOI] [PubMed] [Google Scholar]
- Moore BC, Peters RW, Glasberg BR. Thresholds for the detection of inharmonicity in complex tones. J Acoust Soc Am. 1985;77:1861–1867. doi: 10.1121/1.391937. [DOI] [PubMed] [Google Scholar]
- Niemiec AJ, Yost WA, Shofner WP. Behavioral measures of frequency selectivity in the chinchilla. J Acoust Soc Am. 1992;92:2636–2649. doi: 10.1121/1.404380. [DOI] [PubMed] [Google Scholar]
- Oliver DL, Shneiderman A. The anatomy of the inferior colliculus: A cellular basis for integration of monaural and binaural information. In: Altschuler RA, Bobbin RP, Clopton BM, Hoffman DW, editors. Neurobiology of Hearing: The Central Auditory System. Raven Press; New York: 1991. pp. 195–222. [Google Scholar]
- Palmer AR, Russell IJ. Phase-locking in the cochlear nerve of the guinea-pig and its relation to the receptor potential of inner hair-cells. Hear Res. 1986;24:1–15. doi: 10.1016/0378-5955(86)90002-x. [DOI] [PubMed] [Google Scholar]
- Plomp R, Mimpen AM. The ear as a frequency analyzer II. J Acoust Soc Am. 1968;43:764–767. doi: 10.1121/1.1910894. [DOI] [PubMed] [Google Scholar]
- Plomp R, Mimpen AM. Effect of the orientation of the speaker’s head and the azimuth of a sound source on the speech reception threshold for sentences. Acustica. 1981;48:325–328. [Google Scholar]
- Portfors CV, Sinex DG. Coding of communication sounds in the inferior colliculus. In: Winer JA, Schreiner CE, editors. The Inferior Colliculus. Springer-Verlag; New York: 2005. [Google Scholar]
- Portfors CV, Wenstrup JJ. Excitatory and facilitatory frequency response areas in the inferior colliculus of the mustached bat. Hear Res. 2002;168:131–138. doi: 10.1016/s0378-5955(02)00376-3. [DOI] [PubMed] [Google Scholar]
- Ramachandran R, Davis KA, May BJ. Single-unit responses in the inferior colliculus of decerebrate cats. I Classification based on frequency response maps. J Neurophysiol. 1999;82:152–163. doi: 10.1152/jn.1999.82.1.152. [DOI] [PubMed] [Google Scholar]
- Rasch RA. The perception of simultaneous notes such as in polyphonic music. Acustica. 1978;40:21–33. [Google Scholar]
- Rees A, Møller AR. Stimulus properties influencing the responses of inferior colliculus neurons to amplitude-modulated sounds. Hear Res. 1987;27:129–143. doi: 10.1016/0378-5955(87)90014-1. [DOI] [PubMed] [Google Scholar]
- Roberts B, Brunstrom JM. Perceptual segregation and pitch shifts of mistuned components in harmonic complexes and in regular inharmonic complexes. J Acoust Soc Am. 1998;104:2326–2338. doi: 10.1121/1.423771. [DOI] [PubMed] [Google Scholar]
- Roth GL, Aitkin LM, Andersen RA, Merzenich MM. Some features of the spatial organization of the central nucleus of the inferior colliculus of the cat. J Comp Neurol. 1978;182:661–680. doi: 10.1002/cne.901820407. [DOI] [PubMed] [Google Scholar]
- Ruggero MA, Narayan SS, Temchin AN, Recio A. Mechanical bases of frequency tuning and neural excitation at the base of the cochlea: Comparison of basilar-membrane vibrations and auditory- nerve-fiber responses in chinchilla. Proc Natl Acad Sci USA. 2000;97:11744–11750. doi: 10.1073/pnas.97.22.11744. [DOI] [PMC free article] [PubMed] [Google Scholar]
- Saint Marie RL. Glutamatergic connections of the auditory midbrain: Selective uptake and axonal transport of D-[3H]aspartate. J Comp Neurol. 1996;373:255–270. doi: 10.1002/(SICI)1096-9861(19960916)373:2<255::AID-CNE8>3.0.CO;2-2. [DOI] [PubMed] [Google Scholar]
- Saint Marie RL, Baker RA. Neurotransmitter-specific uptake and retrograde transport of [3H] glycine from the inferior colliculus by ipsilateral projections of the superior olivary complex and nuclei of the lateral lemniscus. Brain Res. 1990;524:244–253. doi: 10.1016/0006-8993(90)90698-b. [DOI] [PubMed] [Google Scholar]
- Shackleton TM, Carlyon RP. The role of resolved and unresolved harmonics in pitch perception and frequency modulation discrimination. J Acoust Soc Am. 1994;95:3529–3540. doi: 10.1121/1.409970. [DOI] [PubMed] [Google Scholar]
- Sinex DG, Geisler CD. Responses of auditory nerve fibers to consonant-vowel syllables. J Acoust Soc Am. 1983;73:602–615. doi: 10.1121/1.389007. [DOI] [PubMed] [Google Scholar]
- Sinex DG, Guzik H, Li H, Henderson Sabes J. Responses of auditory nerve fibers to harmonic and mistuned complex tones. Hear Res. 2003;182:130–139. doi: 10.1016/s0378-5955(03)00189-8. [DOI] [PubMed] [Google Scholar]
- Sinex DG, Li H. Responses of inferior colliculus neurons to simultaneous complex tones with different fundamental frequencies. Abstr Assoc Research Otolaryngol. 2005;28:340. [Google Scholar]
- Sinex DG, Li H, Velenovsky DS. Prevalence of stereotypical responses to mistuned tones in the inferior colliculus. J Neurophysiol. 2005 doi: 10.1152/jn.01194.2004. in press. [DOI] [PMC free article] [PubMed] [Google Scholar]
- Sinex DG, Sabes JH, Li H. Responses of inferior colliculus neurons to harmonic and mistuned complex tones. Hear Res. 2002;168:150–162. doi: 10.1016/s0378-5955(02)00366-0. [DOI] [PubMed] [Google Scholar]
- Snyder RL, Sinex DG. Immediate changes in tuning of inferior colliculus neurons following acute lesions of cat spiral ganglion. J Neurophysiol. 2002;87:434–452. doi: 10.1152/jn.00937.2000. [DOI] [PubMed] [Google Scholar]
- Spirou GA, Young ED. Organization of dorsal cochlear nucleus type IV unit response maps and their relationship to activation by bandlimited noise. J Neurophysiol. 1991;66:1750–1768. doi: 10.1152/jn.1991.66.5.1750. [DOI] [PubMed] [Google Scholar]
- Sumner CJ, O’Mard LP, Lopez-Poveda EA, Meddis R. A nonlinear filter-bank model of the guinea-pig cochlear nerve: Rate responses. J Acoust Soc Am. 2003;113:3264–3274. doi: 10.1121/1.1568946. [DOI] [PubMed] [Google Scholar]
- Tan Q, Carney LH. A phenomenological model for the responses of auditory-nerve fibers. II Nonlinear tuning with a frequency glide. J Acoust Soc Am. 2003;114:2007–2020. doi: 10.1121/1.1608963. [DOI] [PubMed] [Google Scholar]
- Wang X, Sachs MB. Neural encoding of single-formant stimuli in the cat. I Responses of auditory nerve fibers. J Neurophysiol. 1993;70:1054–1075. doi: 10.1152/jn.1993.70.3.1054. [DOI] [PubMed] [Google Scholar]
- Winer JA. Descending connections of the cortex and thalamus. In: Winer JA, Schreiner CE, editors. The Inferior Colliculus. Springer-Verlag; New York: 2005. [Google Scholar]
- Yost WA. Auditory image perception and analysis: The basis for hearing. Hear Res. 1991;56:8–18. doi: 10.1016/0378-5955(91)90148-3. [DOI] [PubMed] [Google Scholar]
- Yost WA. Overview: Psychoacoustics. In: Yost W, Popper A, Fay R, editors. Human Psychophysics. Springer-Verlag; New York: 1993. pp. 1–12. [Google Scholar]
- Yost WA, Sheft S. Auditory Perception. In: Yost WA, Popper AN, Fay RR, editors. Human Psychophysics. Springer-Verlag; New York: 1993. pp. 193–236. [Google Scholar]
- Young ED, Sachs MB. Representation of steady-state vowels in the temporal aspects of the discharge patterns of populations of auditory-nerve fibers. J Acoust Soc Am. 1979;66:1381–1403. doi: 10.1121/1.383532. [DOI] [PubMed] [Google Scholar]
- Zhang X, Heinz MG, Bruce IC, Carney LH. A phenomenological model for the responses of auditory-nerve fibers: I. Nonlinear tuning with compression and suppression. J Acoust Soc Am. 2001;109:648–670. doi: 10.1121/1.1336503. [DOI] [PubMed] [Google Scholar]