Abstract
Background
Therapeutic storage of platelet concentrate is a challenging problem for Transfusion Medicine, so that many studies have been carried out with the aim of improving the duration of storage of platelet concentrates. Little attention, however, has been given to the most appropriate biochemical methods for evaluating the quality of the stored platelet concentrates.
Material e methods
Platelet concentrates (n=10) were saved under gentle stirring at 22ºC for a total period of 8 days. Glucose 0.5% (w/v) was added either at the beginning of storage (time 0) or on the fifth day of storage. One millilitre of each concentrate was withdrawn at time 0 and after 5, 6, 7 and 8 days of storage for microbiological culture, evaluation of pH, lactate dehydrogenase (LDH), mean platelet volume, platelet haematocrit and analysis of metabolites of energy pathways (high energy phosphate derivatives, nucleosides, oxypurines and antioxidants) by high performance liquid chromatography.
Results
The addition of glucose 0.5% on day 5 did not produce significant differences in metabolites of energy pathways with respect to control platelet concentrates, whereas when the glucose was added at the beginning of storage (time 0) there was a recovery of ATP, GTP and a decrease of energetic catabolism, demonstrating a beneficial effect on energy metabolism. The changes in LDH values did not parallel those of the metabolites: indeed, only on day 7 of storage did the platelet concentrates treated with glucose on day 5 have significantly lower levels of this enzyme than those found in the other concentrates. The improvements produced by addition of glucose at time 0 were confirmed by morphological analyses (mean platelet volume, platelet haematocrit), and the pH.
Conclusions
The metabolic profile of glucose-enriched plasma concentrates on the fifth day of storage, and the different time course of increased LDH concentration, could represent valid parameters to interpret platelet vitality in the successive days of storage. These preliminary data also indicate that glucose might be a good additive for a new storage formulation.
Keywords: platelet concentrates storage, glucose solution, biochemical evaluations
Introduction
Therapeutic storage of platelet concentrates (PC) is a problem for Transfusion Medicine and many studies have been carried out with the aim of improving the time of PC storage1–6. The survival of platelets, like that of all other 1iving systems, depends on the maintenance of a delicate biochemical balance between different substances including, in particular, glucose, hydrogen ions (pH) and adenosine triphosphate (ATP). The aim of this study was to evaluate the viability and integrity of platelet concentrates stored in autologous plasma enriched in glucose to a final concentration of 0.5% in weight, for a total storage period of 8 days.
The glucose solution was added under sterile conditions using a laminar flow hood.
This study, completely innovative with respect to both the complexity of the reference parameters investigated (pattern of energy metabolism, antioxidants, cell survival enzymes) and the method used to measure them (high performance liquid chromatography, HPLC)7, starts from the use of the substrate most readily available and directly used in the main catabolic cell pathway (glycolysis), that is, glucose. The concentration chosen represents ± 10% of the anticoagulant-conservant ratio used in the mother bag at the time of the collection.
Materials and methods
Random PC were selected for inclusion in this study, according to the following criteria:
all the PC were obtained from the buffy coat, were not leucodepleted and were resuspended in 60 mL of autologous plasma;
all the test groups of PC were stored under the same conditions with complete application of Standard Operative Procedures, current Good Laboratory Practice and Quality Control of the equipment used, according to legislative regulations, European recommendations and internal guidelines;
the PC were stored under agitation at 22ºC for a total of 8 days.
Three groups of PC (ten PC in each group) were formed: one was the untreated control group (A), one group of PC was enriched to a final concentration of 0.5% glucose from the first day of storage (B), and the third group was enriched to the same concentration of glucose on the fifth day of storage (C).
The glucose was supplied by Bieffe Medital (Grosotto, SO, Italy) as a sterile solution.
The analyses were carried out on samples of 0.5 mL taken at time zero, and on the fifth, sixth, seventh and eighth days of storage.
The following parameters were recorded:
- changes in pH,
- morphostructural platelet indices: total platelet count, mean platelet volume (MPV), and platelet haematocrit (PCT),
- metabolites representing cellular energetics: ATP, GTP and oxypurines,
- enzyme marker of cell viability: lactate dehydrogenase (LDH),
- an antioxidant: ascorbic acid,
- microbiological cultures.
Statistical analysis
The differences found in values of metabolites, pH, antioxidants and LDH after various periods of storage were analysed by analysis of the variance (ANOVA) and a two-tailed Student’s t test.
Comparison of the homogeneity of the groups
Thepre-treatmentvaluesofPLT,MPVandPCTofthethree groups of PC were compared to check that they were similar and the correctness of the randomisation.
Since there were no statistically differences, the randomisation can be considered to have been correct and the statistical analysis valid, not being affected by a starting bias (Tables I-III;Figure 1).
Table I.
Comparison of platelet count (PLT) in the three groups of platelet concentrates at baseline before treatment
| PLT (x 1,000) | Group A | Group B | Group C |
|---|---|---|---|
| Mean ± SD | 783 ± 39.2 | 796 ± 20.67 | 794.75 ± 26.9 |
| Range | 730 – 822 | 770 – 815 | 759 – 820 |
| Mode | 730 | 770 | 760 |
Table III.
Comparison of platelet haematocrit (PCT) in the three groups of platelet concentrates at baseline before treatment
| PCT (%) | Group A | Group B | Group C |
|---|---|---|---|
| Mean ± SD | 0.667 ± 0.029 | 0.653 ± 0.017 | 0.617 ± 0.026 |
| Range | 0.630 – 0.690 | 0.630 – 0.670 | 0.590 – 0.640 |
| Mode | 0.630 | 0.630 | 0.590 |
Figure 1.
Changes in platelet count (x1000)
Reagents for HPLC
The ultrapure acetonitrile and chloroform for HPLC were bought from Labscan (Dublin, Ireland) and the ultrapure methanol for HPLC was supplied by Carlo Erba Reagenti (Milan, Italy). Tetrabutylammonium hydroxide was used as the coupling reagent for the separation of the metabolites in the HPLC and was bought as a 55% aqueous solution, supplied by Nuova Chimica (Milan, Italy).
The ultrapure standards were obtained from Boehringer Ingelheim (Mannheim, Germany) and were of the highest purity available.
Preparation of the samples
Every sample taken was centrifuged at 3,500 rpm at 4ºC (Beckman J2–21M/E, Cassina de’ Pecchi, MI, Italy), which produced a cell pellet and the supernatant, treated separately7.
Pellet
The cell pellet was washed with NaCl 0.9% and treated with a solution of CH3CN 75% and KH2PO4 25% (10 mM) at pH 7.4, and then centrifuged at 13,000 rpm at 4ºC, with the aim of obtaining a protein precipitate and an aqueous phase corresponding to the cell contents. This latter was further treated with chloroform in order to obtain a liquid sample ready for analysis by HPLC.
Supernatant
One part of the plasma supernatant was used for the LDH assay, whereas the other was treated with acetonitrile and subsequently with chloroform, thus obtaining a protein pellet and an aqueous phase for analysis by HPLC.
HPLC equipment
The HPLC apparatus consisted of a high pressure, double pump system Constametric 3500 (ThermoQuest Italia, Rodano, MI, Italy), connected to a highly sensitive detector with a series of UV-6000-LP diodes (ThermoQuest Italia), equipped with a photometric cell with a 5 cm optic chamber, allowing the simultaneous reading of the sample at all the wavelengths selected, which in this case were between 200–300 nm. In order to acquire the data and analyse them, the detector was connected, in turn, with a personal computer provided with a calculator for processing the acquired data (ChromQuest®).
The chromatographic separation occurred through a C18 Kromasil 250 x 4.6 mm column, packed with beads of the same diameter (5 μm), such that the diameter of the pores between the beads was 100 ÅBefore the column, there was a pre-column (EKA Chemicals AB, Bohus, Sweden) of the same internal diameter and containing the same matrix. The chromatographic method was based on ionic coupling in which tetrabutylammonium hydroxide was used as the cationic reagent. The various metabolites (high energy phosphate derivatives, nucleosides, oxypurines and anti-oxidants) present in the PC were separated by the formation of a stepped binary gradient.
The temperature of the column was maintained stable at 18ºC by using a thermostatic sheath.
The peaks of the chromatographic runs of the PC were identified by comparing the retention times and absorption spectra with those of a mixture of ultrapure standards7.
The concentrations of the different compounds were calculated by comparing the areas of the peaks with those of the standards injected at known concentrations, at the wavelength corresponding to the maximum absorption of each substance (ChromQuest®, Thermo Electron Co, Waltham, MA, USA).
Results
The data, relating to the quantitative and morphostructural parameters of the platelets (PLT, MPV and PCT) before treatment and storage, are reported in tables I, II and III.
Table II.
Comparison of mean platelet volume (MPV) in the three groups of platelet concentrates at baseline before treatment
| MPV (fL) | Group A | Group B | Group C |
|---|---|---|---|
| Mean ± SD | 8.56 ± 0.38 | 8.18 ± 0.25 | 8.19 ± 0.24 |
| Range | 8.22 – 9.11 | 7.9 – 8.5 | 7.9 – 8.4 |
| Mode | 8.22 | 7.9 | 7.9 |
Microbiological cultures
The microbiological cultures carried out on the eighth day on all the groups of PC were negative.
p H
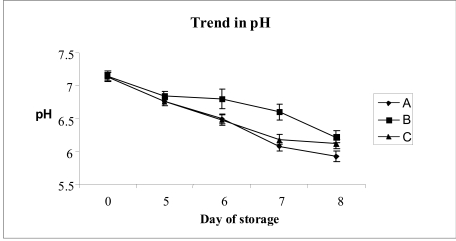
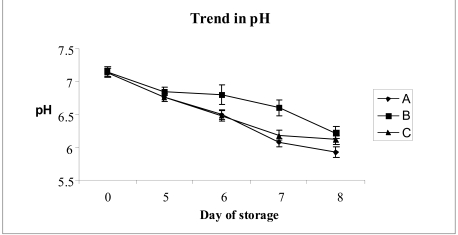
From time zero to the last day of storage (day 8), there was a decrease in the pH in the group A concentrates (from 7.13 ± 0.07to5.92 ± 0.08)andinthegroupCconcentrates(from 7.13to6.12 ± 0.09).
The pH in the group B concentrates on the final day was slightly better, being 6.22 ± 0.065 (Figure 2).
Figure 2.
Changes in the pH according to the duration of storage of platelet concentrates under different experimental conditions (see Materials and methods section). Each point represents the mean of the values for ten different platelet concentrates. The vertical bars represent the standard deviations
Platelet cell energy: ATP and GTP
Figure 3 shows that between the first and fifth days of storage, the ATP content of the PC in groups A and C passed from 2.11 ± 0.08 nmol/mg protein to 1.17 ± 0.07 nmol/ mg protein. The ATP content of the group B concentrates on the fifth day of storage was 2.02 ± 0.18 nmol/mg protein. The decrease in ATP in group B concentrates was linear only starting from the fifth day of storage and reached a final value of 0.52 ± 0.1 nmol/mg protein, very similar to that found in group A and C (ATP = 0.28 ± 0.08 and 0.11 ± 0.079 nmol/mg protein, respectively). The same trend was present for GTP (Table IV).
Figure 3.
Changes in the concentration of ATP according to the duration of storage of platelet concentrates under different experimental conditions (see Materials and methods section). Each point represents the mean of the values for ten different platelet concentrates. The vertical bars represent the standard deviations
Table IV.
Changes in the concentration of GTP according to the duration of storage of the platelet concentrates (PC) under different experimental conditions (see Materials and methods section). Each point represents the mean ± standard deviation of ten different platelet concentrates
| Day of storage | GTP in group A PC (nmol/mg total protein) | GTP in group B PC (nmol/mg total protein) | GTP in group C PC (nmol/mg total protein) |
|---|---|---|---|
| 0 | 0.2 ± 0.01 | 0.22 ± 0.01 | 0.2 ± 0.01 |
| 5 | 0.12 ± 0.02 | 0.19 ± 0.03 | 0.13 ± 0.01 |
| 6 | 0.09 ± 0.02 | 0.14 ± 0.03 | 0.09 ± 0.01 |
| 7 | 0.07 ± 0.01 | 0.11 ± 0.02 | 0.07 ± 0.01 |
| 8 | 0.01 ± 0.01 | 0.05 ± 0.02 | 0.00 ± 0.01 |
Catabolites: oxypurines
Figure 4 shows the calculated content of hypoxanthine in the platelet concentrates of groups A, B and C at different times of storage. It can be seen that the level on the eighth day in the control concentrates was very high (group A: 6.31 ± 0.07 nmol/mg protein compared to the value at time tempo zero, 0.01 ± 0.1 nmol/mg protein), moderately high in the group C concentrates (3.28 ± 0.4 nmol/ mg protein) and low in the group B concentrates (2.07 ± 0.6 nmol/mg protein). The same trends were found for xanthine and uric acid (data not shown).
Figure 4.
Changes in the concentration of hypoxanthine (Hyp) according to the duration of storage of platelet concentrates under different experimental conditions (see Materials and methods section). Each point represents the mean of the values for ten different platelet concentrates. The vertical bars represent the standard deviations
Anti-oxidant: ascorbic acid
The changes in ascorbic acid levels over time are illustrated in figure 5, which shows that all the PC were suffering by the sixth day of storage.
Figure 5.
Changes in the concentration of ascorbic acid according to the duration of storage of platelet concentrates under different experimental conditions (see Materials and Methods section). Each point represents the mean of the values for ten different platelet concentrates. The vertical bars represent the standard deviations
Cell survival: LDH
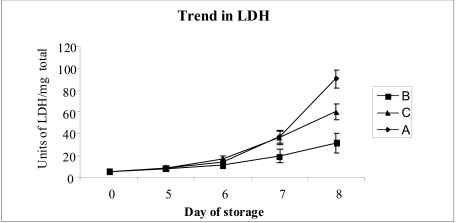
On the fifth day of storage (Figure 6) the LDH values in the three groups of PC were as follows: groups A and C 9.0 ± 0.8 U/mg protein; group B 7.9 ± 0.66 U/mg protein, with the time zero value being 4.9 ± 0.5 U/mg protein. Only on the seventh day of storage did a difference between the LDH levels in group B concentrates and those in groups A and C become evident (19.3 ± 1.8 U/mg protein versus approximately 36 ± 6 U/mg protein, respectively); this difference became more marked by the eighth day of storage (group A: 90.6 ± 8.5 U/mg protein; group B: 31.3 ± 9.1 U/mg protein; group C 60 ± 7.3 U/mg protein).
Figure 6.
Changes in the concentration of lactate dehydrogenanse (LDH) according to the duration of storage of platelet concentrates under different experimental conditions (see Materials and methods section). Each point represents the mean of the values for ten different platelet concentrates. The vertical bars represent the standard deviations.
Changes in quantitative and morphostructural parameters
Changes in the platelet counts, MPV and PCT were evaluated in order to determine whether the addition of glucose to the PC in groups B and C, as described in the methods section, affected these parameters.
The analyses were conducted on the fifth, sixth, seventh and eighth days of storage.
Platelet count
The data concerning platelet count (Table V) indicate that there was already a significant decrease in the number of platelets by day +5 in group A concentrates; in contrast, the difference from the day 0 platelet count in the group B concentrates became statistically significant only on day +8, and the platelet counts in these group B concentrates were statistically significantly higher than those in group A concentrates on all the days of testing.
Table V.
Changes in the platelet count (PLT) according to the duration of storage of the three groups of platelet concentrates described in the Material and methods section
| PLT (x1000) | Day +5 (M ± SD) | Day +6 (M ± SD) | Day +7 (M ± SD) | Day +8 (M ± SD) |
|---|---|---|---|---|
| Group A | 536.2 ± 50.2 (@) | 517.5 ± 16.36 (@) | 511 ± 27.8 (@) | 507.5 ± 28.7 (@) |
| Group B | 746 ± 45.2 (§) | 734.5 ± 30.56 (§) | 720.2 ± 23.6 (§) | 662.33 ± 24.07 (*,§) |
| Group C | 722.75 ± 56.16 (§§) | 694 ± 51.09 (§§,$) | 669.25 ± 42.2 (*,§§,$) | 648.5 ± 16.06 (*,§§,$) |
p< 0.01 compared to baseline -
p< 0.01 (SS) within group (vs +5) -
p< 0.01 (SS) group B vs A -
p< 0.01 (SS) group C vs A -
p< 0.01 (SS) C vs B
Finally, in group C, the late addition of glucose led to a mean platelet count that was significantly different from the baseline count only from day +7; the difference from the control group was always significant, and this difference became in favour of group B from day +6. In other words, the early addition of glucose seems to maintain a higher mean number of platelets compared to the number in the control group (already from day +5) and compared to the number in the group of PC to which glucose was added later (from day +6). These conclusions are confirmed by the ANOVA shown in figure 1.
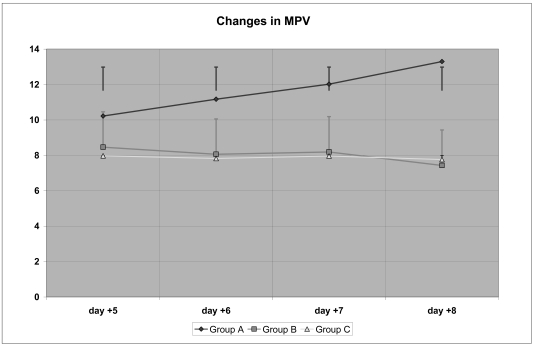
Mean platelet volume
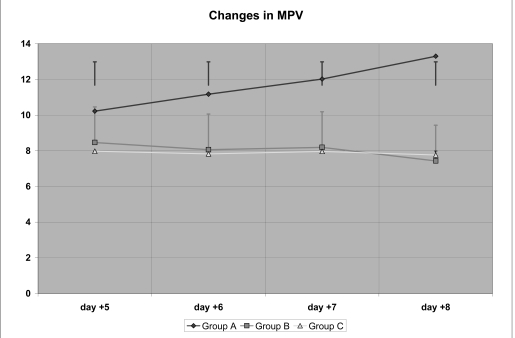
The data related to MPV (Table VI) show that there was a significant increase in the MPV group A concentrates already by day +5, which was statistically significant also for the comparison between day +5 and day +8; in contrast, in the group B concentrates there was a progressive decrease in MPV which became significantly lower on day +8 compared with day +5, but was, at all times, lower than the MPV in group A concentrates.
Table VI.
Changes in the mean platelet volume (MPV) according to the duration of storage of the three groups of platelet concentrates described in the Material and methods section
| MPV (fL) | Day +5 (M ± SD) | Day +6 (M ± SD) | Day +7 (M ± SD) | Day +8 (M ± SD) |
|---|---|---|---|---|
| Group A | 10.22 ± 0.44 (@) | 11.17 ± 0.18 (@) | 12.02 ± 0.26 (@) | 13.3 ± 0.31 (@,*) |
| Group B | 8.46 ± 0.31 (§) | 8.06 ± 0.12 (§) | 8.19 ± 0.13 (§) | 7.43 ± 0.359 (*,§) |
| Group C | 7.97 ± 0.32 (§§) | 7.82 ± 0.29 (§§) | 7.96 ± 0.37 (§§) | 7.76 ± 0.29 (*,§§) |
p< 0.01 compared to baseline -
p< 0.01 (SS) within group (vs +5) -
p< 0.01 (SS) group B vs A -
p< 0.01 (SS) group C vs A -
p< 0.01 (SS) C vs B
A similar trend was seen for the MPV values of the group C concentrates, without there being significant differences between these and those of group B.
Thus, the addition of glucose, whether early or late, seemed to cause a progressive reduction in MPV, in contrast to the MPV in the control group, which increased steadily.
Further studies are necessary to understand the significance of this change, which was also evident by ANOVA (Figure 7).
Figure 7.
Changes in mean platelet volume (MPV)
Platelet haematocrit
Finally, the data related to the PCT (Table VII) document a progressive increase in group A up to a statistically different level on day +8.
Table VII.
Changes in the platelet haematocrit (PCT) count according to the duration of storage of the three groups of platelet concentrates described in the Material and methods section
| PCT (%) | Day +5 (M ± SD) | Day +6 (M ± SD) | Day +7 (M ± SD) | Day +8 (M ± SD) |
|---|---|---|---|---|
| Group A | 0.557 ± 0.039 (@) | 0.623 ± ± 0.032 (@) | 0.657 ± 0.025 (@) | 0.745 ± 0.0.029 (@,*) |
| Group B | 0.642 ± 0.032 (§) | 0.608 ± 0.036 | 0.603 ± 0.021 (§) | 0.523 ± 0.19 (*,§) |
| Group C | 0.593 ± 0.049 ($) | 0.585 ± 0.072 (§§) | 0.608 ± 0.085 (§§) | 0.617 ± 0.13 (§§,$) |
p< 0.01 compared to baseline -
p< 0.01 (SS) within in group (vs +5) -
p< 0.01 (SS) group B vs A -
p< 0.01 (SS) group C vs A -
p< 0.01 (SS) C vs B
There was a tendency for the PCT to decrease in group B, with a significant difference from group A at all measurement times, except on day +6.
The values in group C were essentially stable, with significant differences compared to group A on days +6, +7 and +8; the difference between group B and C values was statistically significant only on day +8.
These findings were confirmed by ANOVA (figure 7), which showed the progressive increase of PCT in groupA, the essentially stable values in group C and the progressive decrease in group B.
Discussion
The parameters currently used to evaluate platelet viability are essentially morphological (such as the extent shape change: morphology score), physiological (but limited to the hypotonic shock response) and metabolic (exclusively pH and ATP8, but with growing interest in assays of lactic acid and glucose consumption9,10).
On the basis of these parameters and the incidence of bacterial sepsis, the international scientific community defined (in 1986) a time limit within which PC, kept under continuous agitation at 22ºC, could be transfused.
Our study confirmed a roughly linear decrease of cellular energy in the control group of PC from the first to the eighth day of storage, as shown by a loss of 44.5% of the ATP and of 40% of the GTP by day 5 and of 87% of the ATP and 95% of the GTP by day 8. These findings were accompanied by an increase in nucleosides (hypoxanthine, xanthine, uric acid) and acidification of the products, indicating marked catabolism. The general picture on the fifth day of storage was, therefore, symptomatic of a metabolically suffering platelet concentrate.
The addition of glucose on day 5 of storage did not produce obvious improvements in cell energetics, even though the cellular pH remained above 6 until the last day of storage, unlike that in the control concentrates, which, at that time, had fallen to 5.93. A slight control of catabolism was obtained on the seventh and eighth days of storage, demonstrated by the fact that neither hypoxanthine nor xanthine concentrations increased significantly (hypoxanthine 3.10 and 3.38 nmol/mg protein and xanthine 0.13 and 0.17 nmol/mg protein, respectively).
The data on ascorbic acid do, however, indicate cell sufferance, since its concentration decreased dramatically from day 5 (0.64 nmol/mg protein), to day 6 (0.48 nmol/mg protein), to day 7 (0.29 nmol/ mg protein) and, finally, to day 8 (0.10 nmol/mg protein).
The addition of the carbohydrate obviously occurred too late to restore cell function. Only when the glucose was added at time zero was there a real change in the metabolic profile of the platelet concentrates on day 5; that is, at the critical time at which the concentrates can be transfused, the cellular energy parameters (ATP and GTP) did not show any alterations (ATP 2.11 nmol/mg protein at time zero and 2.02 nmol/mg protein on day 5; GTP: 0.22 nmol/mg protein at time zero and 0.19 nmol/mg protein on day 5).
An improvement in the metabolic profile of the platelets was confirmed by the data on the catabolites: the mean increase of oxypurines on day 5 was about 24% less in group B concentrates than in the control bags.
Cell survival did not, however, follow the same trend as that of metabolic changes: until day 5 of storage, LDH did not reach dramatic values in any of the platelet concentrates. Only from day 6 onwards was there an increase and then, in the control, group A concentrates and in those in which the glucose was added on day 5 (group C) there were marked increases in the activity of this enzyme in the supernatant.
The values of LDH on the corresponding days, in the PC enriched with glucose at time zero, also rose moderately, although by about 50% less than the increase in the PC in which glucose had been added on day 5 and 70% less than in the untreated, control PC, confirming the benefit of adding this carbohydrate from the first day of storage.
A few important considerations can be made on the metabolic data, combined with those on LDH:
on day 5 of storage, the PC enriched with glucose 0.5% are viable and functional, according to the biochemical parameters monitored,
the general metabolic profile up to the fifth day of storage, characterised by marked catabolism not followed by cell necrosis, definitely represents a further valid means of interpreting the viability of the platelets for subsequent periods of storage,
after the fifth day of storage, all the investigated types of PC lost viability and functionality, although these losses were less marked in the concentrates to which glucose had been added immediately.
Conclusions
The metaoblic profile of glucose-enriched plasma concentrates on the fifth day of storage, and the different time corse of increased LDH concentration, could represent valid parameters for platelet viability in the successive days of storage. The data described above require confirmation, which could be gained from experiments carried out under different conditions. It would be useful to study the dose-effect curve of glucose, and/or the contribution of other metabolic substrates, antioxidants, or mixtures of these, which could maintain the viability of PC stored beyond the canonical 5 days.
Figure 8.
Changes in platelet haematocrit (PCT)
References
- 1.Rebulla P. Concordanze e divergenze delle linee guida per la trasfusione di piastrine. Rapporti ISTISAN; 4/10/2004.
- 2.Badlou BA, Ijseldijk MJW, Smid WM, et al. Prolonged platelet preservation by transient metabolic suppression. Transfusion. 2005;45:214–22. doi: 10.1111/j.1537-2995.2004.04022.x. [DOI] [PubMed] [Google Scholar]
- 3.Heddle NM, Barty RL, Boye D, et al. Evaluation of whole blood derived platelets stored as a pool for 7 days. Transfusion. 2002;42(suppl):S39–030G. [Google Scholar]
- 4.Dijkstra-Tiekstra MJ, Hendriks ECM, Pietersz R, et al. Clinical effectiveness of leukocyte depleted platelet concentrates that were stored for up to 7 days. Transfusion. 2002;42(suppl):S40–030G. [Google Scholar]
- 5.Pietersz RNI, Van der Meer PF. Extended platelet shelf-life. Transfus Apher Sci. 2001;24:239–40. doi: 10.1016/s1473-0502(01)00061-1. [DOI] [PubMed] [Google Scholar]
- 6.Gulliksson H. Platelet storage media. Transfus Apher Sci. 2001;24:241–4. doi: 10.1016/s1473-0502(01)00062-3. [DOI] [PubMed] [Google Scholar]
- 7.Lazzarino G, Amorini AM, Fazzina G, et al. Single-sample preparation for simultaneous cellular redox and energy state determination. Anal Biochem. 2003;322:51–9. doi: 10.1016/j.ab.2003.07.013. [DOI] [PubMed] [Google Scholar]
- 8.Murphy S, Rebulla P, Bertolini F, et al. In vitro assessment of the quality of stored platelet concentrates. Transfus Med Rev. 1994;8:29–36. doi: 10.1016/s0887-7963(94)70095-x. [DOI] [PubMed] [Google Scholar]
- 9.Hornsey VS, McColl K, Drummond O, et al. Extended storage of platelets in SSP platelet additive solution. Vox Sang. 2006;91 :41–6. doi: 10.1111/j.1423-0410.2006.00771.x. [DOI] [PubMed] [Google Scholar]
- 10.Ringwald J, Althoff F, Zimmermann R, et al. Washing platelets with new additive solutions: aspects on the in vitro quality after 48 hours of storage. Transfusion. 2006;46:236–43. doi: 10.1111/j.1537-2995.2006.00716.x. [DOI] [PubMed] [Google Scholar]


