Abstract
Electrical impedance myography (EIM) is a method for non-invasively and quantitatively assessing muscle health, in which the major outcome parameter, phase (θ), decreases in diseased states. In order to create a set of normal reference values, we performed 50 kHz EIM in 5 muscles of 87 healthy individuals, using θ as the major outcome variable. Since the distributions of data were mostly skewed, logarithmic transformations were performed, and the resulting data were fitted to quadratic functions. The lower limit of normal was set by plotting the lower 95% confidence interval of this curve for each muscle and then identifying age-specific reference values. We found that the distribution of data was similar to that for other neurophysiologic parameters. The lower limit of normal was easily defined, and relatively few values fell below the proposed lower limit. By using commercially available bioimpedance devices, these values will allow other investigators to explore the application of 50 kHz EIM in clinical neuromuscular disease research.
Keywords: muscle, electrical impedance, normal values
Introduction
Electrical impedance myography (EIM) is a technique for evaluating muscle based upon the measurement of the surface voltages produced by the application of high-frequency, low-intensity electrical current. To date, the technique has demonstrated potential wide application. Substantial reductions in the primary outcome measure of interest, the phase (θ), have been found in a variety of both localized and generalized neuromuscular conditions, including amyotrophic lateral sclerosis,6 myopathies,7 and radiculopathy. The phase is calculated from the measured raw resistance (R) and reactance (X) values. For theoretical reasons it is thought to be a robust impedance measure, since it is less likely than either raw parameter to be affected solely by changes in the geometry of the region being studied. The frequency of the applied current will also affect the measured resistance, reactance, and phase; whereas most of our early work was performed at 50 kHz, we have also been investigating the value of measurements at multiple frequencies in the hope of discriminating between different disease states.4
Our published work to date has focused mainly on demonstrating reduction in the measured θ in individuals with various neuromuscular disorders compared to age-matched healthy subjects. Specifically, up to this point, we have not attempted to define a range of normal for EIM measurements. Part of the reason for this has been that the technique remains in development, and it is unclear as to whether the basic approach we are currently employing will ultimately prove to be the most effective. Still, defining normal reference values is a critical next step in the development of EIM for more widespread use. Notwithstanding the possibility that the technique will evolve further, establishing normal values will make it considerably simpler for others to begin to apply and utilize EIM for their own clinical research activities.
Thus, in this study, we evaluate a group of normal individuals of varying age, and propose a set of reference values for EIM using a basic technique that can be performed using one of several FDA-approved bioimpedance devices and commercially available disposable electrodes.
Materials and Methods
EIM technique
Data were obtained using either an RJL Model 101-A impedance instrument (RJL Electronics, Clinton Township, Michigan) operating at 50 kHz, or a wide range lock-in amplifier (Signal Recovery Model 7280, Advanced Measurement Technology Inc., Oak Ridge, TN, USA) with current supplied from the 1 volt reference channel output.4 The latter device provides an output at selected frequencies between 500 Hz and 2 MHz, with the 50 kHz values selected for analysis. The two systems were calibrated against the same resistor-capacitor network designed to mimic the behavior of typical muscle tissue.
Electrode arrangements
Although EIM can be applied to any superficial muscle or muscle group, measurements in this study were restricted to 5 muscles: biceps, forearm flexors, quadriceps, tibialis anterior, and medial gastrocnemius. For each muscle, a series of voltage-measuring strip electrodes (part number 019-766400, Viasys Healthcare/Nicolet Biomedical, Madison, WI, cut to half-length) was placed along the long axis of the limb, and two current-injecting electrodes (Disposable Ground Plate Electrodes, part number 019-400500, Viasys Healthcare/Nicolet Biomedical, Madison, WI) were placed at a distance from this array. An example electrode set-up is shown for biceps in Figure 1, while a specific list of electrode placements can be found in Table 1. For upper extremity muscle measurement, the current injecting electrodes were placed on the palms of both hands, and for each lower extremity muscle measurement they were placed on the dorsum of both feet. For this work, only the most proximal and most distal voltage-measuring electrodes from the array were utilized to calculate the voltage difference. Although we had earlier used the entire array to provide an average value, recent work in ALS patients6 suggests that using only the two outermost electrodes of the array provides similar results and greatly simplifies the application of the technique.
Figure 1.
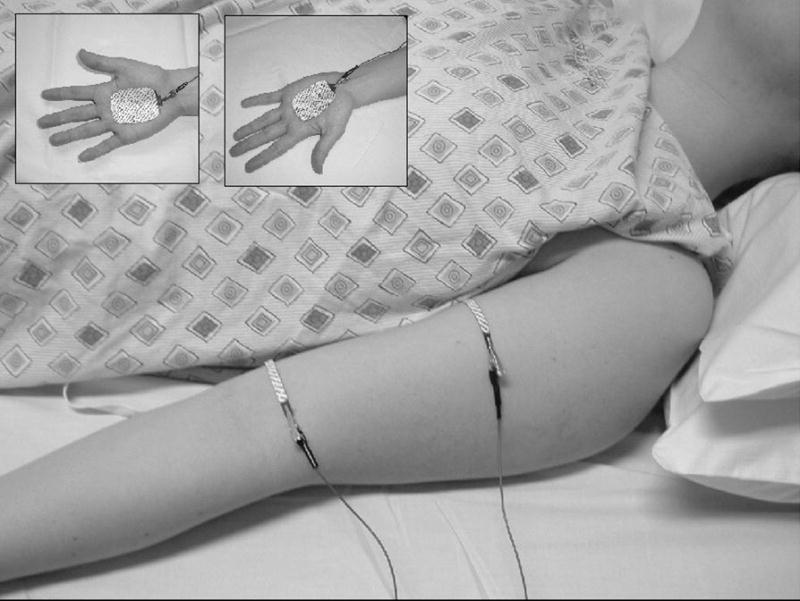
Example of the electrode set-up for biceps brachii. Voltage electrodes are shown in the main panel, while current electrodes are shown in the insets.
Table 1.
Electrode placement in EIM.
| Muscle | Voltage electrode locations | Current electrode locations |
|---|---|---|
| Biceps Brachii | V1, 2.5 cm from insertion of tendon, V2, 12.5 cm proximal to V1 | Palms of hands |
| Forearm Flexors | V1, 10 cm below antecubital fossa, V2 2.5 cm below antecubital fossa | Palms of hands |
| Quadriceps | V1, 12.5 cm proximal to top of patella; V2, 17.5 cm proximal to V1 | Dorsum of feet |
| Tibialis anterior | V1, 15 cm distal to fibular head; V2, 2.5 cm distal to fibular head | Dorsum of feet |
| Medial Gastrocnemius | V1, 17.5 cm distal to midpoint of popliteal fossa; V2, 5 cm distal to same point | Dorsum of feet |
Measurements were obtained on patients lying supine, with the arms lying passively at the sides of the body and a small bolster or pillow under the knees.
Subjects
Normal subjects were recruited through advertisement. No history of neuromuscular disease was present in any patient, and all patients were in generally good health. All subjects were screened with a limited neurological examination, which included strength, sensory, and reflex testing in the arms and legs. Subjects also underwent limited needle electromyography to help exclude the possibility that subclinical disease was present in the muscles to be studied. Subjects who were found to have abnormalities were excluded. The procedures followed were in accord with the standards of the Committee on Clinical Investigation and Institutional Review Board of Beth Israel Deaconess Medical Center. All subjects provided written informed consent prior to participation.
Data analysis
Given the relatively wide variation of values for θ in normal subjects, we took an approach that closely followed the one described for identifying the upper limit of normal for jitter in single fiber electromyography.1 First, histograms were created for the data from each of the muscles studied. Since, as will be shown, the distributions demonstrated substantial skew for most muscles, logarithmic transformations of the data were made in all cases. The standard deviation was then calculated from the log-transformed data, and any data points greater than 4 SDs beyond the lower limit of normal were excluded. The curve was then fitted to a simple quadratic,2 and a parallel curve 1.65 times the standard deviation lower than this quadratic was plotted, representing the 95% lower limit of normal. Lower limits of normal values were established at this level for each decade up to age 80, in a fashion similar to that for SFEMG.3
Results
We enrolled 87 normal subjects, 46 women and 41 men, with a mean age of 52.4 years, ranging from 18.9 years to 90. 8 years. The coefficient of variation was rather large for each of the muscles: 0.23 for biceps, 0.25 for wrist flexors, 0.24 for quadriceps, 0.19 for tibialis anterior, and 0.20 for gastrocnemius. Nonetheless, by using the above approach to data analysis, curves representing the proposed lower limits of normal were readily plotted for each of the muscles (Figures 2a–e). Table 2 provides the data in tabular form by decade for easier reference.
Figure 2.
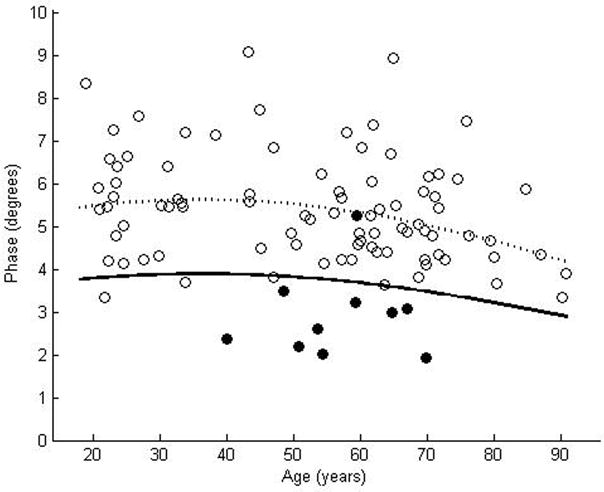
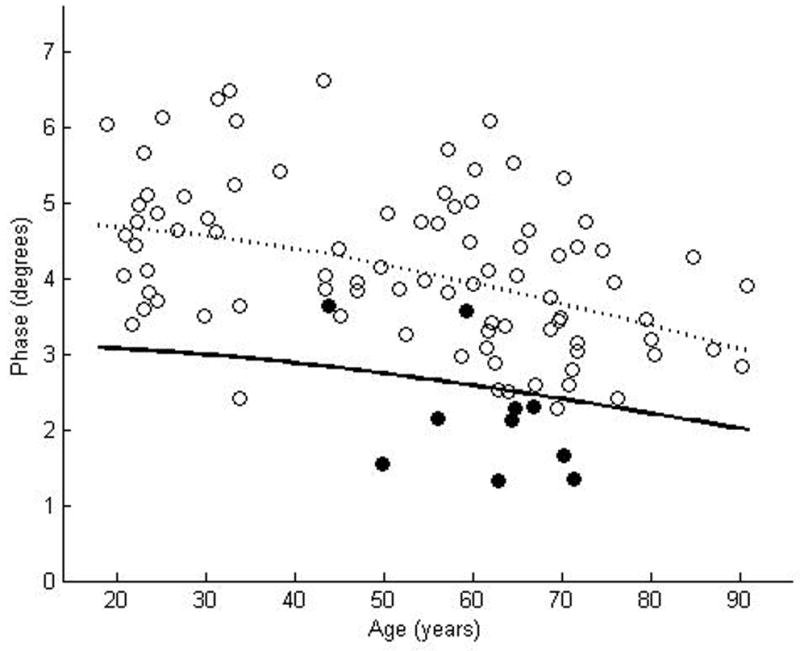
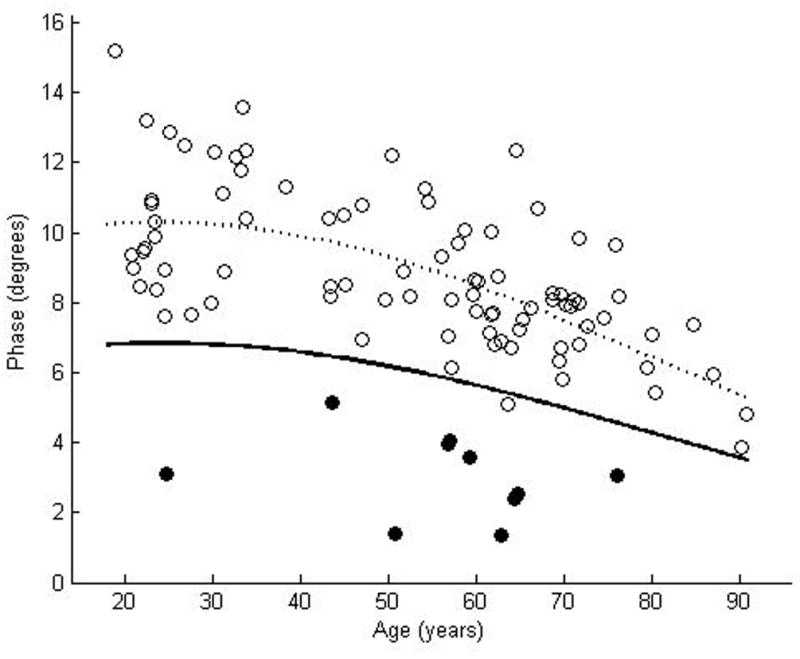
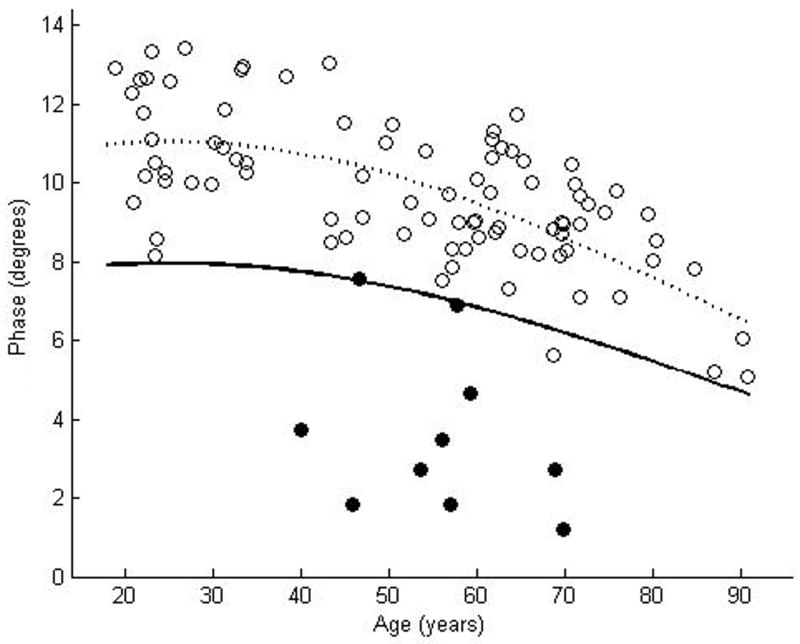
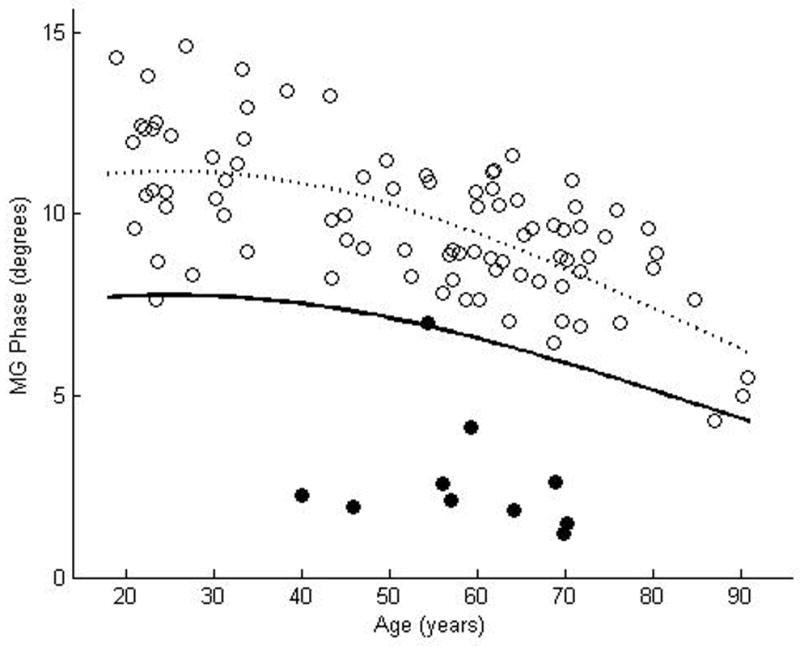
θ measured at 50 kHz for biceps brachii (a), forearm flexors (b), quadriceps (c), tibialis anterior (d), and medial gastrocnemius (e). The dotted line represents the second-degree polynomial regression generated from the log-transformed data with the solid line representing a parallel curve 1.65 SD below this quadratic plot, the 95% confidence interval for the lower limit of normal. Histograms demonstrating the distribution of θ values are shown in the insets.
Table 2.
Reference values for phase measured at 50 kHz
| Age (years) | |||||||
|---|---|---|---|---|---|---|---|
| Muscle | 20 | 30 | 40 | 50 | 60 | 70 | 80 |
| Tibialis Anterior | 7.94 | 7.94 | 7.75 | 7.38 | 6.85 | 6.20 | 5.47 |
| Quadriceps | 6.82 | 6.81 | 6.59 | 6.19 | 5.64 | 4.99 | 4.28 |
| Biceps Brachii | 3.79 | 3.88 | 3.89 | 3.82 | 3.68 | 3.48 | 3.22 |
| Forearm Flexors | 3.07 | 2.99 | 2.88 | 2.74 | 2.58 | 2.40 | 2.21 |
| Medial Gastrocnemius | 7.74 | 7.74 | 7.54 | 7.14 | 6.58 | 5.90 | 5.15 |
All measurements are in degrees (°)
Discussion
These results demonstrate that, despite a relatively wide coefficient of variation among normal individuals, lower limits of normal can be defined easily for EIM. We have taken an approach similar to that used for defining the upper limit of normal in single fiber needle electromyography, as the techniques have statistical similarities, including a fairly wide variation among normal subjects and a clear age-dependence with values substantially changing after age 60.1,2 However, compared to the values used for developing limits of normal for SFEMG, our data appear to be more “well-behaved” with relatively few individual values extending much beyond the proposed lower limit of normal (i.e., low false positive rate).
In the initial work developing reference values for single fiber EMG, the data were provided as plots of upper limits of jitter versus age. It became clear that for the values to be clinically useful, an actual numerical value would be helpful, and a follow-up analysis was published providing a set of numerical ranges.3 We have taken that second step here too, and we provide a convenient table of lower limits of normal for each decade up to age 80 for each of the five muscles.
Two points require further amplification. First, as noted in the methods section, only two voltage electrodes were utilized for these reference value measurements. We do not use an array of up to 10 electrodes, as we previously did in several of our earlier studies. To obtain data from multiple electrodes is considerably more time consuming and would almost certainly require an instrument with an automated switching scheme to speed the process. Although in our initial work we thought such a multi-electrode approach might be useful, at this point, it appears that these additional measurements do not add much value. Indeed, in our ALS study, we compared a multi-electrode approach vs. a two-electrode approach and found that the data were remarkably similar.6 However, we highlight this point, since results obtained with multiple voltage electrode arrays, cannot be compared directly with those obtained using two voltage electrodes. Second, although some of our previous work has suggested that normal values may be different for healthy men and women,2 in this study we do not present such data. We did, in fact, preliminarily examine these values and identified minimal gender differences. For ease of use and conformity with reference values supplied for most other electrophysiologic variables, therefore, we did not attempt to create gender-specific tables.
As we note above, the data obtained with EIM, like that obtained from single fiber EMG is dependent on the technical parameters of the measurements. For EIM, that includes the exact electrode size, the inter-electrode distances utilized, the frequency of current injected, and the specific locations of the electrodes along the muscles. For example, we have previously reported the effect of electrode size and position in an earlier study, and we found that EIM parameters changed up to 15% for 1 cm shifts in the voltage electrode placement and from 2–9% for variations in the size of the electrodes.5 Unlike other well-accepted neurophysiologic techniques, EIM still remains in a relatively early stage of development and thus the data presented here represent a first attempt at standardizing our measurement techniques.
The data presented here serve three important purposes. First, this work demonstrates the feasibility of creating a normal reference data set for EIM akin to that available for other forms of neurophysiologic data. Second, this data can serve as a foundation for a more complete reference value set, which will incorporate other commonly tested muscles. Third, it will allow EIM to be evaluated and studied by other investigators, since FDA-approved 50 kHz bioimpedance devices are available from several manufacturers, including the Quantum 2 (from RJL Systems, Inc, Clinton Twship, MI) and the DF50 (from Impedimed, Inc, Pittsford, NY). Although the systems we used here were designed specifically for more complex investigations (namely performing measurements at multiple frequencies and multiple locations along the muscle), the basic data acquisition method remain the same. Ultimately, by providing a basis for defining normal versus abnormal, we hope that the data presented here will induce other investigators to pursue clinical research in EIM.
Acknowledgments
This study was funded by the National Institutes of Health Grant RO1-NS42037-01A2, Grant RR01032 to the Beth Israel Deaconess Medical Center General Clinical Research Center
Abbreviations
- EIM
electrical impedance myography
- R
resistance
- ROC
receiver operating characteristic
- SFEMG
single-fiber electromyography X, reactance
- θavg
spatially-averaged phase
- θ
phase
References
- 1.Single fiber EMG reference values: a collaborative effort. Ad Hoc Committee of the AAEEM Special Interest Group on Single Fiber EMG. Muscle Nerve. 1992;15:151–161. doi: 10.1002/mus.880150205. [DOI] [PubMed] [Google Scholar]
- 2.Aaron R, Esper GJ, Shiffman CA, Bradonjic K, Lee KS, Rutkove SB. Effects of age on muscle as measured by electrical impedance myography. Physiol Meas. 2006;27:953–959. doi: 10.1088/0967-3334/27/10/002. [DOI] [PubMed] [Google Scholar]
- 3.Bromberg MB, Scott DM. Single fiber EMG reference values: reformatted in tabular form. Ad Hoc Commitee of the AAEEM Single Fiber Special Interest Group. Muscle Nerve. 1994;17:820–821. doi: 10.1002/mus.880170720. [DOI] [PubMed] [Google Scholar]
- 4.Esper GJ, Shiffman CA, Aaron R, Lee KS, Rutkove SB. Assessing neuromuscular disease with multifrequency electrical impedance myography. Muscle Nerve. 2006;34:595–602. doi: 10.1002/mus.20626. [DOI] [PubMed] [Google Scholar]
- 5.Rutkove S, Partida R, Esper G, Aaron R, Shiffman C. Electrode position and size in electrical impedance myography. Clin Neurophys. 2005;116:290–299. doi: 10.1016/j.clinph.2004.09.002. [DOI] [PubMed] [Google Scholar]
- 6.Rutkove SB, Zhang H, Schoenfeld DA, Raynor EM, Shefner JM, Cudkowicz ME, Chin AB, Aaron R, Shiffman CA. Electrical impedance myography to assess outcome in amyotrophic lateral sclerosis clinical trials. Clin Neurophysiol. 2007;118:2413–2418. doi: 10.1016/j.clinph.2007.08.004. [DOI] [PMC free article] [PubMed] [Google Scholar]
- 7.Tarulli A, Esper GJ, Lee KS, Aaron R, Shiffman CA, Rutkove SB. Electrical impedance myography in the bedside assessment of inflammatory myopathy. Neurology. 2005;65:451–452. doi: 10.1212/01.wnl.0000172338.95064.cb. [DOI] [PubMed] [Google Scholar]


