

Abstract
The efficacy of microarrays in examining gene expression, gene and genome structure, protein-DNA interactions, whole-genome similarities and differences, microRNA expression, methylation, (and more), is no longer in question. It is a fast-developing, cutting edge technology that has grown up along with massive sequence databases and is likely to become part of everyday patient care. Many advances have recently expanded the power and utility of microarrays; among them is our development of a new array tiling technique that dramatically increases the scope of coverage of an oligonucleotide tiling array without substantially increasing its cost.
Introduction
DNA microarrays have become so popular that they are nearly ubiquitous; this is not surprising, as scientists can use them to examine large segments of a genome in a single experiment, a feat that has transformed genetics. Microarrays can be used to address basic scientific questions as well as in therapeutic and biomedical applications. They are used to investigate the molecular basis of genetic disease, to define the diagnosis or a group of marker genes responsible for a particular condition, to ascertain specific drug response mechanisms, or to establish therapeutic strategies for a medical disorder.
Attaching known nucleic acid probes to a solid substrate is a simple, yet brilliant concept. When a labeled extract binds the attached probes, the resulting signal, while not trivial to interpret, reflects the quantity of complementary molecules present in the extract, and the scope of the results is limited mainly by the number of features on the array. In recent years, great effort has been made to create microarrays with more features, (both by reducing the feature size and increasing the scanners’ resolution). With higher density arrays, and thereby wider scope, more comprehensive results can be achieved. Indeed, microarray development parallels current manufacturing trends of miniaturization and increased throughput, and it has been suggested that the number of features on an oligonucleotide tiling array follows Moore's Law1. As in the world of computers and MP3 players, the price of the average product stays the same regardless of the number of bytes (or features), so that microarray technology remains a very expensive research tool, prohibitively so for many labs, especially when a typical design involves multiple experimental replicates (a single microarray is suggestive but never conclusive, so even at a few hundred dollars apiece, microarray costs add up quickly as replicates are performed). Multiple technical replicates can be performed simultaneously on newer multiple-array formats, though these arrays have even fewer features and are identical to each other, and technical replicates are of arguable value. If current applications do not scale up much further, though, the tremendous increases in microarray density will eventually make this an affordable technique for most labs; however, it would be surprising if biologists stopped inventing more creative ways to take advantage of every advance in this technology.
Array technology is an obvious way to access the recent explosion of large-scale genomic information, though the above cost considerations are limiting, particularly when a single experiment could require dozens of slides for each replicate. Using a simple strategy, we can effectively double or better the scope of coverage of a microarray without changing its cost. This increase in density should minimize the number of required arrays for a particular experiment, maximizing the contents to include additional controls or experimental probes covering more genomic sequence. In turn, this will reduce the overall cost per experiment, making the technology more accessible to the scientific community and, especially, smaller laboratories.
Currently accepted microarray terminology
In this review, we adhere to the MGED/MIAME approved terminology2-4 to describe the various parts of a microarray. An array consists of individual molecules of known sequence, the “probes,” immobilized in clumps of many identical probes in areas known as “features.” The labeled molecules whose identity/abundance is being detected on the array are the “targets;” they bind to the features and are part of the starting biological sample, the “labeled extract.”
A brief history of microarrays, as their history is brief
The idea of performing chemical or biological reactions with one reagent spatially immobilized is not new. Southern's 1975 paper5 described a technique that needs no introduction, and forever altered molecular biology. A decade later, researchers began work on a reciprocal technique, in which the known molecules were immobilized on a membrane or slide, and the solution to be queried was labeled and hybridized to the surface. Several publications from the 1980s6-8 describe the use of such arrays in DNA mapping and sequencing. This work culminated in the 1991 publication by Fodor et al. of Affymax9 (later to become Affymetrix) describing protein and nucleotide arrays, their construction (on microscope slides using photolithography) and their uses. At first, the technique was somewhat limited, but as sequencing data began to accumulate, so grew the power of microarrays; the scope of questions to be answered was limited only by the amount of known genome sequence that could be placed on an array.
By 1999, one could find several publications, including the landmark papers from Brown's group and collaborators 10-14, that introduced the scientific community to the staggering potential of microarrays. In fact, Schena et al 10 first introduced the term, “microarray,” in 1995. These papers described the use of microrarrays as methods for sequencing and gene expression monitoring in the burgeoning field of high-throughput biology, and set off a trend that is still gaining momentum. In fact, the 21st century has seen an explosion in microarray-based publications as researchers find more and more uses for the technology, and one would be challenged indeed to find an issue of a modern biology or genetics journal that does not mention microarrays (Figure 1).
Figure 1.
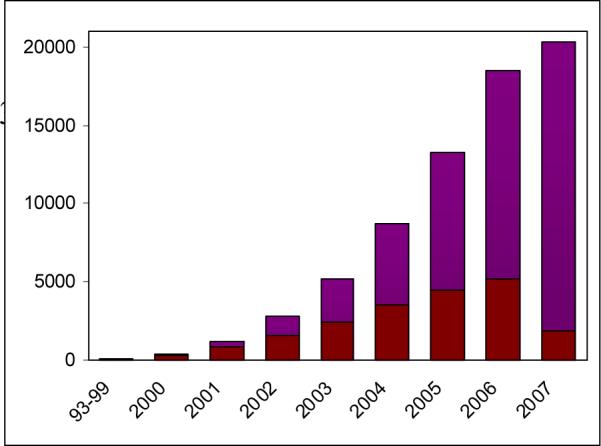
Dramatic increase in microarray citations with time (PubMed). From just over 100 publications at the end of 1999, the number of microarray citations has been exponentially increasing with each passing year, reaching over 5,200 papers in 2006, numbering more than 22,500 publications in all. In the first 11 months of 2007, there have been over 5,516 microarray publications, on track for a potential total of >6,000 additional microarray publications for the year. In red is the per-year number of publications, in purple the cumulative tally.
What is a microarray: fabrication techniques
A typical microarray consists of known biological molecules, probes, affixed to a solid support, which can be a glass slide, a custom surface, or a membrane. These probes bind their labeled targets, and the resulting signal is analyzed computationally. The key to microarray technology is that a probe is detected at a level that is proportional in a predictable way to the amount of its target present in the labeled extract.
At first, microarrays were custom made by individual researchers by hand or using simple spotting robots; the usual form of DNA deposited on these slides was cDNA clone inserts hundreds of base pairs long. Now, relatively few people make their own arrays, as commercial oligonucleotide-based microarrays are less prone to variation, have become more affordable, and offer far greater feature densities15. We primarily discuss commercial oligonucleotide arrays, which are fabricated on glass slides or other solid support. Illumina arrays are slightly different in that the oligos are bound to very densely spaced beads randomly positioned on the surface of a chip. 16.
Oligonucleotide fabrication techniques vary from manufacturer to manufacturer, and are described in a recent review15. Table 1 provides a brief synopsis of the physical characteristics of microarrays. The manufacturing process used for each array is what limits the number and quality of features achieved, determines the flexibility of the platform, and influences the cost. More techniques are being developed 17, 18, and the landscape of microarray manufacturing is still evolving rapidly.
Table 1. A brief overview of array characteristics from some of the major companies.
Information here is given for the densest array available from each manufacturer. Manufacturers were chosen for inclusion based on popularity and ease of obtaining information.
| Manufacturer | Probe length | Number of features | Feature size (microns) | Synthesis technique |
|---|---|---|---|---|
| ABI | 60mers | 32,878 | 170 | Presynthesized oligomers |
| Affymetrix | 25mers | 6.5 million (half are negative controls) | 5 | Photolithograghic masking to direct photochemical in situ synthesis |
| Agilent | 60mers | 244,000 | 65 | in situ oligo synthesis (non-contact inkjet) 19 |
| CodeLink | 30mers | 57,000 | 45 | Presynthesized oligomers deposited in active gel matrix |
| Combimatrix | 18−50mer | 12,000 | 44 | in situ oligo synthesis (electrochemical detritylation) |
| Illumina | 50mers | 1.072 Million | 3-micron beads | Presynthesized oligos are bound to beads 16 |
| Nimblegen | 50−75mers | 2.1 Million | 13 | Tiny digital mirrors guide light beams to mediate in situ photochemical synthesis |
Microarrays as a tool
To many biologists and clinicians, asking why one would use microarrays is akin to asking a sommelier why one would drink wine rather than water. Compared to other molecular biology techniques, using an array can conserve precious samples, can decrease the amount of human-mediated processing, increase reproducibility, and decrease the amount of time needed to complete an experiment20. Microarrays, when well designed, can answer a multitude of questions in a single experiment, or can expand the reach of an experiment to previously unobtainable scales. There are problems, of course: microarrays are still expensive and labs cannot afford to waste them on poorly contrived experiments, and, more seriously, microarray experiments generate enormous amounts of labyrinthine data that do not easily yield to analysis.
Microarrays have many uses, and researchers are continually inventing ever more fascinating ways in which to employ them. The first microarray experiments were largely concerned with DNA mapping and sequencing. By the mid-90s, scientists had extended the realm of microarray capabilities by using the technique to examine gene expression levels of dozens to hundreds of genes simultaneously12, 21, thereby establishing microarrays as a viable and flexible molecular biology tool. A promising early use of microarrays was in drug discovery (pharmacogenomics) — developing new drugs to correct or at least offset detected gene expression changes mediated by a specific gene defect22, 23. Another early application was in toxicology (toxicogenomics), finding correlations between changes in genetic profiles and effects caused by exposure to toxic agents24. Microarrays were soon utilized for genome-wide genotyping, SNP detection studies, and resequencing applications. They were later used to characterize the expression signatures of different types of cancer and to classify tumor types. Microarrays are now already being used for diagnostics (AmpliChip CYP450), and, cost permitting, could be quick and reliable assays to screen for disease mutations, or for identification of genes with a key role in disease pathways.
Boguski's group saw arrays as potential aids in genome annotation25. Shoemaker and colleagues26 developed the first version of TAG arrays, designed to query the entire yeast genome in a single hybridization. Their work has been continued and expanded by Yuan et al.27 as well as Pierce et al.28 Lenoir and Giannela29 have written an excellent review of the early days of microarray technology.
Tiling arrays, in which the probe sequences are simply derived sequentially, moving along the genome, without regard to sequence features (except that repeats are usually skipped), were soon popularized. These arrays are particularly powerful, as they allow a researcher to discover the truly unexpected, which is exactly what happened when scientists began to realize that an unexpectedly large portion of the human genome is transcribed30, 31. In addition to elucidating gene regulatory pathways32, tiling arrays found another creative use in splice variant analysis and the in-depth examination of gene structure; this research so far has challenged our notion of what a gene is. Another application of tiling arrays is in array CGH, in which two genomes are compared in their entirety in a single experiment to see whether pieces of one genome or the other are amplified or have been lost. This type of analysis has proven especially helpful to human disease research, particularly to cancer research.
SNP arrays, designed to detect single nucleotide polymorphisms, have found many uses, including analysis of cancerous cells and tissues in search of copy number variants33.
Other applications of microarrays are appearing rapidly. Innovative sample preparation techniques soon allowed examination of DNA-protein interactions (for example, ChIP-on-chip1, 34 and transcription factor binding site definition35, 36). DNA methylation studies using tiling arrays are just beginning to appear37, and show great promise as a method for examining epigenetic regulation on a genome scale. Microarrays have also been a critical addition to the fast-paced field of microRNA research38. A recent publication describes a method for using microarrays to estimate exposure to ionizing radiation through expression profiling39, and the authors note that their method could be extended to detect exposure to other toxins as well.
Recently, we have used microarrays to uncover transposon insertions in the yeast genome40. Our Transposon Insertion site Profiling chips (TIP-chips) rely on vectorette PCR to amplify transposon flanks, which are hybridized to a tiling array, allowing one to locate transposons, both previously identified and new polymorphisms, in any given sample.
Currently, microarray derived data must adhere to MIAME standards41 and data used in manuscripts should be deposited in a public repository such as GEO42, 43 or ArrayExpress44 as a condition of acceptance for publication, allowing the entire scientific community to benefit from these experiments. As a result, meta-analyses of such data can be done in silico to arrive at biologically meaningful conclusions; for example a non-small-cell lung cancer survival study was performed by examining several published datasets 45. The authors described a genetic signature of the condition that may be useful for patient management.
Problems and challenges with microarrays
Microarrays are expensive. Depending on the platform, a single experiment can cost hundreds if not thousands of dollars, and there is currently no consensus about how many replicates need to be done, although the number, fortunately, appears to be low46, 47. The cost of the arrays is independent of the cost of the reagents (the Cy3 and Cy5 fluorescent dyes coupled to triphosphates are expensive, as are the kits for biotin, single dye labeling, and the biotin labeling protocols are tedious and time consuming). The array scanner and workstation (though a one-time purchase and often shared via a core facility), the effort of a technician and an analyst, and of course the intangible cost associated with the time spent doing the experiment in the first place, must all be added to the cost of microarray experimentation.
Table 1 does not take into consideration an extremely important point, often overlooked, in microarray experiments: that is, how many times can the array be stripped and reused. Combimatrix and Nimblegen offer protocols and advice to those wanting to reuse their arrays, but as far as most companies and investigators are concerned, arrays are single-use reagents. Many home-brewed protocols describe stripping procedures for other arrays, but not everyone agrees that these techniques yield an array that is as unbiased as one that has never been used.
Probe length is still a controversial subject, with some claiming that shorter probes are more specific48 and others preferring the longer probes because of their sensitivity. It is clear, at least, that the probe length should be tailored to the application of the array49, 50. Depending on the manufacturer and the manufacturing protocol, longer probes may or may not cost more than shorter probes, and the manufacturing technique ultimately determines the maximum probe length possible, as most processes suffer from decreasing accuracy and low yield at the limits of probe length.
Good sequence information is critical to the success of a microarray; each probe needs to be as complementary as possible to its target sequence — variations from perfect complementarity can be tolerated, and the tolerance will depend on hybridization and washing conditions. In fact, some groups have tried to quantify acceptable deviation from perfect complementarity 51, 52. It is certainly possible to detect single base changes; SNP chips, built just for this purpose, have been quite successful. Recently, a method for whole yeast genome sequence mapping of sequence polymorphisms using arrays has been outlined53. While it is clear that perfect complementarity is important, nobody has established guidelines for planning and analyzing real-life experiments that will necessarily include imperfect hybridization (due to both polymorphism and error).
Still debated in the world of microarrays is what to do with intra- and inter-platform variability, and whether experiments can be compared across platforms. At the very least, the amount of data generated creates a formidable informatics challenge54. While spotting or in situ synthesis techniques and probe design continue to improve, there seem to be many significant sources of variability within the technology, ranging from the specific batch of manufactured arrays and reagents 47, to feature shapes and binding affinities55, to the particular settings of the scanner, or, perhaps most importantly, the operator or technician processing the samples even within the same laboratory (with the same protocols and reagents). Other sources of variability are the laser detection systems themselves.
There have been a few encouraging studies examining variability among microarrays done on different platforms and in different labs, but questions still remain, as the two largest such investigations 56, 57 apparently used the same technicians in the multiple labs to perform the same experiments on multiple arrays. This overly stringent design leaves a major question open, as in reality, arrays are performed by many different people at many levels of training, and, like any other experimental technique, are subject to the expected variations in protocol that occur when weather, social or family schedules, and lack of sleep interfere.
Therefore, each array must be normalized and arrays in a set must be analyzed together; there are a number of normalization strategies and numerous analytical techniques in use today; an excellent synopsis of statistical techniques needed for microarray analysis can be found58-61.
Finally, as more microarray data is published, more data and experimental design integrity studies are performed, some of which are challenging the validity and reproducibility of microarray-based clinical research. Recent articles describe common mistakes and basic flaws in the experimental design of studies published in peer-reviewed journals, that question the reliability of the outcome62.
Rising to the challenge, biostatisticians are developing sophisticated analysis techniques to control artifacts and bias while extracting as much information as possible from array data. Making sense of the results from a biological or medical perspective is equally as challenging, as the quantity of data necessitates automated analyses, often introducing yet another layer of communication (though rewarded by a new perspective) when a programmer is added to the team.
Density, density, density
An important characteristic of an array is the number of features that it contains. For gene expression arrays, this means more genes covered and/or more features per gene (increasing redundancy and reliability); for tiling arrays, this means denser tiling or tiling across an even more expansive genomic region than before. As array densities climb skyward while prices remain the same, experimentalists uncover ever more creative ways to take advantage of the new technology63, 64. One critical question is how much sample is required per experiment. This number ranges from 5 micrograms to a few nanograms (aiming to reach the single cell picogram level), depending on the platform and the type of experiment. Whole genome amplification techniques help increase sensitivity dramatically, although not without worries that amplification is not perfectly consistent genome wide. For precious clinical samples a denser array that conserves samples and provides a more comprehensive result could enable a scientist to perform a previously unreachable experiment.
Feature topology on an array has also evolved, enabling more features (even of the same size) to be packed into a smaller space. For example, Agilent's chips have gone through an evolution of at least three distinct phases: matrix, orange crate packing, and honeycomb, allowing progressively higher feature density even without reducing feature size (though feature size also shrank over time, as scanner resolution increased).
A new development: multiple-tiling
We have developed a simple method for effectively multiplying the number of features on an oligonucleotide tiling array without changing the cost of the array, the array handling, or the amount of sample needed.
Briefly, the technique involves creating probes that are not simply contiguous pieces of sequence from a given genome but rather consist of two or more disjoint genomic fragments (Figure 2).
Figure 2. Construction of a probe for a double-tiled array.
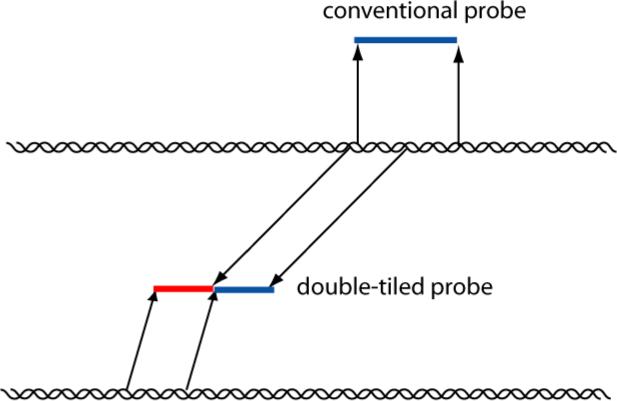
The conventional probe is one contiguous piece of sequence, while the double-tiled probe consists of two discontinuous sequences fused together.
Our first double-tiled array, a 44K 60mer Agilent array, spans the entire yeast genome at approximately 120 bp resolution. Following Lashkari et al.'s13 important expression array experiment, we hybridized RNA from galactose-grown yeast labeled with Cy5 versus RNA from glucose-grown yeast labeled with Cy3. We had surprisingly little trouble with the unusual array configuration, and our results unambiguously confirmed the yeasts’ dependence on different carbon sources, demonstrating that this technique may be a useful stopgap measure as we await the next generations of high-density arrays.
Computational analysis of these data proved challenging but not overwhelming; in fact, our solution was quite simple. If the signal intensity of each feature is a linear combination of the intensities of its subprobes (where we use “subprobes” here to refer to the separate genome-coordinate contiguous pieces of each probe), then we can deconvolute the signal using a matrix of genes × intensities (Wheelan et al 65). Briefly, we calculated a vector of true relative gene expression levels (6606 yeast genes × 1 value per gene) as the solution to the matrix form of the multiple regression equations where each probe appears zero, one, or two times in the matrix of 44K probes × 6606 genes (each probes appears once for each gene that it represents) and the last factor is simply the 44K × 1 matrix of log intensities versus probe IDs. The equations are detailed in Wheelan et al65, but will vary depending on the application.
Our technique can intuitively be extended further into triple- or even quadruple-tiling, as long as the probes are sufficiently long so that the subprobes will hybridize with appropriate specificity. As the push for greater and greater density continues, this technique is a simple way to multiply the density of any oligonucleotide tiling array, bringing us ever closer to the goal of the entire human genome tiled to 1bp resolution desired on a single chip.
Looking into the future
Microarray technology has the potential to vault molecular biologists forward in our exploration, as we can now form queries on much larger scales; our ability is limited now only by our imagination and by feature density on an array. Hoheisel66 describes many past, current, and future uses of microarrays to tickle the imagination. There are also many competing techniques67, and labs should keep these in mind, since they are often cheaper and can perform the same task as a microarray, albeit usually on a smaller scale.
One technique that promises to seriously challenge microarrays is high-throughput sequencing. While not quite mainstream at this point, large-scale sequencing methods can provide similar information to a microarray and may have different biases.
The top four sequencing platforms currently in serious competition are Solexa (Illumina), Helicos, 454 (Roche), and SOLiD (Applied Biosystems). These instruments run in the $500,000 to $1,000,000 range but this estimate may not include very significant costs of providing the required computational infrastructure, which may or may not be present at a site contemplating such a purchase. Importantly, the latter costs consist of both a capital outlay and ongoing informatics support, to an even greater extent than microarrays. Each comes with strengths and weaknesses but all except 454 can provide gigabases of sequence in days for several thousand dollars. The 454 instrument provides significantly less base pairs per dollar but this disadvantage is offset by the distinct advantage of significantly longer read lengths (200−300 bp vs. 10's of base pairs for the other systems) which is extremely helpful for certain applications. As these data have not been extensively analyzed and the full cost per experiment is not clearly defined largely because of the uncertainties associated with the cost of the associated informatics, it is difficult to say which platform actually fits best for any given application, but so far, the field is full of promise.
Sequencing is fundamentally different from microarray-based methods. The main difference is that nearly any piece of sequence isolated from any cell can be detected by sequencing, while this is not at all the case for microarray analysis. With full coverage tiling arrays, this is less of a problem, as such arrays can capture all known sequences. However, any unexpected sequences (SNPs, copy number variants, virus, bacteria) will be missed, and the sequencing will give better information with regard to repeated DNAs unless targeted microarray protocols are developed to deconvolute them. Sequencing will pick up small variations in repeat sequence that can in principle be traced back to individual repeat copies68; these are very difficult to detect on an array.
The statistical challenges inherent in any massive-scale experiment are very important when dealing with microarrays. A microarray experiment is not hundreds of thousands of independent experiments; it is hundreds of thousands of very, very dependent observations. Many statistical techniques are calibrated to assume independence and will give flawed results otherwise. A p-value of 0.05 is technically acceptable but in reality will only lead to overenthusiastic interpretations of random noise, as this allows 1/20 of hundreds of thousands of observations to be false positives; correction for multiple hypothesis testing is essential.
Conclusions
We are still in the “better, bigger, stronger, faster”69 stage of microarray development. Microarrays are unarguably powerful and fascinating, although our enthusiasm must be tempered by the considerable cost involved in using them as part of our molecular biology toolbox. Finally, microarray experiments require a statistical rigor that is unusual in biology, and by involving statisticians at the design stage as well as throughout the study, biologists can optimize their resources and perform fewer and more informative experiments.
References
- 1.Mockler TC, Chan S, Sundaresan A, Chen H, Jacobsen SE, Ecker JR. Genomics. 2005;85:1–15. doi: 10.1016/j.ygeno.2004.10.005. (DOI:S0888−7543(04)00279−4 [pii]; 10.1016/j.ygeno.2004.10.005 [doi]) [DOI] [PubMed] [Google Scholar]
- 2.Whetzel PL, Parkinson H, Causton HC, Fan L, Fostel J, Fragoso G, Game L, Heiskanen M, Morrison N, Rocca-Serra P, Sansone SA, Taylor C, White J, Stoeckert CJ., Jr Bioinformatics. 2006;22:866–873. doi: 10.1093/bioinformatics/btl005. (DOI:btl005 [pii]; 10.1093/bioinformatics/btl005 [doi]) [DOI] [PubMed] [Google Scholar]
- 3.Whetzel PL, Parkinson H, Stoeckert CJ., Jr Methods Enzymol. 2006;411:325–339. doi: 10.1016/S0076-6879(06)11017-4. (DOI:S0076−6879(06)11017−4 [pii]; 10.1016/S0076−6879(06)11017−4 [doi]) [DOI] [PubMed] [Google Scholar]
- 4.Phimister B. Nat. Genet. 1999;21:1–1. doi: 10.1038/11880. [DOI] [PubMed] [Google Scholar]
- 5.Southern EM. J. Mol. Biol. 1975;98:503–517. doi: 10.1016/s0022-2836(75)80083-0. [DOI] [PubMed] [Google Scholar]
- 6.Bains W, Smith GC. J. Theor. Biol. 1988;135:303–307. doi: 10.1016/s0022-5193(88)80246-7. [DOI] [PubMed] [Google Scholar]
- 7.Drmanac R, Labat I, Brukner I, Crkvenjakov R. Genomics. 1989;4:114–128. doi: 10.1016/0888-7543(89)90290-5. [DOI] [PubMed] [Google Scholar]
- 8.Khrapko KR, Lysov Y, Khorlyn AA, Shick VV, Florentiev VL, Mirzabekov AD. FEBS Lett. 1989;256:118–122. doi: 10.1016/0014-5793(89)81730-2. [DOI] [PubMed] [Google Scholar]
- 9.Fodor SP, Read JL, Pirrung MC, Stryer L, Lu AT, Solas D. Science. 1991;251:767–773. doi: 10.1126/science.1990438. [DOI] [PubMed] [Google Scholar]
- 10.Schena M, Shalon D, Davis RW, Brown PO. Science. 1995;270:467–470. doi: 10.1126/science.270.5235.467. [DOI] [PubMed] [Google Scholar]
- 11.DeRisi J, Penland L, Brown PO, Bittner ML, Meltzer PS, Ray M, Chen Y, Su YA, Trent JM. Nat. Genet. 1996;14:457–460. doi: 10.1038/ng1296-457. (DOI:10.1038/ng1296−457 [doi]) [DOI] [PubMed] [Google Scholar]
- 12.Schena M, Shalon D, Heller R, Chai A, Brown PO, Davis RW. Proc. Natl. Acad. Sci. U. S. A. 1996;93:10614–10619. doi: 10.1073/pnas.93.20.10614. [DOI] [PMC free article] [PubMed] [Google Scholar]
- 13.Lashkari DA, DeRisi JL, McCusker JH, Namath AF, Gentile C, Hwang SY, Brown PO, Davis RW. Proc. Natl. Acad. Sci. U. S. A. 1997;94:13057–13062. doi: 10.1073/pnas.94.24.13057. [DOI] [PMC free article] [PubMed] [Google Scholar]
- 14.Iyer VR, Eisen MB, Ross DT, Schuler G, Moore T, Lee JC, Trent JM, Staudt LM, Hudson J, Jr, Boguski MS, Lashkari D, Shalon D, Botstein D, Brown PO. Science. 1999;283:83–87. doi: 10.1126/science.283.5398.83. [DOI] [PubMed] [Google Scholar]
- 15.Ahmed FE. Expert Rev. Mol. Diagn. 2006;6:535–550. doi: 10.1586/14737159.6.4.535. (DOI:10.1586/14737159.6.4.535 [doi]) [DOI] [PubMed] [Google Scholar]
- 16.Fan JB, Gunderson KL, Bibikova M, Yeakley JM, Chen J, Wickham Garcia E, Lebruska LL, Laurent M, Shen R, Barker D. Methods Enzymol. 2006;410:57–73. doi: 10.1016/S0076-6879(06)10003-8. (DOI:S0076−6879(06)10003−8 [pii]; 10.1016/S0076−6879(06)10003−8 [doi]) [DOI] [PubMed] [Google Scholar]
- 17.Moorcroft MJ, Meuleman WR, Latham SG, Nicholls TJ, Egeland RD, Southern EM. Nucleic Acids Res. 2005;33:e75. doi: 10.1093/nar/gni075. (DOI:33/8/e75 [pii]; 10.1093/nar/gni075 [doi]) [DOI] [PMC free article] [PubMed] [Google Scholar]
- 18.Wu P, Hogrebe P, Grainger DW. Biosens. Bioelectron. 2006;21:1252–1263. doi: 10.1016/j.bios.2005.05.010. (DOI:S0956−5663(05)00143−0 [pii]; 10.1016/j.bios.2005.05.010 [doi]) [DOI] [PubMed] [Google Scholar]
- 19.Wolber PK, Collins PJ, Lucas AB, De Witte A, Shannon KW. Methods Enzymol. 2006;410:28–57. doi: 10.1016/S0076-6879(06)10002-6. (DOI:S0076−6879(06)10002−6 [pii]; 10.1016/S0076−6879(06)10002−6 [doi]) [DOI] [PubMed] [Google Scholar]
- 20.Kronick MN. Expert Rev. Proteomics. 2004;1:19–28. doi: 10.1586/14789450.1.1.19. (DOI:10.1586/14789450.1.1.19 [doi]) [DOI] [PubMed] [Google Scholar]
- 21.Duggan DJ, Bittner M, Chen Y, Meltzer P, Trent JM. Nat. Genet. 1999;21:10–14. doi: 10.1038/4434. (DOI:10.1038/4434 [doi]) [DOI] [PubMed] [Google Scholar]
- 22.Marton MJ, DeRisi JL, Bennett HA, Iyer VR, Meyer MR, Roberts CJ, Stoughton R, Burchard J, Slade D, Dai H, Bassett DE, Jr, Hartwell LH, Brown PO, Friend SH. Nat. Med. 1998;4:1293–1301. doi: 10.1038/3282. (DOI:10.1038/3282 [doi]) [DOI] [PubMed] [Google Scholar]
- 23.Pal K. Mod. Drug DIscovery. 2000;3:46–55. [Google Scholar]
- 24.Nuwaysir EF, Bittner M, Trent J, Barrett JC, Afshari CA. Mol. Carcinog. 1999;24:153–159. doi: 10.1002/(sici)1098-2744(199903)24:3<153::aid-mc1>3.0.co;2-p. (DOI:10.1002/(SICI)1098−2744(199903)24:3<153::AID-MC1>3.0.CO;2-P [pii]) [DOI] [PubMed] [Google Scholar]
- 25.Shoemaker DD, Schadt EE, Armour CD, He YD, Garrett-Engele P, McDonagh PD, Loerch PM, Leonardson A, Lum PY, Cavet G, Wu LF, Altschuler SJ, Edwards S, King J, Tsang JS, Schimmack G, Schelter JM, Koch J, Ziman M, Marton MJ, Li B, Cundiff P, Ward T, Castle J, Krolewski M, Meyer MR, Mao M, Burchard J, Kidd MJ, Dai H, Phillips JW, Linsley PS, Stoughton R, Scherer S, Boguski MS. Nature. 2001;409:922–927. doi: 10.1038/35057141. (DOI:10.1038/35057141 [doi]) [DOI] [PubMed] [Google Scholar]
- 26.Shoemaker DD, Lashkari DA, Morris D, Mittmann M, Davis RW. Nat. Genet. 1996;14:450–456. doi: 10.1038/ng1296-450. (DOI:10.1038/ng1296−450 [doi]) [DOI] [PubMed] [Google Scholar]
- 27.Yuan DS, Pan X, Ooi SL, Peyser BD, Spencer FA, Irizarry RA, Boeke JD. Nucleic Acids Res. 2005;33:e103. doi: 10.1093/nar/gni105. (DOI:33/12/e103 [pii]; 10.1093/nar/gni105 [doi]) [DOI] [PMC free article] [PubMed] [Google Scholar]
- 28.Pierce SE, Fung EL, Jaramillo DF, Chu AM, Davis RW, Nislow C, Giaever G. Nat. Methods. 2006;3:601–603. doi: 10.1038/nmeth905. (DOI:nmeth905 [pii]; 10.1038/nmeth905 [doi]) [DOI] [PubMed] [Google Scholar]
- 29.Lenoir T, Giannella E. J. Biomed. Discov. Collab. 2006;1:11. doi: 10.1186/1747-5333-1-11. (DOI:1747−5333−1−11 [pii]; 10.1186/1747−5333−1−11 [doi]) [DOI] [PMC free article] [PubMed] [Google Scholar]
- 30.Johnson JM, Edwards S, Shoemaker D, Schadt EE. Trends Genet. 2005;21:93–102. doi: 10.1016/j.tig.2004.12.009. (DOI:S0168−9525(04)00337−3 [pii]; 10.1016/j.tig.2004.12.009 [doi]) [DOI] [PubMed] [Google Scholar]
- 31.Bertone P, Stolc V, Royce TE, Rozowsky JS, Urban AE, Zhu X, Rinn JL, Tongprasit W, Samanta M, Weissman S, Gerstein M, Snyder M. Science. 2004;306:2242–2246. doi: 10.1126/science.1103388. (DOI:1103388 [pii]; 10.1126/science.1103388 [doi]) [DOI] [PubMed] [Google Scholar]
- 32.Bertone P, Gerstein M, Snyder M. Chromosome Res. 2005;13:259–274. doi: 10.1007/s10577-005-2165-0. (DOI:10.1007/s10577−005−2165−0 [doi]) [DOI] [PubMed] [Google Scholar]
- 33.Dutt A, Beroukhim R. Curr. Opin. Oncol. 2007;19:43–49. doi: 10.1097/CCO.0b013e328011a8c1. (DOI:10.1097/CCO.0b013e328011a8c1 [doi]; 00001622−200701000−00009 [pii]) [DOI] [PubMed] [Google Scholar]
- 34.Bulyk ML. Curr. Opin. Biotechnol. 2006;17:422–430. doi: 10.1016/j.copbio.2006.06.015. (DOI:S0958−1669(06)00099−1 [pii]; 10.1016/j.copbio.2006.06.015 [doi]) [DOI] [PMC free article] [PubMed] [Google Scholar]
- 35.Berger MF, Philippakis AA, Qureshi AM, He FS, Estep PW, 3rd, Bulyk ML. Nat. Biotechnol. 2006;24:1429–1435. doi: 10.1038/nbt1246. (DOI:10.1038/nbt1246) [DOI] [PMC free article] [PubMed] [Google Scholar]
- 36.Bulyk ML. Methods Enzymol. 2006;410:279–299. doi: 10.1016/S0076-6879(06)10013-0. (DOI:10.1016/S0076−6879(06)10013−0) [DOI] [PMC free article] [PubMed] [Google Scholar]
- 37.Ordway JM, Bedell JA, Citek RW, Nunberg A, Garrido A, Kendall R, Stevens JR, Cao D, Doerge RW, Korshunova Y, Holemon H, McPherson JD, Lakey N, Leon J, Martienssen RA, Jeddeloh JA. Carcinogenesis. 2006;27:2409–2423. doi: 10.1093/carcin/bgl161. (DOI:bgl161 [pii]; 10.1093/carcin/bgl161 [doi]) [DOI] [PubMed] [Google Scholar]
- 38.Davison TS, Johnson CD, Andruss BF. Methods Enzymol. 2006;411:14–34. doi: 10.1016/S0076-6879(06)11002-2. (DOI:S0076−6879(06)11002−2 [pii]; 10.1016/S0076−6879(06)11002−2 [doi]) [DOI] [PubMed] [Google Scholar]
- 39.Gruel G, Lucchesi C, Pawlik A, Frouin V, Alibert O, Kortulewski T, Zarour A, Jacquelin B, Gidrol X, Tronik-Le Roux D. Radiat. Res. 2006;166:746–756. doi: 10.1667/RR0260.1. (DOI:RR0260 [pii]; 10.1667/RR0260.1 [doi]) [DOI] [PubMed] [Google Scholar]
- 40.Wheelan SJ, Scheifele LZ, Martinez-Murillo F, Irizarry RA, Boeke JD. Proc. Natl. Acad. Sci. U. S. A. 2006;103:17632–17637. doi: 10.1073/pnas.0605450103. (DOI:0605450103 [pii]; 10.1073/pnas.0605450103 [doi]) [DOI] [PMC free article] [PubMed] [Google Scholar]
- 41.Brazma A, Hingamp P, Quackenbush J, Sherlock G, Spellman P, Stoeckert C, Aach J, Ansorge W, Ball CA, Causton HC, Gaasterland T, Glenisson P, Holstege FC, Kim IF, Markowitz V, Matese JC, Parkinson H, Robinson A, Sarkans U, Schulze-Kremer S, Stewart J, Taylor R, Vilo J, Vingron M. Nat. Genet. 2001;29:365–371. doi: 10.1038/ng1201-365. (DOI:10.1038/ng1201−365 [doi]; ng1201−365 [pii]) [DOI] [PubMed] [Google Scholar]
- 42.Barrett T, Edgar R. Methods Enzymol. 2006;411:352–369. doi: 10.1016/S0076-6879(06)11019-8. (DOI:S0076−6879(06)11019−8 [pii]; 10.1016/S0076−6879(06)11019−8 [doi]) [DOI] [PMC free article] [PubMed] [Google Scholar]
- 43.Barrett T, Troup DB, Wilhite SE, Ledoux P, Rudnev D, Evangelista C, Kim IF, Soboleva A, Tomashevsky M, Edgar R. Nucleic Acids Res. 2007;35:D760–5. doi: 10.1093/nar/gkl887. (DOI:gkl887 [pii]; 10.1093/nar/gkl887 [doi]) [DOI] [PMC free article] [PubMed] [Google Scholar]
- 44.Parkinson H, Kapushesky M, Shojatalab M, Abeygunawardena N, Coulson R, Farne A, Holloway E, Kolesnykov N, Lilja P, Lukk M, Mani R, Rayner T, Sharma A, William E, Sarkans U, Brazma A. Nucleic Acids Res. 2007;35:D747–50. doi: 10.1093/nar/gkl995. (DOI:gkl995 [pii]; 10.1093/nar/gkl995 [doi]) [DOI] [PMC free article] [PubMed] [Google Scholar]
- 45.Lu Y, Lemon W, Liu PY, Yi Y, Morrison C, Yang P, Sun Z, Szoke J, Gerald WL, Watson M, Govindan R, You M. PLoS Med. 2006;3:e467. doi: 10.1371/journal.pmed.0030467. (DOI:06-PLME-RA-0381R2 [pii]; 10.1371/journal.pmed.0030467 [doi]) [DOI] [PMC free article] [PubMed] [Google Scholar]
- 46.Irizarry RA, Warren D, Spencer F, Kim IF, Biswal S, Frank BC, Gabrielson E, Garcia JG, Geoghegan J, Germino G, Griffin C, Hilmer SC, Hoffman E, Jedlicka AE, Kawasaki E, Martinez-Murillo F, Morsberger L, Lee H, Petersen D, Quackenbush J, Scott A, Wilson M, Yang Y, Ye SQ, Yu W. Nat. Methods. 2005;2:345–350. doi: 10.1038/nmeth756. (DOI:nmeth756 [pii]; 10.1038/nmeth756 [doi]) [DOI] [PubMed] [Google Scholar]
- 47.Kohane IS, Kho AT, Butte AJ. Microarrays for an Integrative Genomics. The MIT Press; Cambridge, Massachusetts; London, England: 2003. [Google Scholar]
- 48.Suzuki S, Ono N, Furusawa C, Kashiwagi A, Yomo T. BMC Genomics. 2007;8:373. doi: 10.1186/1471-2164-8-373. (DOI:10.1186/1471−2164−8−373) [DOI] [PMC free article] [PubMed] [Google Scholar]
- 49.Tomiuk S, Hofmann K. Brief Bioinform. 2001;2:329–340. doi: 10.1093/bib/2.4.329. [DOI] [PubMed] [Google Scholar]
- 50.He Z, Wu L, Li X, Fields MW, Zhou J. Appl. Environ. Microbiol. 2005;71:3753–3760. doi: 10.1128/AEM.71.7.3753-3760.2005. (DOI:71/7/3753 [pii]; 10.1128/AEM.71.7.3753−3760.2005 [doi]) [DOI] [PMC free article] [PubMed] [Google Scholar]
- 51.Chou CC, Chen CH, Lee TT, Peck K. Nucleic Acids Res. 2004;32:e99. doi: 10.1093/nar/gnh099. (DOI:10.1093/nar/gnh099 [doi]; 32/12/e99 [pii]) [DOI] [PMC free article] [PubMed] [Google Scholar]
- 52.Mecham BH, Klus GT, Strovel J, Augustus M, Byrne D, Bozso P, Wetmore DZ, Mariani TJ, Kohane IS, Szallasi Z. Nucleic Acids Res. 2004;32:e74. doi: 10.1093/nar/gnh071. (DOI:10.1093/nar/gnh071 [doi]; 32/9/e74 [pii]) [DOI] [PMC free article] [PubMed] [Google Scholar]
- 53.Gresham D, Ruderfer DM, Pratt SC, Schacherer J, Dunham MJ, Botstein D, Kruglyak L. Science. 2006;311:1932–1936. doi: 10.1126/science.1123726. (DOI:1123726 [pii]; 10.1126/science.1123726 [doi]) [DOI] [PubMed] [Google Scholar]
- 54.Royce TE, Rozowsky JS, Bertone P, Samanta M, Stolc V, Weissman S, Snyder M, Gerstein M. Trends Genet. 2005;21:466–475. doi: 10.1016/j.tig.2005.06.007. (DOI:S0168−9525(05)00167−8 [pii]; 10.1016/j.tig.2005.06.007 [doi]) [DOI] [PMC free article] [PubMed] [Google Scholar]
- 55.Ahmed FE. Expert Rev. Mol. Diagn. 2006;6:703–715. doi: 10.1586/14737159.6.5.703. (DOI:10.1586/14737159.6.5.703 [doi]) [DOI] [PubMed] [Google Scholar]
- 56.Baker SC, Bauer SR, Beyer RP, Brenton JD, Bromley B, Burrill J, Causton H, Conley MP, Elespuru R, Fero M, Foy C, Fuscoe J, Gao X, Gerhold DL, Gilles P, Goodsaid F, Guo X, Hackett J, Hockett RD, Ikonomi P, Irizarry RA, Kawasaki ES, Kaysser-Kranich T, Kerr K, Kiser G, Koch WH, Lee KY, Liu C, Liu ZL, Lucas A, Manohar CF, Miyada G, Modrusan Z, Parkes H, Puri RK, Reid L, Ryder TB, Salit M, Samaha RR, Scherf U, Sendera TJ, Setterquist RA, Shi L, Shippy R, Soriano JV, Wagar EA, Warrington JA, Williams M, Wilmer F, Wilson M, Wolber PK, Wu X, Zadro R, External RNA Controls Consortium Nat. Methods. 2005;2:731–734. doi: 10.1038/nmeth1005-731. (DOI:10.1038/nmeth1005−731) [DOI] [PubMed] [Google Scholar]
- 57.MAQC Consortium. Shi L, Reid LH, Jones WD, Shippy R, Warrington JA, Baker SC, Collins PJ, de Longueville F, Kawasaki ES, Lee KY, Luo Y, Sun YA, Willey JC, Setterquist RA, Fischer GM, Tong W, Dragan YP, Dix DJ, Frueh FW, Goodsaid FM, Herman D, Jensen RV, Johnson CD, Lobenhofer EK, Puri RK, Schrf U, Thierry-Mieg J, Wang C, Wilson M, Wolber PK, Zhang L, Amur S, Bao W, Barbacioru CC, Lucas AB, Bertholet V, Boysen C, Bromley B, Brown D, Brunner A, Canales R, Cao XM, Cebula TA, Chen JJ, Cheng J, Chu TM, Chudin E, Corson J, Corton JC, Croner LJ, Davies C, Davison TS, Delenstarr G, Deng X, Dorris D, Eklund AC, Fan XH, Fang H, Fulmer-Smentek S, Fuscoe JC, Gallagher K, Ge W, Guo L, Guo X, Hager J, Haje PK, Han J, Han T, Harbottle HC, Harris SC, Hatchwell E, Hauser CA, Hester S, Hong H, Hurban P, Jackson SA, Ji H, Knight CR, Kuo WP, LeClerc JE, Levy S, Li QZ, Liu C, Liu Y, Lombardi MJ, Ma Y, Magnuson SR, Maqsodi B, McDaniel T, Mei N, Myklebost O, Ning B, Novoradovskaya N, Orr MS, Osborn TW, Papallo A, Patterson TA, Perkins RG, Peters EH, Peterson R, Philips KL, Pine PS, Pusztai L, Qian F, Ren H, Rosen M, Rosenzweig BA, Samaha RR, Schena M, Schroth GP, Shchegrova S, Smith DD, Staedtler F, Su Z, Sun H, Szallasi Z, Tezak Z, Thierry-Mieg D, Thompson KL, Tikhonova I, Turpaz Y, Vallanat B, Van C, Walker SJ, Wang SJ, Wang Y, Wolfinger R, Wong A, Wu J, Xiao C, Xie Q, Xu J, Yang W, Zhang L, Zhong S, Zong Y, Slikker W., Jr Nat. Biotechnol. 2006;24:1151–1161. doi: 10.1038/nbt1239. (DOI:10.1038/nbt1239) [DOI] [PMC free article] [PubMed] [Google Scholar]
- 58.Jaluria P, Konstantopoulos K, Betenbaugh M, Shiloach J. Microb. Cell. Fact. 2007;6:4. doi: 10.1186/1475-2859-6-4. (DOI:1475−2859−6−4 [pii]; 10.1186/1475−2859−6−4 [doi]) [DOI] [PMC free article] [PubMed] [Google Scholar]
- 59.Ehrenreich A. Appl. Microbiol. Biotechnol. 2006;73:255–273. doi: 10.1007/s00253-006-0584-2. (DOI:10.1007/s00253−006−0584−2 [doi]) [DOI] [PubMed] [Google Scholar]
- 60.Nuber UA. in BIOS Advanced Methods. 1st edn. Vol. 1. Taylor & Francis, Taylor & Francis Group; NY, NY: 2005. p. 295. [Google Scholar]
- 61.Allison DB, Cui X, Page GP, Sabripour M. Nat. Rev. Genet. 2006;7:55–65. doi: 10.1038/nrg1749. (DOI:nrg1749 [pii]; 10.1038/nrg1749 [doi]) [DOI] [PubMed] [Google Scholar]
- 62.Dupuy A, Simon RM. J. Natl. Cancer Inst. 2007;99:147–157. doi: 10.1093/jnci/djk018. (DOI:99/2/147 [pii]; 10.1093/jnci/djk018 [doi]) [DOI] [PubMed] [Google Scholar]
- 63.Aarts M, Dannenberg H, deLeeuw RJ, van Nederveen FH, Verhofstad AA, Lenders JW, Dinjens WN, Speel EJ, Lam WL, de Krijger RR. Genes Chromosomes Cancer. 2006;45:83–93. doi: 10.1002/gcc.20268. (DOI:10.1002/gcc.20268 [doi]) [DOI] [PubMed] [Google Scholar]
- 64.Ming JE, Geiger E, James AC, Ciprero KL, Nimmakayalu M, Zhang Y, Huang A, Vaddi M, Rappaport E, Zackai EH, Shaikh TH. Hum. Mutat. 2006;27:467–473. (DOI:10.1002/humu.20322 [doi]) [Google Scholar]
- 65.Wheelan SJ, Martinez-Murillo F, Irizarry RA, Boeke JD. Nat. Methods. 2006;3:903–907. doi: 10.1038/nmeth951. (DOI:nmeth951 [pii]; 10.1038/nmeth951 [doi]) [DOI] [PubMed] [Google Scholar]
- 66.Hoheisel JD. Nat. Rev. Genet. 2006;7:200–210. doi: 10.1038/nrg1809. (DOI:nrg1809 [pii]; 10.1038/nrg1809 [doi]) [DOI] [PubMed] [Google Scholar]
- 67.Bonetta L. Nat. Methods. 2006;3:401–408. (DOI:10.1038/nmeth0506−401) [Google Scholar]
- 68.Brennecke J, Aravin AA, Stark A, Dus M, Kellis M, Sachidanandam R, Hannon GJ. Cell. 2007;128:1089–1103. doi: 10.1016/j.cell.2007.01.043. (DOI:10.1016/j.cell.2007.01.043) [DOI] [PubMed] [Google Scholar]
- 69.Moxy Früvous 1998. Compact Disc (DOI:B000002IXP)