

Abstract
Changes in brain activity over time were evaluated in a group of older adults in the Baltimore Longitudinal Study of Aging who maintained good physical and cognitive health. Participants underwent PET scans during rest and delayed verbal and figural recognition memory performance at Year 1 baseline and at Year 9. While memory performance remained stable over the 8 years, longitudinal changes in regional cerebral blood flow were observed within each scan condition. Further analyses revealed distinctive patterns of change related specifically to verbal or figural recognition, as well as longitudinal changes common to all scan conditions. These findings demonstrate that the older brain undergoes functional reorganization with increasing age in healthy, cognitively stable individuals. In view of the stable memory performance, the task-dependent results suggest that age-related changes in brain activity help maintain cognitive function with advancing age.
Keywords: positron emission tomography, functional imaging, neuroimaging, brain function, age, aging, verbal, spatial, memory
INTRODUCTION
Many studies have examined differences in brain function between young and old individuals. Age-related differences in activation patterns have been described during language tasks [5,10,24], face and object recognition tasks [20,22], and tasks that require visuospatial skills [20,48,59]. While these studies find age-related differences associated with specific task demands, they also suggest that non-specific differences in brain activity commonly occur with age. For example, old and young individuals may activate similar regions during task performance, yet the magnitude and/or spatial extent of the activity is often smaller in older adults [2,11,21]. Additionally, older individuals often show areas of increased activation outside of the regions typically associated with a particular task in younger individuals [44,59,67]. According to the functional compensation theory [9,22,42,59], the decrease in magnitude and size of activation in older adults is thought to result from decreases in cortical processing efficiency with age (see[18,60]). The additional regions of activity seen in older adults are thought to reflect reorganization of function (see [9,51]). This cortical reorganization presumably compensates for declining function in areas subserving task-related performance at younger ages and allows for consistent performance levels over time.
While it is known that many changes occur in the brain as people progress from young adulthood into their 60’s, we do not fully understand the longitudinal changes in brain function that occur in normal older individuals as they continue to age. To address this issue, we present data from older participants who are enrolled in the Baltimore Longitudinal Study of Aging (BLSA) neuroimaging substudy and who remain free of cognitive impairment after an 8 year follow-up. These individuals undergo annual positron emission tomography (PET) scans to assess brain function during three different conditions: rest, verbal (word) recognition and figural (abstract design) recognition memory. These conditions allow for the assessment of resting and modality-specific longitudinal changes as well as the characterization of generalized or common changes in brain function with advancing age.
These task conditions also allow us to test hypotheses regarding the relationship between longitudinal measures of task performance and longitudinal changes in brain function. With regard to behavioral performance, one of two scenarios can occur with increasing age: an age-related decline in task performance will be seen over time or task performance levels will remain relatively stable with advancing age. In the case of declining task performance, one could predict that decreasing brain function would lead to the decreasing performance levels. In the case of stable task performance, two possibilities emerge. First, stable task performance could be supported by stable brain function. Alternatively, stable performance could be maintained by changing brain function if the changes represent a form of compensatory reorganization of function.
To determine patterns of longitudinal change in memory performance and brain activity over time in normal aging, we focus on behavioral and physiological changes between Year 1 baseline and Year 9 assessments of our participants. First, we demonstrate that recognition memory performance remains stable in this group of individuals who maintain good physical and cognitive health over the 8-year follow-up period. Next, we investigate age-related changes in regional brain activity to determine whether stable memory performance is supported by stable patterns of brain activity or by functional reorganization. Based on prior studies comparing brain function in young and old adults and on structural [28,56] and pathological [53,69] changes that occur with advanced age, it is likely that the older brain continues to change in late life. We expect that alterations in regional cerebral blood flow (rCBF) will be observed over time in our older sample and that resting, as well as modality-specific changes related to verbal and figural recognition processing, will occur as a function of increasing age.
METHODS
Subjects
PET data from older participants in the neuroimaging substudy [57] of the BLSA [71] were used in this analysis (Table 1). Twenty five participants from the BLSA pool met the health and inclusion criteria for this analysis (10 female, 15 male; mean baseline age = 67.8±6.6 years range). All individuals remained in good cognitive and physical health through the follow-up period with no history of central nervous system disorders, major psychiatric disorders including depression, or severe cardiovascular disease. All participants also completed neuropsychological evaluations through Year 9 and were deemed cognitively normal by consensus diagnosis and Clinical Dementia Rating Scale assessments through the Year 9 evaluation (see [31] for detailed procedures). Thus, these participants were selected for maintenance of good physical and cognitive health and represent a subset of the larger BLSA neuroimaging sample.
Table 1.
Participant Demographics (Mean (SD))
| Subjects | Mean Age Year 1 | Right Handed | Education (years) | MMSE Year 1 | MMSE Year 8.5 |
|---|---|---|---|---|---|
| 25 | 67.8 (6.6) | 23 | 17.3 (2.3) | 29.2 (0.6) | 29.1 (0.8) |
This study was approved by the local Institutional Review Board. All participants provided written informed consent prior to each assessment.
Neuropsychological Testing
During each neuroimaging visit, participants completed a battery of 12 neuropsychological tests evaluating six cognitive domains. Memory was assessed using the California Verbal Learning Test (CVLT) and Benton Visual Retention Test (BVRT). Word knowledge and verbal ability were measured using Primary Mental Abilities Vocabulary (PMA). Verbal fluency was assessed by Letter (i.e. FAS) and Category fluency tests. Attention and working memory were measured by the Digit Span subtests of the Wechsler Adult Intelligence Scale-Revised and the Trail Making Test. Digits Backward, Trails B, and Verbal Fluency (categories and letters) assessed executive function. The Card Rotations Test assessed visuospatial function. Data from evaluations at Years 1 and 9 were used to examine changes in performance over time.
PET Scanning Conditions
Participants underwent PET scanning sessions at baseline (Year 1) and at annual follow-up intervals to Year 9. During each imaging session, three PET scans were performed: rest, verbal recognition, and figural recognition. During rest, participants were instructed to keep their eyes open and focused on a computer screen covered by a black cloth. During the recognition tasks, the participants were asked to identify stimuli that had been presented at the beginning of the session. In an attempt to reduce practice effects, two alternate versions of the tasks were administered over time: one version was given on odd years and the other was given on even years. The target stimuli presented in each version remained the same for even or odd years. The order of task conditions was counter-balanced across individuals, but remained constant within an individual across years.
Approximately thirty minutes before the first PET scan, participants were shown a list of 20 target words for the verbal task and 20 target figures for the figural task on a computer screen (see [58] for detailed description). They were instructed to silently examine each item and try to remember it for later. Nouns for the verbal task were selected for low imagery and matched across concreteness, meaningfulness, frequency, and number of syllables [49]. Designs for the figural task were selected for low verbalizability and matched across uniqueness and range of white space [17].
For the verbal and figural recognition tasks, approximately 40 test items were shown during the PET image acquisition interval. Twenty of these were novel distractor items intermixed with the original 20 target items. Participants were asked to indicate whether or not they had seen each item before by pressing buttons in their right or left hands. Accuracy and reaction times were recorded throughout both recognition tasks. Examples of the tasks are shown in Figure 1.
Figure 1.
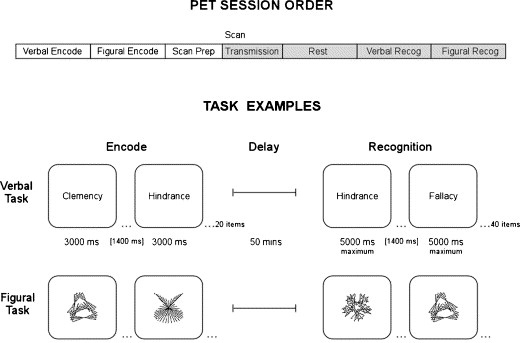
PET Session Order illustrates the progression of tasks during each scanning session. The order of verbal and figural task administration is counterbalanced across subjects. Task examples are shown for both recognition conditions. For both verbal and figural tasks, subjects are shown a list of stimuli to remember prior to scanning. During the recognition phase, the subject must indicate whether the test stimulus was one of the stimuli shown before. This phase is self paced, with the next stimulus appearing after the subject makes a response or after a maximum display time of 5000 ms.
PET Scanning Parameters
PET measures of regional cerebral blood flow (rCBF) were obtained using [15O]water. For each scan, 75 mCi of [15O] water were injected as a bolus. Scans were performed on a GE 4096+ scanner, which provides 15 slices of 6.5 mm thickness. Images were acquired for 60 seconds from the time the total radioactivity counts in brain reached threshold level. Attenuation correction was performed using a transmission scan acquired prior to the emission scans.
Data Analysis
For each subject, the PET scans were realigned and spatially normalized into standard stereotactic space and smoothed to a full width at half maximum of 12, 12, and 12 mm in the x, y, and z planes. To control for variability in global flow, rCBF values at each voxel were ratio adjusted to the mean global flow of 50 ml/100g/min for each image. The image data were analyzed using Statistical Parametric Mapping (SPM2; Wellcome Department of Cognitive Neurology, London, England), where voxel by voxel comparisons determined significant changes in rCBF over time (p ≤ 0.001). Significant effects for each contrast were based on the magnitude (Z = 3.09; p ≤ 0.001) and spatial extent (> 100 mm3) of activation. All contrasts were adjusted for baseline age at Year 1. The results for all contrasts are presented in Talairach space [72]. The coordinates of the local maxima for each contrast were converted from MNI space to Talairach space using the following algorithm: X′=0.88X−0.8; Y′=0.97Y−3.32; Z′=0.05Y+0.88Z−0.44.
Longitudinal changes in rCBF were assessed by comparing Year 1 to Year 9 for each scan condition (rest, verbal, figural). The resultant contrast images from the rest, verbal and figural conditions were also compared to one another to assess longitudinal changes common across all conditions and those specific to verbal processing relative to rest and figural conditions, and those specific to figural processing relative to rest and verbal conditions. The similarities between contrast images reported in the Results section were generated using a conjunction analysis to assess regions of longitudinal change common to all images (threshold=p≤0.05). The differences in longitudinal change between contrast images were generated by comparing one contrast image with the other(s) (threshold=p≤0.05) to determine regions of change limited to the image of interest (e.g. verbal-specific increases = verbal increases compared against both rest and figural increases). For both types of analyses, thresholds for each contrast image remained at p≤ 0.001 magnitude and >100 mm3 spatial extent.
Correlational analyses were also performed to examine the relationship between changes in rCBF and individual changes in behavioral performance on the respective PET tasks from Year 1 to 9. For each subject, Year 1 and 9 images were thresholded and scaled to adjust for global flow, then subtracted from one another to create a difference image reflecting the change in rCBF over time. This process was performed for both for verbal and figural conditions. The verbal and figural difference images were correlated with changes in the respective sensitivity score and reaction time for each condition (p≤ 0.001 magnitude; >100 mm3 spatial extent).
RESULTS
Neuropsychological Testing
Performance on the neuropsychological tests was compared across years (1 and 9) using repeated measures MANOVA with sex as a grouping factor. There were no overall changes in performance levels over time on any task and no significant effects of sex or sex × time interactions in this group of participants. Performance levels are shown in Table 2.
Table 2.
Neuropsychological Performance (Mean (SD))
| Domain | Test | Measure | Year 1 | Year 9 |
|---|---|---|---|---|
| Memory | CVLT | total correct 5 trials | 59.8 (8.6) | 56.4 (13.9) |
| BVRT | total errors | 3.7 (2.6) | 4.2 (3.0) | |
| Verbal | Letters | total correct | 14.9 (3.5) | 15.0 (3.9) |
| Fluency | Categories | total correct | 16.7 (2.6) | 16.4 (2.9) |
| Attention & | Digits Forward | total correct | 8.4 (2.3) | 9.2 (2.4) |
| Working | Digits Back | total correct | 8.0 (1.9) | 8.0 (1.7) |
| Memory | Trails A | time in seconds | 31.0 (8.6) | 28.7 (6.7) |
| Trails B | time in seconds | 69.1 (18.1) | 72.3 (22.9) | |
| Visuospatial | Card Rotation | correct-incorrect | 91.2 (29.4) | 95.1 (40.2) |
PET Task Performance
Task accuracy, measured by sensitivity score (i.e. hits adjusted for false positives), and reaction times were compared across years (1 and 9) and task condition (verbal and figural) using repeated measures MANOVA, with sex as a grouping factor. There were no overall changes in sensitivity measures across time, no effects of sex or task condition on performance levels (Table 3), and no significant interactions for sensitivity measures. For reaction time, there was a significant decrease from Year 1 to 9 (df=1, 20, F=6.05, p≤0.05). The decrease over time reached significance for figural (post hoc paired t-test df=21 t=2.41 p≤0.05) but not verbal reaction times alone. Overall, reaction times were faster on the verbal than figural task (df=1, 20, F=26.33, p≤0.001).
Table 3.
Task Performance (Mean(SD))
| Year 1 | Year 9 | |||
|---|---|---|---|---|
| Task | Sensitivity | Reaction Time (ms) | Sensitivity | Reaction Time (ms) |
| Verbal Mean | 0.46(0.16) | 1309.7(328.4) | 0.44(0.18) | 1215.2(393.6) |
| Males | 0.49(0.14) | 1296.2(365.1) | 0.44(0.20) | 1187.8(342.6) |
| Females | 0.41(0.19) | 1328.6(286.9) | 0.45(0.15) | 1253.6(472.9) |
| Figural Mean | 0.49(0.19) | 1566.5(309.1)* | 0.42(0.19) | 1356.4(319.5)* |
| Males | 0.47(0.20) | 1500.5(262.1) | 0.39(0.22) | 1351.8(304.3) |
| Females | 0.52(0.20) | 1659.0(358.7) | 0.45(0.13) | 1362.3(355.0) |
p≤ 0.05
Brain Activation
The PET data were analyzed in two steps. First, changes in regional cerebral blood flow (rCBF) over time were determined by comparing Year 1 to Year 9 within each of the scan conditions (rest, verbal, figural). Next, to determine modality-specific changes over time, the results from the first step were compared to one another to generate images representing generalized changes common across all conditions, changes specific to the verbal condition relative to rest and figural conditions, and changes specific to the figural condition relative to rest and verbal conditions.
Within-Condition Changes
The results from this section are presented in Table 4 and Figure 2 (top row).
Table 4.
Local maxima within areas of significant rCBF change from Year 1 to Year 9 for each scan condition. Stereotaxic coordinates are listed in Talairach space, Brodmann areas are indicated in parentheses.
| Within-Condition Activity Changes | Coordinate | ||||
|---|---|---|---|---|---|
| Region | Side | x | y | z | T-value |
| Rest Decreases | |||||
| Sup Frontal Gyrus (10) | R | 36 | 60 | 18 | 4.55 |
| Mid Frontal Gyrus (10) | R | 30 | 66 | 8 | 4.03 |
| Inf Frontal Gyrus (47) | L | −40 | 18 | −18 | 6.77 |
| Mid Cingulate Gyrus (23) | R | 4 | −20 | 32 | 7.05 |
| Sup Temporal Gyrus (38) | R | 52 | 20 | −14 | 4.30 |
| Mid Temporal Gyrus (39) | L | −38 | −58 | 14 | 3.72 |
| Lingual Gyrus (18) | R | 6 | −82 | −6 | 5.23 |
| Inf Occipital Gyrus (18) | B | 0 | −98 | −4 | 5.18 |
| Cuneus (18) | L | −8 | −106 | 2 | 4.93 |
| Thalamus | R | 2 | −14 | 12 | 10.03 |
| Thalamus | L | −6 | −16 | 14 | 8.41 |
| Rest Increases | |||||
| Sup Frontal Gyrus (10) | L | −24 | 48 | −6 | 5.87 |
| Mid Frontal Gyrus (10) | R | 24 | 48 | −8 | 6.94 |
| Mid Frontal Gyrus (46) | L | −32 | 38 | 16 | 3.19 |
| Inf Frontal Gyrus (46) | R | 40 | 36 | 10 | 4.80 |
| Ant Cingulate Gyrus (32) | R | 20 | 44 | 8 | 5.66 |
| Mid Temporal Gyrus (21) | R | 58 | −54 | 4 | 4.05 |
| Hippocampus | L | −32 | −12 | −14 | 3.10 |
| Inf Parietal Lobe (40) | R | 52 | 28 | 26 | 4.98 |
| Mid Occipital Gyrus (19) | R | 46 | −68 | 8 | 4.65 |
| Cerebellum | R | 24 | −44 | −26 | 4.03 |
| Thalamus | R | 26 | −20 | 2 | 4.67 |
| Putamen | L | −24 | −4 | −4 | 4.04 |
| Verbal Decreases | |||||
| Sup Frontal Gyrus (9) | R | 26 | 52 | 34 | 5.61 |
| Inf Frontal Gyrus (44) | R | 54 | 48 | 2 | 3.41 |
| Inf Frontal Gyrus (44) | L | −54 | 20 | 26 | 4.13 |
| Mid Cingulate Gyrus (24) | B | 0 | −10 | 32 | 6.65 |
| Sup Temporal Gyrus (38) | R | 48 | −6 | −6 | 4.23 |
| Sup Temporal Gyrus (38) | L | −40 | 18 | −20 | −6.58 |
| Sup Temporal Gyrus (42) | L | −66 | −28 | 14 | 3.50 |
| Mid Temporal Gyrus (21) | L | −70 | −42 | 2 | 5.39 |
| Insula | R | 46 | 16 | −14 | 5.78 |
| Thalamus | L | −2 | −20 | 12 | 9.30 |
| Caudate | R | 10 | 16 | 2 | 6.74 |
| Verbal Increases | |||||
| Sup Frontal Gyrus (10) | L | −22 | 50 | 2 | 6.38 |
| Sup Frontal Gyrus (11) | R | 16 | 52 | 12 | 5.55 |
| Mid Frontal Gyrus (10) | R | 32 | 46 | 0 | 6.25 |
| Precentral Gyrus (6) | R | 62 | 0 | 20 | 3.90 |
| Postcentral Gyrus (2) | R | 54 | −20 | 30 | 3.09 |
| Sup Temporal Gyrus (22) | L | −52 | −48 | 12 | 3.26 |
| Inf Temporal Gyrus (37) | L | −46 | 50 | 6 | 3.36 |
| Insula | R | 34 | 4 | 20 | 4.02 |
| Insula | L | −28 | −2 | 16 | 3.28 |
| Hippocampus | L | −26 | −26 | −6 | 3.43 |
| Inf Parietal Lobe (40) | L | −40 | −22 | 28 | 3.87 |
| Mid Occipital Gyrus (19) | R | 44 | −64 | −6 | 3.73 |
| Cerebellum | R | 20 | −64 | −20 | 3.80 |
| Globus Pallidus | L | −16 | −10 | 0 | 3.12 |
| Putamen | R | 30 | −24 | 2 | 4.61 |
| Figural Decreases | |||||
| Sup Frontal Gyrus (10) | R | 32 | 66 | 0 | 4.18 |
| Mid Frontal Gyrus (10) | R | 24 | 68 | 8 | 3.61 |
| Med Frontal Gyrus (10) | R | 2 | 56 | 12 | 5.63 |
| Mid Cingulate Gyrus (24) | B | 0 | −10 | 32 | 7.31 |
| Sup Temporal Gyrus (38) | R | 46 | 0 | −10 | 5.15 |
| Sup Temporal Gyrus (38) | L | −38 | 16 | 14 | 5.61 |
| Mid Temporal Gyrus (21) | L | −68 | −48 | 4 | 3.66 |
| Insula | L | −68 | −38 | 18 | 3.27 |
| Thalamus | R | 2 | −16 | 12 | 8.35 |
| Caudate | R | 10 | 16 | 2 | 7.58 |
| Figural Increases | |||||
| Sup Frontal Gyrus (10) | R | 18 | 48 | −10 | 5.48 |
| Sup Frontal Gyrus (10) | L | −18 | 50 | 4 | 7.04 |
| Mid Frontal Gyrus (10) | R | 28 | 44 | 4 | 6.22 |
| Mid Frontal Gyrus (10) | L | −36 | 36 | 14 | 5.07 |
| Inf Frontal Gyrus (46) | R | 44 | 38 | 10 | 3.93 |
| Precentral Gyrus (6) | L | −48 | −4 | 22 | 4.07 |
| Mid Temporal Gyrus (21) | L | −50 | −46 | −8 | 4.03 |
| Insula | R | 24 | 16 | −8 | 3.49 |
| Hippocampus | L | −28 | −28 | −4 | 3.59 |
| Inf Parietal Lobe (40) | L | −40 | −28 | 26 | 3.83 |
| Mid Occipital Gyrus (19) | R | 42 | −68 | −8 | 3.10 |
| Cuneus (18) | R | 6 | −78 | 18 | 3.80 |
| Brainstem | L | −22 | −24 | 0 | 3.93 |
| Globus Pallidus | L | −18 | −10 | 0 | 3.58 |
| Putamen | R | 28 | 8 | 10 | 3.44 |
| Thalamus | R | 22 | −18 | 2 | 3.06 |
| Cerebellum | R | 24 | −64 | −20 | 3.07 |
Figure 2. Longitudinal Changes in Brain Activity.
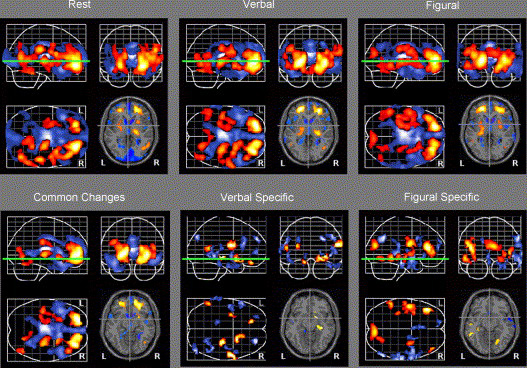
Differences in patterns of brain activity observed when comparing Year 1 to Year 9. Each example shows sagittal, coronal and axial projection images of the brain. The top row illustrates changes seen within each scan condition. The bottom row illustrates changes common to all scan conditions and those specific to verbal and figural recognition alone. Areas in blue illustrate significant decreases in rCBF; areas in red show significant increases in rCBF over time. The green line illustrates the z level of the representative slice shown in each condition.
Resting Condition
Longitudinal changes were observed during rest. Frontal lobe changes include decreased rCBF in extensive areas of the medial, superior, middle, and inferior (mid- to superior levels) gyri of the prefrontal cortex. In the temporal lobe, superior and middle temporal (left hemisphere) gyri showed decreased flow. Occipital decreases were seen in inferior occipital, lingual and cuneus regions. The mid-cingulate gyrus and thalamus (bilateral mid-level) also exhibited decreased rCBF over time. Increased rCBF was seen in mid- to inferior levels of the prefrontal white matter regions, sometimes extending into superior, middle and inferior areas of frontal cortex. Middle temporal gyrus increases were observed, but these occurred in the right hemisphere. Increased flow was also seen in the left hippocampus. Other areas of increased rCBF include inferior parietal, middle occipital and cerebellar cortical areas as well as the subcortical thalamus (right hemisphere, inferior to the decreased rCBF) and putamen.
Verbal Condition
Longitudinal changes during verbal recognition include decreased rCBF in medial and superior (right-sided) prefrontal cortex and in left hemisphere inferior prefrontal Broca’a Area (Brodmann Area (BA) 44). Superior (bilateral) and middle temporal association cortex and inferior insular temporal regions also showed decreased flow, as did the middle cingulate gyrus, the thalamus, and caudate. Frontal lobe increases in rCBF were seen in superior (bilateral) and middle frontal regions and in the premotor cortex. Increases were also observed in superior (left-sided) and inferior temporal areas, superior insular temporal regions, and in the left hippocampus. Middle occipital cortex, primary somatosensory cortex and inferior parietal cortex also increased rCBF, as did the cerebellum, globus pallidus and putamen.
Figural Condition
Longitudinal changes during figural recognition include decreased rCBF in right superior, middle and medial prefrontal regions. Temporal lobe decreases were again noted with decreased flow observed in superior and middle (mid-level) cortices and lateral insular temporal regions. The middle cingulate gyrus, thalamus (superior medial) and caudate also showed decreased rCBF over time. Increased rCBF was observed in bilateral superior, middle and inferior prefrontal regions and in the premotor cortex. Middle (inferior level) temporal cortex and medial insular temporal regions increased flow as did the left hippocampus. Other increases were seen in inferior parietal, middle occipital and cuneus regions. The brainstem, globus pallidus, putamen and thalamus (inferior lateral) also increased rCBF over time.
Between-Condition Changes
The results from the next section are shown in Table 5 and Figure 2 (bottom row).
Table 5.
Local maxima of areas of significant rCBF difference resulting from comparisons of the rest, verbal and figural activity patterns. The common changes represent areas that change during all scan conditions. Verbal specific changes are those observed only during verbal recognition relative to figural recognition and rest conditions. Figural specific changes are those observed only during figural recognition relative to verbal recognition and rest conditions. Stereotaxic coordinates are listed in Talairach space, Brodmann areas are indicated in parentheses.
| Between-Condition Activity Changes | Coordinate | ||||
|---|---|---|---|---|---|
| Region | Side | x | y | z | T-value |
| Common Decreases | |||||
| Sup Frontal Gyrus (10) | R | 2 | 64 | 6 | 5.61 |
| Med Frontal Gyrus (9) | R | 4 | 50 | 16 | 5.38 |
| Ant Cingulate Gyrus (24) | B | 0 | 16 | 22 | 3.47 |
| Ant Cingulate Gyrus (32) | R | 2 | 40 | 24 | 4.98 |
| Mid Cingulate Gyrus (24) | B | 0 | −10 | 32 | 6.65 |
| Sup Temporal Gyrus (38) | L | −40 | 18 | −20 | 6.58 |
| Sup Temporal Gyrus (38) | R | 46 | 16 | −14 | 5.78 |
| Insula | L | −54 | 10 | −8 | 4.58 |
| Thalamus | L | −2 | −20 | 12 | 9.30 |
| Caudate | R | 10 | 16 | 2 | 6.74 |
| Caudate | L | −2 | 12 | 0 | 5.59 |
| Common Increases | |||||
| Sup Frontal Gyrus (10) | L | −22 | 50 | −2 | 6.38 |
| Sup Frontal Gyrus (11) | R | 16 | 52 | −12 | 5.55 |
| Mid Frontal Gyrus (10) | R | 32 | 46 | 0 | 6.25 |
| Hippocampus | L | −26 | −26 | −4 | 3.35 |
| Inf Parietal Lobe (40) | L | −40 | −22 | 28 | 3.87 |
| Mid Occipital Gyrus (19) | R | 44 | −64 | −6 | 3.73 |
| Putamen | R | 26 | −18 | −2 | 4.61 |
| Putamen | R | 22 | 8 | −8 | 4.04 |
| Verbal Specific Decreases | |||||
| Sup Frontal Gyrus (9) | R | 28 | 52 | 30 | 4.47 |
| Inf Frontal Gyrus (44) | L | −54 | 22 | 24 | 3.80 |
| Inf Frontal Gyrus (10) | R | 54 | 46 | 2 | 3.27 |
| Sup Temporal Gyrus (22) | L | −48 | −6 | −4 | 3.41 |
| Mid Temporal Gyrus (21) | R | 42 | −42 | −4 | 3.94 |
| Mid Temporal Gyrus (22) | L | −66 | −36 | 4 | 3.20 |
| Inf Temporal Gyrus (20) | R | 40 | −12 | −28 | 3.18 |
| InfParietal Lobe (40) | R | 46 | −78 | 38 | 4.00 |
| Cerebellum | L | −16 | −30 | −22 | 3.14 |
| Verbal Specific Increases | |||||
| Med Frontal Gyrus (11) | L | −14 | 40 | −18 | 3.61 |
| Inf Frontal Gyrus (47) | R | 14 | 16 | −16 | 3.11 |
| Precentral Gyrus (4) | R | 60 | −4 | 18 | 3.79 |
| Sup Temporal Gyrus (21/22) | L | −52 | −52 | 12 | 3.19 |
| Insula | L | −28 | −4 | 16 | 3.21 |
| Hippocampus | R | 30 | −22 | −6 | 3.84 |
| Basal Forebrain | R | 22 | 6 | −10 | 3.79 |
| Figural Specific Decreases | |||||
| Med Frontal Gyrus (10) | L | −4 | 58 | 14 | 3.47 |
| Sup Frontal Gyrus (10) | L | −12 | 64 | 26 | 3.34 |
| Mid Frontal Gyrus (9) | R | 62 | 12 | 34 | 3.31 |
| Ant Cingulate Gyrus (32) | L | −2 | 24 | −6 | 3.25 |
| Sup Temporal Gyrus (22) | R | 62 | −28 | 18 | 3.30 |
| Mid Temporal Gyrus (21) | R | 64 | 0 | −12 | 3.63 |
| Inf Temporal Gyrus (20) | R | 74 | −20 | −18 | 4.26 |
| Insula | R | 48 | 4 | −4 | 3.69 |
| Inf Parietal Lobe (40) | R | 64 | −60 | 34 | 4.14 |
| Figural Specific Increases | |||||
| Mid Frontal Gyrus (46) | R | 42 | 46 | 4 | 3.59 |
| Inf Frontal Gyrus (45) | L | −40 | 32 | 14 | 4.63 |
| Precentral Gyrus (4) | L | −46 | −4 | 22 | 4.00 |
| Mid Temporal Gyrus (21) | L | −52 | −44 | −8 | 3.69 |
| Mid Temporal Gyrus (21) | L | −52 | −14 | −6 | 3.21 |
| Insula | R | 32 | −4 | −2 | 3.16 |
| Hippocampus | L | −32 | −30 | −6 | 3.28 |
| Cuneus (18) | R | 6 | −78 | 18 | 3.80 |
Common Changes
In this analysis, the contrast images reflecting the within-condition longitudinal changes were compared to one another to define significant regional changes common to all conditions (rest, verbal and figural). These generalized changes in rCBF over time include longitudinal decreases in superior and medial frontal (right-sided) regions, and superior and insular temporal regions. Common areas of decreased flow were also observed in the anterior and middle cingulate gyrus, the thalamus, and caudate. Areas of increased rCBF common to all conditions include bilateral superior and right-sided prefrontal white matter regions and superior levels of the posterior left hippocampus. The inferior parietal cortex, middle occipital gyrus and putamen also increased flow.
Verbal-specific Changes
To define regional changes in CBF specific to verbal memory processing, the contrast images from the first analysis were compared to define changes that occur in the verbal condition but not in the rest or figural conditions. Verbal-specific longitudinal decreases in rCBF were seen in superior and bilateral inferior prefrontal regions (BA 10) including Broca’s Area (BA 44). Verbal-specific decreases were also seen in anterior inferior Wernicke’s Area (BA 22), middle and inferior temporal regions, and in the inferior parietal lobe and cerebellum. Increases in rCBF were seen in medial and right-sided inferior frontal (BA 47) regions, in primary motor cortex, and in posterior superior Wernicke’s Area. The left insular temporal region, right hippocampus and the basal forebrain also increased rCBF over time.
Figural-specific Changes
Figural-specific changes in rCBF were defined as those occurring during the figural condition but not rest and verbal conditions. Longitudinal decreases in rCBF were observed in superior, middle (superior level) and medial prefrontal regions. Decreases were also seen in right-sided superior, middle, inferior temporal association areas and in lateral insular temporal areas. The anterior cingulate gyrus and the inferior parietal cortex also decreased flow. Increases in rCBF were seen in inferior level middle prefrontal and inferior frontal regions. Temporal lobe increases were seen in the middle (left) temporal gyrus, a more medial insular temporal region, and inferior levels of the posterior left hippocampus. The primary motor cortex and the cuneus also increased flow over time.
Associations between rCBF and Task Performance
Regions of longitudinal rCBF change from the primary analyses above that were associated with changes over time with task performance are listed in Table 6.
Table 6.
Local maxima of areas showing significant associations between change in rCBF and individual change in task performance from Year 1 to 9. Stereotaxic coordinates are listed in Talairach space, Brodmann areas are indicated in parentheses. Arrows show interpretation based on primary analyses of longitudinal change.
| rCBF and Task Performance | Coordinate | |||||
|---|---|---|---|---|---|---|
| Region | Side | x | y | z | T-value | Association |
| Verbal Sensitivity Positive Correlation | ||||||
| Pre/Postcentral Gyrus (3/4)* | R | 70 | −20 | 36 | 3.39 | ↑ score = ↑ rCBF |
| Inf Temporal Gyrus (20) + | R | 62 | −8 | −34 | 3.44 | ↓ score = ↓ rCBF |
| Inf Pareital Lobe (40) + | R | 56 | −48 | 32 | 3.19 | ↓ score = ↓ rCBF |
| Verbal Sensitivity Negative Correlation | ||||||
| Sup Temporal Gyrus (21)* | L | −30 | 2 | −18 | 5.01 | ↓ score = ↑ rCBF |
| Sup Temporal Gyrus (22) + | L | −44 | −32 | 6 | 3.26 | ↑ score = ↓ rCBF |
| Figural Sensitivity Negative Correlation | ||||||
| Precentral Gyrus (4)* | L | −68 | −20 | 38 | 3.26 | ↓ score = ↑ rCBF |
| Verbal Reaction Time Negative Correlation | ||||||
| Parahippocampal Gyrus (36)* | R | 24 | −40 | −8 | 3.39 | ↓ RT = ↑ rCBF |
| Figural Reaction Time Positive Correlation | ||||||
| Mid Frontal Gyrus (9) + | R | 38 | 22 | 32 | 3.09 | ↓ RT = ↓ rCBF |
| Figural Reaction Time Negative Correlation | ||||||
| Sup Temporal Gyrus (22) + | R | 62 | −46 | 22 | 3.37 | ↑ RT = ↓ rCBF |
| Mid Temporal Gyrus (21) + | R | 52 | −32 | −8 | 4.13 | ↑ RT = ↓ rCBF |
| Insula* | R | 40 | −2 | 6 | 3.57 | ↓ RT = ↑ rCBF |
Several relationships between changes in rCBF and task accuracy (sensitivity score) over time were observed in the verbal condition. These include a positive relationship between performance and rCBF changes in the inferior temporal gyrus and inferior parietal lobe. Because these regions showed decreased rCBF over time in the primary analysis of longitudinal change, this finding suggests that individuals who performed more poorly have a greater decrease in flow over time than those whose performance improved. A positive association was also seen in the pre/postcentral gyrus suggesting that increased performance is associated with increased rCBF. Conversely, a negative association was observed in the superior temporal gyrus (BA 22), indicating increased performance in association with decreased rCBF over time. A negative association was also observed with a longitudinal increase in rCBF in the superior temporal gyrus (BA 21), suggesting that poorer performers show greater increases in rCBF over time in this region. For the figural condition, only one region overlapped with the primary analysis of longitudinal change indicating that poorer performers show a greater increase in the precentral gyrus over time.
Significant associations between changes in rCBF and changes in reaction time include an increase in parahippocampal rCBF over time in faster performers during the verbal condition. This area extends into the region of the hippocampus where longitudinal rCBF increases were noted over time. During the figural task, faster performance is related to increased rCBF in the insula and decreased rCBF in the middle frontal gyrus. Slower performance is associated with decreased rCBF in the superior and middle temporal gyri.
DISCUSSION
In this study, longitudinal changes in memory performance and regional brain activity in older adults were investigated over an 8-year period. While normal aging is often associated with declines in cognitive performance [62,70], here we present data from a group of healthy adults that were selected for maintenance of stable physical and cognitive health throughout the study. Three important findings emerge from our results. First, we find that while longitudinal memory performance remains stable, patterns of brain activity change over time in older individuals who maintain good physical and cognitive health. Second, these blood flow changes are robust, encompass large cortical and subcortical areas, and are observed during the resting state and during verbal and figural recognition memory. Finally, in addition to changes specific to verbal and figural recognition processes alone, rCBF changes also occur commonly across all scan conditions suggesting that there are generalized as well as modality-specific changes in brain function with age.
Changes in brain activity with maintenance of memory performance
In our sample of healthy older adults, there were no significant declines in verbal and figural recognition memory accuracy over a period of 8 years. Nevertheless, we found both regional increases and decreases in brain activity over time in these individuals. Our data support cross-sectional studies where altered patterns of cerebral activity were found in old relative to young individuals [20,43,63], and extend these findings to show that changing brain function continues throughout later life in cognitively stable individuals. Our findings also show that these changes occur across multiple conditions, including the resting state.
Two theories have been proposed to characterize the processes that lead to altered patterns of activity in the older brain relative to the young brain. The functional compensation theory [9,22,42,59] attributes declining activity to decreases in functional integrity or efficiency that occur as the brain ages. This theory, in turn, views increases in activity as a form of compensation where new regional activity counteracts the effects of declining regions. The dedifferentiation theory [37,39], on the other hand, views decreases in activity as a loss of task-specific processing capabilities with age. Increases in activity are also thought to be compensatory if supportive of behavioral performance but in this theory represent the increased involvement of non-specific or generalized processes in the brain. We offer a third interpretation of longitudinal increases in brain activity. We propose that increases in rCBF in some regions may reflect preservation of function over time in view of age-related declines in global cerebral blood flow [36,50]. Together, these interpretations provide a number of explanations that may help to characterize longitudinal changes in aging brain function. While the exact mechanisms of age changes in neuronal activity cannot be determined with rCBF imaging techniques, each of the results presented here tend to support at least one of the aging theories.
Finally, as with any longitudinal study where repeated testing occurs, practice effects must be considered when interpreting the data. In recognition or retrieval tasks, the initial encoding of the stimuli results in greater brain activation than recognition; therefore, the greatest effects of practice are usually observed during the encoding portion of the task [35,65]. Nevertheless, changes have been observed during the recognition phase in young individuals with patterns of both increased and decreased activity related to repeated testing [32,73,75]. Although there is very limited functional imaging data on the effects of practice in older adults, it has been shown that they demonstrate less change in brain activity related to practice than do younger individuals [44]. This finding has led to the suggestion that changes in brain activation in older individuals may be more representative of task-related reallocation of resources that allow for continued performance rather than the result of changes in functional activity related to practice itself.
Resting state longitudinal changes
Our results show that there are extensive changes in regional blood flow during the resting state in older individuals as they age. Both decreases and increases in rCBF are seen in cortical and subcortical areas of the brain demonstrating that functional changes in brain activity occur over time during the resting condition.
Decreases in resting-state activity are noted in widespread prefrontal cortical regions (left > right), inferior portions of the middle cingulate gyrus, anterior temporal regions, in inferior visual association areas and along the occipitotemporal visual pathway. Additionally, subcortical mid-level thalamic regions decrease rCBF over time. Several regions also show relative increases in blood flow during rest. These include a large portion of the prefrontal white matter (right > left), inferior rostral portions of the anterior cingulate, the left hippocampus, and middle visual association areas. The cerebellum and inferior portions of the thalamus also increase rCBF over time.
According to the functional compensation and dedifferentiation theories, the decreases presented here may be markers of declining functional integrity over time, either from loss of efficiency or processing specificity. If this is the case, the ramifications of altered function in these areas are extensive. For example, prefrontal dysfunction could influence memory [16,52,76] and executive function [14,15,25]. Decreased activity in occipital and occipitotemporal cortices may impact visual perception, especially perception related to form [7,46,55] and object recognition [12,19,47]. Decreased processing efficiency in the thalamus can have additional consequences, for it relays almost all incoming sensory information and has been implicated in cognition [3,74], consciousness [29,34], attention [74] and motor integration [23,30]. While these declines may be representative of decreased efficiency or processing specificity, our participants do not show adverse behavioral effects. If the declines are related to a change in functional status, the effects of the change may not be apparent until very late in the lifespan or perhaps with the onset of disease when compensatory mechanisms are overcome.
Areas of increased blood flow during rest are more complex and can be divided into two categories: regions where increases are coupled with a homologous decrease in similar or adjacent areas, and regions where there is no distinct relationship between increasing and decreasing flow. In the first category, both the thalamus and the occipital association cortex show differential patterns of decreasing and increasing blood flow over time: the mid-level thalamus decreases while inferior levels increase, and inferior visual association areas decrease while middle visual association areas increase. In these regions, one may argue that the patterns of change represent some form of compensatory activity. Because these changes are observed during the resting state and may be considered state-specific similar to the way in which changes noted during a cognitive condition are task-specific, they may reflect a form of functional compensation where a new region of the thalamus and occipital cortex assumes a complementary functional role to the declining region. On the other hand, there are no specific cognitive demands required or even encouraged during the resting state, so one may also argue that all processes during rest are non-specific. In this interpretation, the increases more closely fit the dedifferentiation model of brain aging.
Most of the increases observed during the resting condition, however, fall into the second category where increases are not coupled with a homologous or contralateral decrease. In this case, it is difficult to argue that the increases represent compensatory activity. Instead, the increased blood flow in the prefrontal white matter, the hippocampus and cerebellum may represent regions of preserved cerebral blood flow relative to decreases in global blood flow observed with advancing age. With this interpretation, preservation of function suggests that these regions of the brain are less susceptible to age-related rCBF decline than others.
Modality-specific longitudinal changes
Changes in activation are also observed during both verbal and figural recognition. With regard to verbal recognition, a number of regions show rCBF changes over time that are unique to the verbal memory condition alone. These changes are primarily observed in frontal and temporal lobes of the brain and involve both Broca’s and Wernicke’s language areas. Longitudinal changes in blood flow are also seen in regions known to be susceptible to pathologic change with age, yet our findings suggest that brain activity within these areas is not necessarily compromised in normal aging.
While areas of the inferior parietal lobe and cerebellum show decreases in blood flow during verbal recognition, other verbal-specific changes in rCBF are seen in the frontal and temporal lobes of the brain. In the temporal lobes, decreases occur in anterior superior, middle and inferior temporal association cortices while increases are found in posterior superior and medial temporal regions. In the frontal lobes, decreases are observed in superior and bilateral inferior prefrontal regions while increases are seen in medial and right-sided inferior prefrontal areas. Interestingly, this increase in frontal lobe activity does not support the HAROLD model of aging [9,13]. The HAROLD model proposes that memory-related frontal lobe activity becomes more bilateral as one ages and is usually seen when comparing brain activation patterns in older subjects to that of young subjects. The absence of increasing bilateral activity here may due to the fact that there is a much larger temporal span between young and older groups than the span of 8 years involved in this study.
Changes in language-related regions of the brain also occur, the most paradoxical of which is a decline in both Broca’s area and a portion of Wernicke’s area from Year 1 to Year 9 while task performance remains stable. This finding suggests that the activity decline in language areas does not impact this type of word recognition in normal aging, possibly due to more efficient language processing with time or a shift in recognition strategy over time. This argument is strongest for Broca’s area where only declining blood flow is observed. In Wernicke’s area, however, declines occur in anterior inferior portions and increases occur in posterior superior portions from Year 1 to 9. Unlike the pattern seen on Broca’s area, the activity changes in Wernicke’s area suggest that some form of compensatory activity occurs within this region over time.
Verbal-specific changes in activation are also seen in two regions thought to be vulnerable to age-related pathologic change. First, the right hippocampus increases blood flow from Year 1 to Year 9, reflecting increased involvement of this region in verbal recognition over time. It is well known that the hippocampus and associated ventromedial temporal cortex undergo structural and pathologic changes ranging from mild to moderate changes in healthy aging [26,68] to severe alterations in Alzheimer’s disease [4,8,27]. Our finding suggests that even in the presence of structural change, this region maintains functional integrity in healthy individuals with advancing age. Second, the basal forebrain shows an increase in rCBF over time. The basal forebrain, which houses the nucleus basalis of Meynert, is a primary source of neocortical cholinergic innervation. While cholinergic neurotransmission is important for memory function [41,64], neuropathologic studies have shown that this region is susceptible to structural change with age (see [53,68]). The increased activity demonstrated here suggests that basal forebrain function is relatively intact in healthy older individuals, and further suggests that the cholinergic system may play a more prominent role in verbal recognition with increasing age.
Together, the changes observed during the verbal condition tend to support the functional compensation theory of brain aging. The task-specific nature of these changes and the stability of mean task performance in this sample argue against the dedifferentiation theory as an explanation of these findings.
Longitudinal changes in activation are also observed during figural recognition memory. While frontal, temporal and occipital lobes show figural-specific changes from Year 1 to 9, the pattern of change differs from that observed in the verbal condition. Here, there is a pronounced hemispheric pattern of increased and decreased blood flow, especially along the occipitotemporal visual pathway. Similar to the findings for verbal recognition, however, the overall pattern of change over time supports the functional compensation theory of brain aging.
Previously, we have shown that regions typically involved in figural recognition in older adults lie along the right occipitotemporal pathway [6]. In this study, the data suggest that a hemispheric shift occurs longitudinally, with right hemisphere regions decreasing and left hemisphere regions increasing activity over time. Declines are seen predominately in medial and right-sided posterior superior prefrontal regions and lateral temporal association areas. Unilateral increases occur in left-sided lateral temporal association areas and the posterior inferior hippocampus, whereas bilateral increases are seen in visual association areas.
These findings illustrate three important points. First, the hemispheric shift in activity is especially pronounced in temporal association regions. While it is known that these regions are involved in visual feature perception [45,54,61] and object identification [1,33,66] in young individuals, the pattern of change observed here suggests that age-related decline of right hemisphere regions may be counteracted by an increase in homologous regions of the left hemisphere. Second, increased activity is again seen in the hippocampus when comparing Year 1 to Year 9. This finding further augments the argument of sustained hippocampal function with advanced age in our sample. Finally, visual areas were found to increase activity during a task that requires visual feature perception and identification. This finding suggests that visual processing demands increase over time with advancing age in older individuals.
As with the verbal task, performance levels on the figural task remain stable across time suggesting that the changes in brain activity may be compensatory in nature. While only the middle temporal gyrus shows a precise pattern of inverse change (e.g. where a specific region in the right hemisphere declines while the same region in the left hemisphere increases), the overall hemispheric shift in activity over time may represent a more global form of functional compensation. This shift may reflect functional reorganization or a reallocation of the processes required for consistent recognition ability as proposed by the functional compensation theory.
Generalized longitudinal changes
In addition to the changes in blood flow described in the previous sections, there are also changes in rCBF that occur commonly across all task conditions. These findings suggest that some common operational level of brain function continues to change in older individuals with increasing age. Both decreases and increases in rCBF are observed over time, primarily in frontal and temporal lobes of the brain‥
Here, we find decreased cortical blood flow in medial prefrontal regions, superior portions of the anterior and middle cingulate gyrus, and in the insula. The thalamic and caudate regions bordering the lateral ventricles also decrease flow over time, which may reflect, in part, decreased brain tissue in these regions or partial volume effects from well-documented age-associated increases in ventricular volume [56,77]. Several regions of increased activity are also observed across all scan conditions. These relative increases in flow were found in the prefrontal white matter, inferior parietal cortex, the middle occipital gyrus and the left posterior superior hippocampus.
Because these findings occur in all scan conditions, one might argue that the changes in rCBF represent changes in generalized processing capabilities as proposed in the dedifferentiation theory. Decreases may result from declines in task-specific processing in many areas of the brain, while increases represent regions that take on more generalized processing functions with time. Alternatively, these generalized increases may also represent preservation of function over time reflecting regions of relative functional stability with advancing age.
Conclusions
Taken together, these data show that resting, modality-specific and generalized changes in brain activity occur over an 8 year period in healthy, cognitively stable older individuals. We have shown that many regions of the brain decrease blood flow over time, suggesting that there are definitive patterns of age-related vulnerability. Overall, frontal and temporal lobes of the brain exhibit the greatest regions of age-related functional decline. These regions also exhibit other areas of increased activity, suggesting that the healthy aging brain continues to undergo functional reorganization with advancing age.
The resting-state and generalized findings indicate that basic levels of brain function are not constant in the older brain. Instead, both cortical and subcortical changes in brain function occur with advancing age. Equally important are the modality-specific functional changes which occur in the absence of declining performance. While it may be argued that functional compensation promotes stable cognitive ability over time in healthy older individuals, there are other processes that also may contribute to activity changes over time. Aside from compensatory mechanisms, it is possible that some changes may result from an increase in age-related non-selective recruitment of resources [40] or perhaps from an increase in noise in the neural networks [38] with age.
Acknowledgements
We thank the staff of the PET facility at Johns Hopkins University and the neuroimaging staff of the NIA for their assistance. This research was supported by the Intramural Research Program of the NIH, National Institute on Aging and by Research and Development Contract N01-AG-3-2124.
Footnotes
Publisher's Disclaimer: This is a PDF file of an unedited manuscript that has been accepted for publication. As a service to our customers we are providing this early version of the manuscript. The manuscript will undergo copyediting, typesetting, and review of the resulting proof before it is published in its final citable form. Please note that during the production process errors may be discovered which could affect the content, and all legal disclaimers that apply to the journal pertain.
Disclosure Statement: All authors confirm that there are no conflicts of interest with regard to this work.
REFERENCES
- 1.Amedi A, von Kriegstein K, van Atteveldt NM, Beauchamp MS, Naumer MJ. Functional imaging of human crossmodal identification and object recognition. Exp Brain Res. 2005;166:559–571. doi: 10.1007/s00221-005-2396-5. [DOI] [PubMed] [Google Scholar]
- 2.Anderson ND, Iidaka T, Cabeza R, Kapur S, McIntosh AR, Craik FI. The effects of divided attention on encoding- and retrieval-related brain activity: A PET study of younger and older adults. J Cogn Neurosci. 2000;12:775–792. doi: 10.1162/089892900562598. [DOI] [PubMed] [Google Scholar]
- 3.Annoni JM, Khateb A, Gramigna S, Staub F, Carota A, Maeder P, Bogousslavsky J. Chronic cognitive impairment following laterothalamic infarcts: a study of 9 cases. Arch Neurol. 2003;60:1439–1443. doi: 10.1001/archneur.60.10.1439. [DOI] [PubMed] [Google Scholar]
- 4.Arnold SE, Hyman BT, Flory J, Damasio AR, Van Hoesen GW. The topographical and neuroanatomical disrtibution of neurofibrillary tangles and neuritic plaques in the cerebral cortex of patients with Alzheimer's disease. Cerebral Cortex. 1991;1:103–116. doi: 10.1093/cercor/1.1.103. [DOI] [PubMed] [Google Scholar]
- 5.Backman L, Almkvist O, Andersson J, Nordberg A, Winblad B, Reineck R, Långstrom B. Brain Activation in Young and Older Adults During Implicit and Explicit Retrieval. Journal Cognitive Neuroscience. 1997;9:378–391. doi: 10.1162/jocn.1997.9.3.378. [DOI] [PubMed] [Google Scholar]
- 6.Beason-Held L, Golski S, Kraut M, Esposito G, Resnick S. Brain activation during encoding and recognition of verbal and figural information in older adults. Neurobiol Aging. 2005;26:237–250. doi: 10.1016/j.neurobiolaging.2004.03.014. [DOI] [PubMed] [Google Scholar]
- 7.Beason-Held LL, Purpura KP, Van Meter JW, Azari NP, Mangot DJ, Optican LM, Mentis MJ, Alexander GE, Grady CL, Horwitz B, Rapoport SI, Schapiro MB. PET reveals occipitotemporal pathway activation during elementary form perception in humans. Vis Neurosci. 1998;15:503–510. doi: 10.1017/s0952523898153117. [DOI] [PubMed] [Google Scholar]
- 8.Braak H, Braak E. Frequency of stages of Alzheimer-related lesions in different age categories. Neurobiol Aging. 1997;18:351–357. doi: 10.1016/s0197-4580(97)00056-0. [DOI] [PubMed] [Google Scholar]
- 9.Cabeza R, Anderson ND, Locantore JK, McIntosh AR. Aging gracefully: compensatory brain activity in high-performing older adults. Neuroimage. 2002;17:1394–1402. doi: 10.1006/nimg.2002.1280. [DOI] [PubMed] [Google Scholar]
- 10.Cabeza R, Grady CL, Nyberg L, McIntosh AR, Tulving E, Kapur S, Jennings JM, Houle S, Craik FI. Age-related differences in neural activity during memory encoding and retrieval: a positron emission tomography study. J. Neurosci. 1997;17:391–400. doi: 10.1523/JNEUROSCI.17-01-00391.1997. [DOI] [PMC free article] [PubMed] [Google Scholar]
- 11.Cabeza R, Grady CL, Nyberg L, McIntosh AR, Tulving E, Kapur S, Jennings JM, Houle S, Craik FI. Age-related differences in neural activity during memory encoding and retrieval: a positron emission tomography study. J Neurosci. 1997;17:391–400. doi: 10.1523/JNEUROSCI.17-01-00391.1997. [DOI] [PMC free article] [PubMed] [Google Scholar]
- 12.Courtney S, Ungerleider L, Keil K, Haxby J. Object and spatial visual working memory activate separate neural systems in human cortex. Cerebral Cortex. 1996;6:39–49. doi: 10.1093/cercor/6.1.39. [DOI] [PubMed] [Google Scholar]
- 13.Dolcos F, Rice HJ, Cabeza R. Hemispheric asymmetry and aging: right hemisphere decline or asymmetry reduction. Neurosci Biobehav Rev. 2002;26:819–825. doi: 10.1016/s0149-7634(02)00068-4. [DOI] [PubMed] [Google Scholar]
- 14.Elderkin-Thompson V, Boone KB, Hwang S, Kumar A. Neurocognitive profiles in elderly patients with frontotemporal degeneration or major depressive disorder. J Int Neuropsychol Soc. 2004;10:753–771. doi: 10.1017/S1355617704105067. [DOI] [PubMed] [Google Scholar]
- 15.Eslinger PJ, Flaherty-Craig CV, Benton AL. Developmental outcomes after early prefrontal cortex damage. Brain Cogn. 2004;55:84–103. doi: 10.1016/S0278-2626(03)00281-1. [DOI] [PubMed] [Google Scholar]
- 16.Gilboa A. Autobiographical and episodic memory--one and the same? Evidence from prefrontal activation in neuroimaging studies. Neuropsychologia. 2004;42:1336–1349. doi: 10.1016/j.neuropsychologia.2004.02.014. [DOI] [PubMed] [Google Scholar]
- 17.Golski S, Zonderman A, Malamut B, Resnick S. Verbal and figural recognition memory: task development and age associations. Exp Aging Res. 1998;24:359–385. doi: 10.1080/036107398244193. [DOI] [PubMed] [Google Scholar]
- 18.Grady CL, Craik FI. Changes in memory processing with age. Curr Opin Neurobiol. 2000;10:224–231. doi: 10.1016/s0959-4388(00)00073-8. [DOI] [PubMed] [Google Scholar]
- 19.Grady CL, Haxby JV, Horwitz B, Schapiro MB, Rapoport SI. Dissociation of object and spatial vision in human extrastriate cortex: age-related changes in activation of regional cerebral blood flow measured with 15O water and positron emission tomography. J. Cogn. Neurosci. 1992;4:23–34. doi: 10.1162/jocn.1992.4.1.23. [DOI] [PubMed] [Google Scholar]
- 20.Grady CL, Maisog JM, Horwitz B, Ungerleider LG, Mentis MJ, Salerno JA, Pietrini P, Wagner E, Haxby JV. Age-related changes in cortical blood flow activation during visual processing of faces and location. J. Neurosci. 1994;14:1450–1462. doi: 10.1523/JNEUROSCI.14-03-01450.1994. [DOI] [PMC free article] [PubMed] [Google Scholar]
- 21.Grady CL, McIntosh AR, Horwitz B, Maisog JM, Ungeleider LG, Mentis MJ, Pietrini P, Schapiro MB, Haxby JV. Age-related reductions in human recognition memory due to impaired encoding. Science. 1995;269:218–221. doi: 10.1126/science.7618082. [DOI] [PubMed] [Google Scholar]
- 22.Grady CL, McIntosh AR, Rajah MN, Beig S, Craik FI. The effects of age on the neural correlates of episodic encoding. Cereb Cortex. 1999;9:805–814. doi: 10.1093/cercor/9.8.805. [DOI] [PubMed] [Google Scholar]
- 23.Groenewegen HJ. The basal ganglia and motor control. Neural Plast. 2003;10:107–120. doi: 10.1155/NP.2003.107. [DOI] [PMC free article] [PubMed] [Google Scholar]
- 24.Hazlett EA, Buchsbaum MS, Mohs RC, Spiegel-Cohen J, Wei TC, Azueta R, Haznedar MM, Singer MB, Shihabuddin L, Luu-Hsia C, Harvey PD. Age-related shift in brain region activity during sucessful memory performance. Neurobiol Aging. 1998;19:437–445. doi: 10.1016/s0197-4580(98)00075-x. [DOI] [PubMed] [Google Scholar]
- 25.Heyder K, Suchan B, Daum I. Cortico-subcortical contributions to executive control. Acta Psychol (Amst) 2004;115:271–289. doi: 10.1016/j.actpsy.2003.12.010. [DOI] [PubMed] [Google Scholar]
- 26.Hof P, Giannakopoulos P, Bouras C. The neuropathological changes associated with normal brain aging. Histol Histopathol. 1996;11:1075–1088. [PubMed] [Google Scholar]
- 27.Hyman BT, Van Hoeson GW, Damasio AR. Memory-related neural systems in Alzheimer's disease. An anatomic study. Neurol. 1990;40:1721–1730. doi: 10.1212/wnl.40.11.1721. [DOI] [PubMed] [Google Scholar]
- 28.Jernigan TL, Archibald MT, Berhow MT, Sowell ER, Foster DS, Hesselink JR. Cerebral structure on MRI, part 1: localization of age-related changes. Biol. Psychiatry. 1991;29:55–67. doi: 10.1016/0006-3223(91)90210-d. [DOI] [PubMed] [Google Scholar]
- 29.Joliot M, Ribary U, Llinas R. Human oscillatory brain activity near 40 Hz coexists with cognitive temporal binding. Proc Natl Acad Sci U S A. 1994;91:11748–11751. doi: 10.1073/pnas.91.24.11748. [DOI] [PMC free article] [PubMed] [Google Scholar]
- 30.Karussis D, Leker RR, Abramsky O. Cognitive dysfunction following thalamic stroke: a study of 16 cases and review of the literature. J Neurol Sci. 2000;172:25–29. doi: 10.1016/s0022-510x(99)00267-1. [DOI] [PubMed] [Google Scholar]
- 31.Kawas C, Gray S, Brookmeyer R, Fozard J, Zonderman A. Age-specific incidence rates of Alzheimer's disease: the Baltimore Longitudinal Study of Aging. Neurology. 2000;54:2072–2077. doi: 10.1212/wnl.54.11.2072. [DOI] [PubMed] [Google Scholar]
- 32.Kirschen MP, Chen SH, Schraedley-Desmond P, Desmond JE. Load- and practice-dependent increases in cerebro-cerebellar activation in verbal working memory: an fMRI study. Neuroimage. 2005;24:462–472. doi: 10.1016/j.neuroimage.2004.08.036. [DOI] [PubMed] [Google Scholar]
- 33.Kosslyn SM, Alpert NM, Thompson WL, Chabris CF, Rauch SL, Anderson AK. Identifying objects seen from different viewpoints, a PET investigation. Brain. 1994;117:1055–1071. doi: 10.1093/brain/117.5.1055. [DOI] [PubMed] [Google Scholar]
- 34.Kostopoulos GK. Involvement of the thalamocortical system in epileptic loss of consciousness. Epilepsia. 2001;42 Suppl 3:13–19. doi: 10.1046/j.1528-1157.2001.042suppl.3013.x. [DOI] [PubMed] [Google Scholar]
- 35.Landau SM, Schumacher EH, Garavan H, Druzgal TJ, D'Esposito M. A functional MRI study of the influence of practice on component processes of working memory. Neuroimage. 2004;22:211–221. doi: 10.1016/j.neuroimage.2004.01.003. [DOI] [PubMed] [Google Scholar]
- 36.Leenders KL, Perani D, Lammertsma A, Heather JD, Buckingham P, Helay MJR, Gibbs JM, Wise RJS, Hatazawa J, Herold S, Beany RP, Brooks DJ, Spinks T, Rhodes C, Frackowiak RSJ, Jones T. Cerebral blood flow, blood volume, and oxygen utilization. Normal values and the effect of age. Brain. 1990;113:27–47. doi: 10.1093/brain/113.1.27. [DOI] [PubMed] [Google Scholar]
- 37.Li SC, Lindenberger U, Sikstrom S. Aging cognition: from neuromodulation to representation. Trends Cogn Sci. 2001;5:479–486. doi: 10.1016/s1364-6613(00)01769-1. [DOI] [PubMed] [Google Scholar]
- 38.Li SC, Sikstrom S. Integrative neurocomputational perspectives on cognitive aging, neuromodulation, and representation. Neurosci Biobehav Rev. 2002;26:795–808. doi: 10.1016/s0149-7634(02)00066-0. [DOI] [PubMed] [Google Scholar]
- 39.Lindenberger U, Scherer H, Baltes PB. The strong connection between sensory and cognitive performance in old age: not due to sensory acuity reductions operating during cognitive assessment. Psychol Aging. 2001;16:196–205. doi: 10.1037//0882-7974.16.2.196. [DOI] [PubMed] [Google Scholar]
- 40.Logan JM, Sanders AL, Snyder AZ, Morris JC, Buckner RL. Under-recruitment and nonselective recruitment: dissociable neural mechanisms associated with aging. Neuron. 2002;33:827–840. doi: 10.1016/s0896-6273(02)00612-8. [DOI] [PubMed] [Google Scholar]
- 41.Lucas-Meunier E, Fossier P, Baux G, Amar M. Cholinergic modulation of the cortical neuronal network. Pflugers Arch. 2003;446:17–29. doi: 10.1007/s00424-002-0999-2. [DOI] [PubMed] [Google Scholar]
- 42.Madden DJ, Gottlob LR, Allen PA. Adult age differences in visual search accuracy: attentional guidance and target detectability. Psychol Aging. 1999;14:683–694. doi: 10.1037//0882-7974.14.4.683. [DOI] [PubMed] [Google Scholar]
- 43.Madden DJ, Turkington TG, Coleman RE, Provenzale JM, DeGrado TR, Hoffman JM. Adult age differences in regional cerebral blood flow during visual world identification: evidence from H215O PET. Neuroimage. 1996;3:127–142. doi: 10.1006/nimg.1996.0015. [DOI] [PubMed] [Google Scholar]
- 44.Madden DJ, Turkington TG, Provenzale JM, Denny LL, Hawk TC, Gottlob LR, Coleman RE. Adult age differences in the functional neuroanatomy of verbal recognition memory. Hum Brain Mapp. 1999;7:115–135. doi: 10.1002/(SICI)1097-0193(1999)7:2<115::AID-HBM5>3.0.CO;2-N. [DOI] [PMC free article] [PubMed] [Google Scholar]
- 45.Malach R, Reppas JB, Benson RR, Kwong KK, Jiang H, Kennedy WA, Ledden PJ, Brady TJ, Rosen BR, Tootell RBH. Object-related activity revealed by functional magnetic resonance imaging in the human occipital cortex. Proc. Natl. Acad. Sci. 1995;92:8135–8139. doi: 10.1073/pnas.92.18.8135. [DOI] [PMC free article] [PubMed] [Google Scholar]
- 46.Marsolek CJ, Kosslyn SM, Squire LR. Form-specific visual priming in the right cerebral hemisphere. J. Exp. Psychol. 1992;18:492–508. doi: 10.1037//0278-7393.18.3.492. [DOI] [PubMed] [Google Scholar]
- 47.Mishkin M, Ungerleider LG, Macko KA. Object vision and spatial vision: two cortical pathways. TINS. 1983;6:414–417. [Google Scholar]
- 48.Moffat S, Elkins W, Resnick S. Age Differences in the Neural Systems Supporting Human Allocentric Spatial Navigation. Neurobiol Aging. doi: 10.1016/j.neurobiolaging.2005.05.011. in press. [DOI] [PubMed] [Google Scholar]
- 49.Paivio A, Yuille J, Madigan S. Concreteness, imagery, and meaningfulness values for 925 nouns. J Exp Psychol. 1968;76:1–25. doi: 10.1037/h0025327. [DOI] [PubMed] [Google Scholar]
- 50.Pantano P, Baron J-C, Lebrun-Grandie P, Duquesnoy N, Bousser M-G, Comar M. Regional cerebral blood flow and oxygen consumption in human aging. Stroke. 1984;15:635–641. doi: 10.1161/01.str.15.4.635. [DOI] [PubMed] [Google Scholar]
- 51.Park D, Polk T, Mikels J, Taylor S, Marshuetz C. Cerebral aging: integration of brain and behavioral models of cognitive function. Dialogues in Clinical Neuroscience. 2001;3:151–166. doi: 10.31887/DCNS.2001.3.3/dcpark. [DOI] [PMC free article] [PubMed] [Google Scholar]
- 52.Passingham D, Sakai K. The prefrontal cortex and working memory: physiology and brain imaging. Curr Opin Neurobiol. 2004;14:163–168. doi: 10.1016/j.conb.2004.03.003. [DOI] [PubMed] [Google Scholar]
- 53.Powers RE. Neurobiology of aging. In: Coffey C, Cummings J, Coffey C, Cummings Js, editors. Textbook of Geriatric Neuropsychiatry. Washington, DC: The American Psychiatric Press; 1994. pp. 35–70. [Google Scholar]
- 54.Puce A, Allison T, Asgari M, Gore JC, McCarthy G. Differential sensitivity of human visual cortex to faces, letterstrings and textures: a functional magnetic resonance study. J. Neurosci. 1996;16:5205–5215. doi: 10.1523/JNEUROSCI.16-16-05205.1996. [DOI] [PMC free article] [PubMed] [Google Scholar]
- 55.Purpura KP, Victor JD. Processing of form in monkey area V1. Soc. Neurosci. Abstr. 1990;16:293. [Google Scholar]
- 56.Resnick S, Pham D, Kraut M, Zonderman A, Davatzikos C. Longitudinal magnetic resonance imaging studies of older adults: a shrinking brain. J Neurosci. 2003;23:3295–3301. doi: 10.1523/JNEUROSCI.23-08-03295.2003. [DOI] [PMC free article] [PubMed] [Google Scholar]
- 57.Resnick SM, Goldszal AF, Davatzikos C, Golski S, Kraut MA, Metter EJ, Bryan RN, Zonderman AB. One-year age changes in MRI brain volumes in older adults. Cereb Cortex. 2000;10:464–472. doi: 10.1093/cercor/10.5.464. [DOI] [PubMed] [Google Scholar]
- 58.Resnick SM, Maki PM. Effects of hormone replacement therapy on cognitive and brain aging. Ann N Y Acad Sci. 2001;949:203–214. doi: 10.1111/j.1749-6632.2001.tb04023.x. [DOI] [PubMed] [Google Scholar]
- 59.Reuter-Lorenz P, Jonides J, Smith E, Hartley A, Miller A, Marshuetz C, Koeppe R. Age differences in the frontal lateralization of verbal and spatial working memory revealed by PET. J Cogn Neurosci. 2000;12:174–187. doi: 10.1162/089892900561814. [DOI] [PubMed] [Google Scholar]
- 60.Reuter-Lorenz P, Marshuetz C, Jonides J, Smith E, Hartley A, Koeppe R. Neurocognitive ageing of storage and executive processes. Eur J Cogn Psychol. 2001;13:257–278. [Google Scholar]
- 61.Roland P, Gulyas B. Visual memory, visual imagery, and visual recognition of large field patterns by the human brain: functional anatomy by positron emission tomography. Cerebral Cortex. 1995;5:79–93. doi: 10.1093/cercor/5.1.79. [DOI] [PubMed] [Google Scholar]
- 62.Ronnlund M, Nyberg L, Backman L, Nilsson LG. Stability, growth, and decline in adult life span development of declarative memory: cross-sectional and longitudinal data from a population-based study. Psychol Aging. 2005;20:3–18. doi: 10.1037/0882-7974.20.1.3. [DOI] [PubMed] [Google Scholar]
- 63.Rypma B, D'Esposito M. Isolating the neural mechanisms of age-related changes in human working memory. Nat Neurosci. 2000;3:509–515. doi: 10.1038/74889. [DOI] [PubMed] [Google Scholar]
- 64.Sarter M, Bruno JP. Cognitive functions of cortical acetylcholine: toward a unifying hypothesis. Brain Res Brain Res Rev. 1997;23:28–46. doi: 10.1016/s0165-0173(96)00009-4. [DOI] [PubMed] [Google Scholar]
- 65.Sayala S, Sala JB, Courtney SM. Increased Neural Efficiency with Repeated Performance of a Working Memory Task is Information-type Dependent. Cereb Cortex. 2005 doi: 10.1093/cercor/bhj007. [DOI] [PubMed] [Google Scholar]
- 66.Schacter DL, Rieman E, Uecker A, Polster MR, Yun LS, Cooper LA. Brain regions associated with retrieval of structurally coherent visual information. Nature. 1995;376:587–590. doi: 10.1038/376587a0. [DOI] [PubMed] [Google Scholar]
- 67.Schacter DL, Savage CR, Alpert NM, Rauch SL, Albert MS. The role of the hippocampus and frontal cortex in age-related memory changes: a PET study. NeuroReport. 1996;7:1165–1169. doi: 10.1097/00001756-199604260-00014. [DOI] [PubMed] [Google Scholar]
- 68.Scheibel A. Handbook on the Psychology of Aging. Fourth Edition. Academic Press, Inc.; 1996. Structural and functional changes in the aging brain. [Google Scholar]
- 69.Schochet SS. Neuropathology of Aging. Neurol Clin. 1988;16:569–580. doi: 10.1016/s0733-8619(05)70081-5. [DOI] [PubMed] [Google Scholar]
- 70.Schonknecht P, Pantel J, Kruse A, Schroder J. Prevalence and natural course of aging-associated cognitive decline in a population-based sample of young-old subjects. Am J Psychiatry. 2005;162:2071–2077. doi: 10.1176/appi.ajp.162.11.2071. [DOI] [PubMed] [Google Scholar]
- 71.Shock NW, Greulich RC, Andres R, Arenberg D, Costa PT, Jr, Lakatta E, Tobin JD. Normal human aging: the Baltimore Longitudinal Study of Aging. Washington, D.C.: U.S. Government Printing Office; 1984. [Google Scholar]
- 72.Talairach J, Tournoux P. Co-planar stereotaxic atlas of the human brain. New York: Thieme Medical Publishers, Inc.; 1988. [Google Scholar]
- 73.Tomasi D, Ernst T, Caparelli EC, Chang L. Practice-induced changes of brain function during visual attention: a parametric fMRI study at 4 Tesla. Neuroimage. 2004;23:1414–1421. doi: 10.1016/j.neuroimage.2004.07.065. [DOI] [PubMed] [Google Scholar]
- 74.Van der Werf YD, Scheltens P, Lindeboom J, Witter MP, Uylings HB, Jolles J. Deficits of memory, executive functioning and attention following infarction in the thalamus; a study of 22 cases with localised lesions. Neuropsychologia. 2003;41:1330–1344. doi: 10.1016/s0028-3932(03)00059-9. [DOI] [PubMed] [Google Scholar]
- 75.van Turennout M, Bielamowicz L, Martin A. Modulation of neural activity during object naming: effects of time and practice. Cereb Cortex. 2003;13:381–391. doi: 10.1093/cercor/13.4.381. [DOI] [PubMed] [Google Scholar]
- 76.Wiltgen BJ, Brown RA, Talton LE, Silva AJ. New circuits for old memories: the role of the neocortex in consolidation. Neuron. 2004;44:101–108. doi: 10.1016/j.neuron.2004.09.015. [DOI] [PubMed] [Google Scholar]
- 77.Yue NC, Arnold AM, Longstreth WT, Jr, Elster AD, Jungreis CA, O'Leary DH, Poirier VC, Bryan RN. Sulcal, ventricular, and white matter changes at MR imaging in the aging brain: data from the cardiovascular health study. Radiology. 1997;202:33–39. doi: 10.1148/radiology.202.1.8988189. [DOI] [PubMed] [Google Scholar]