Abstract
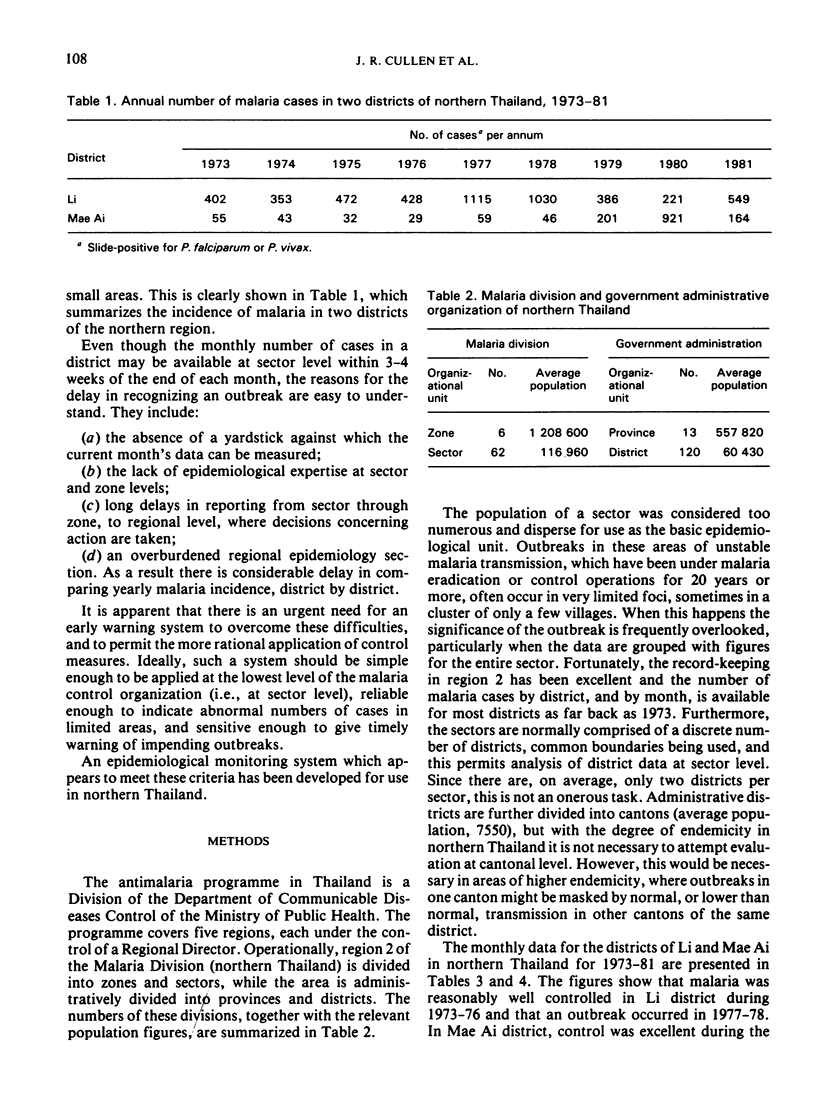
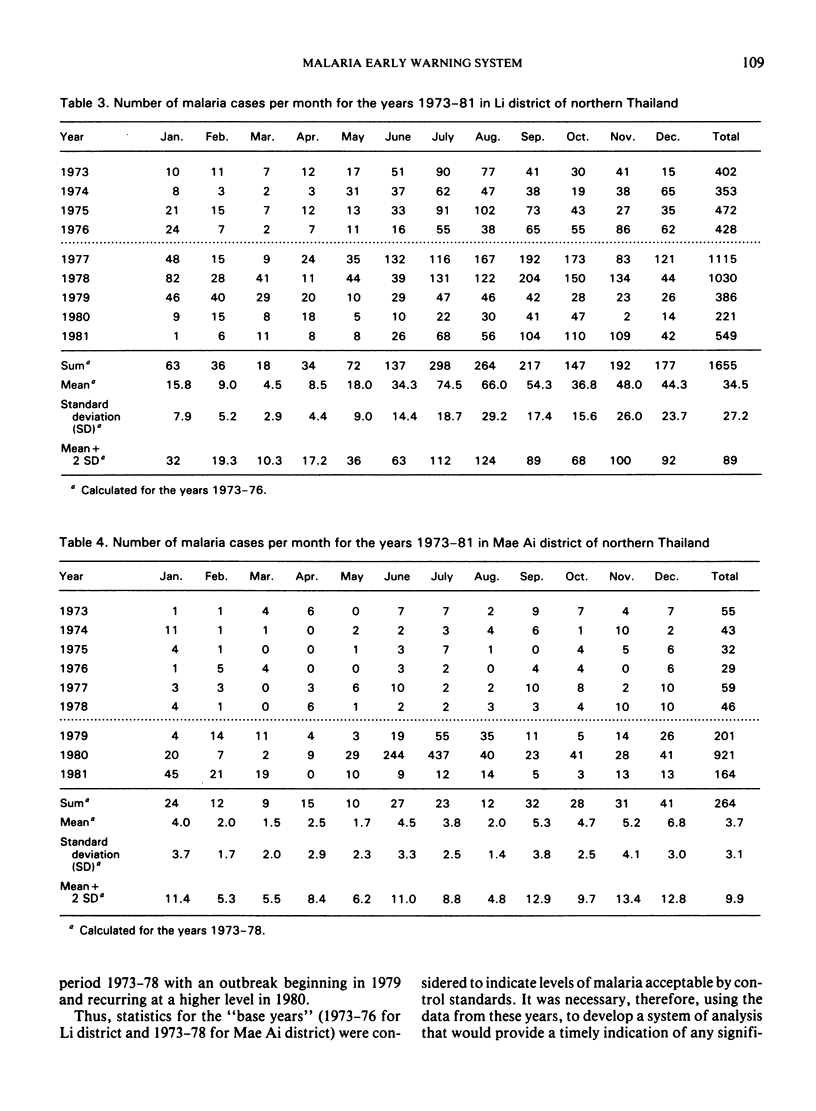
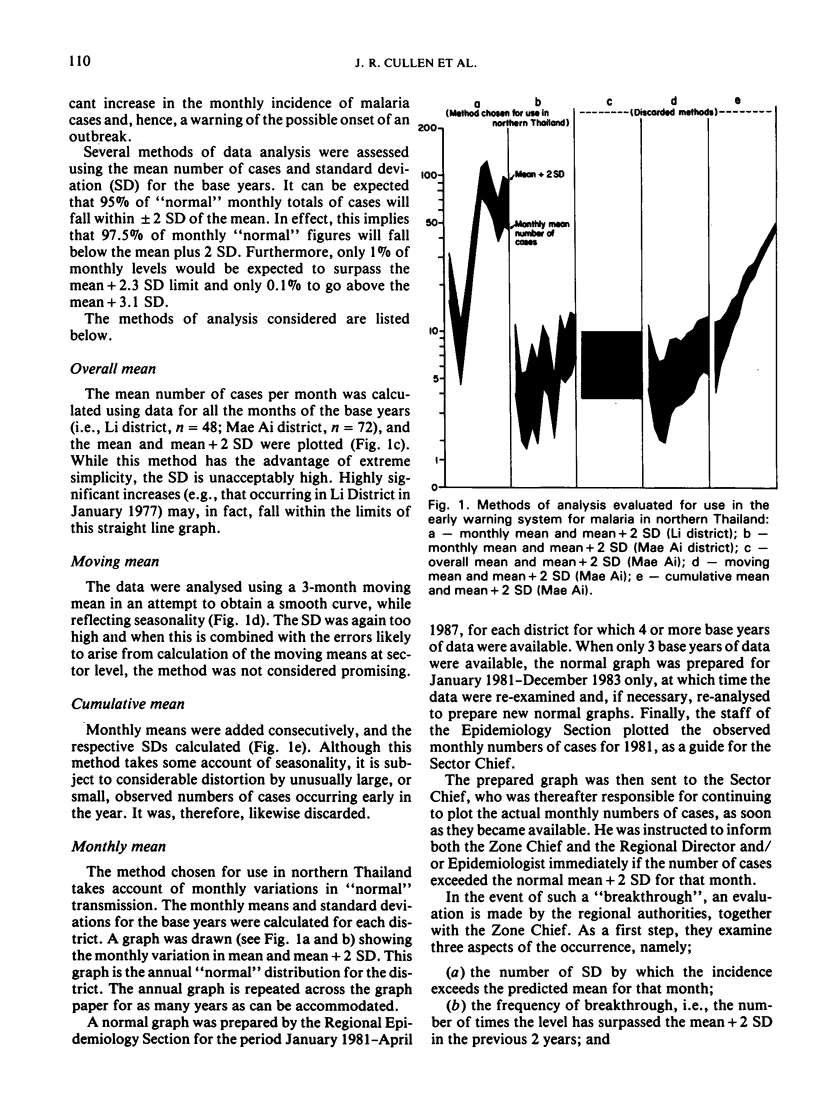
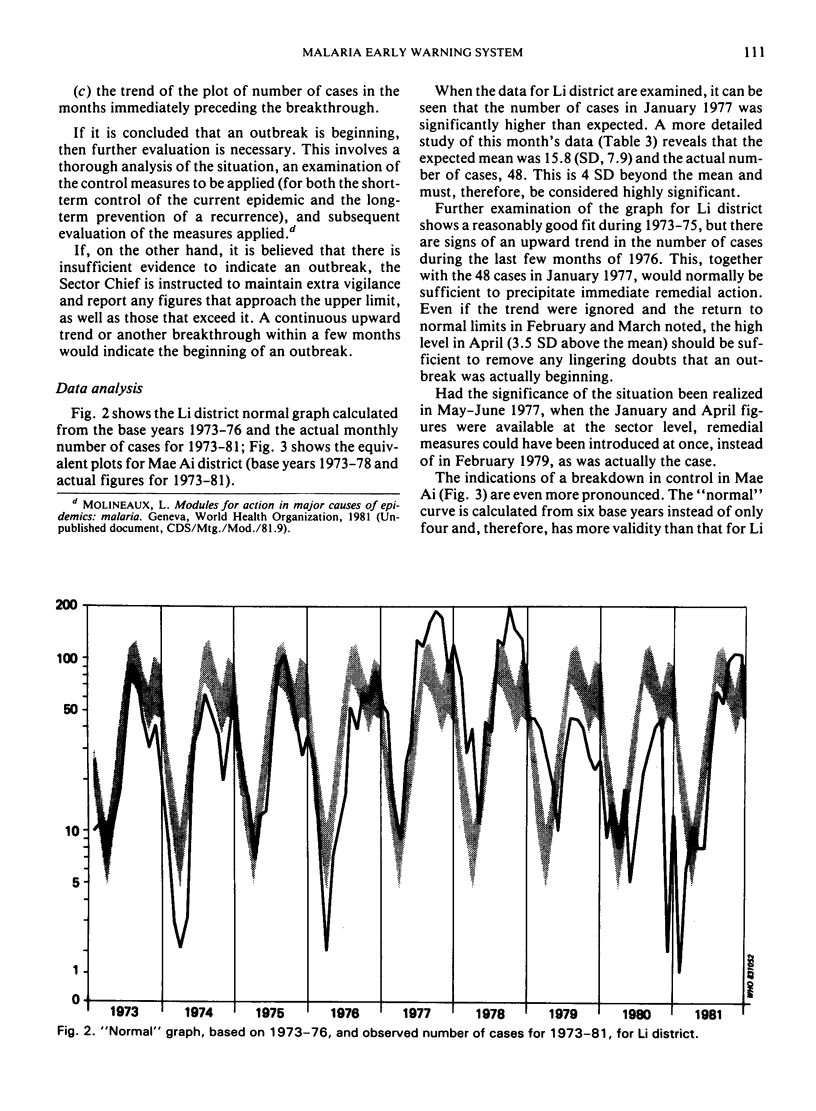
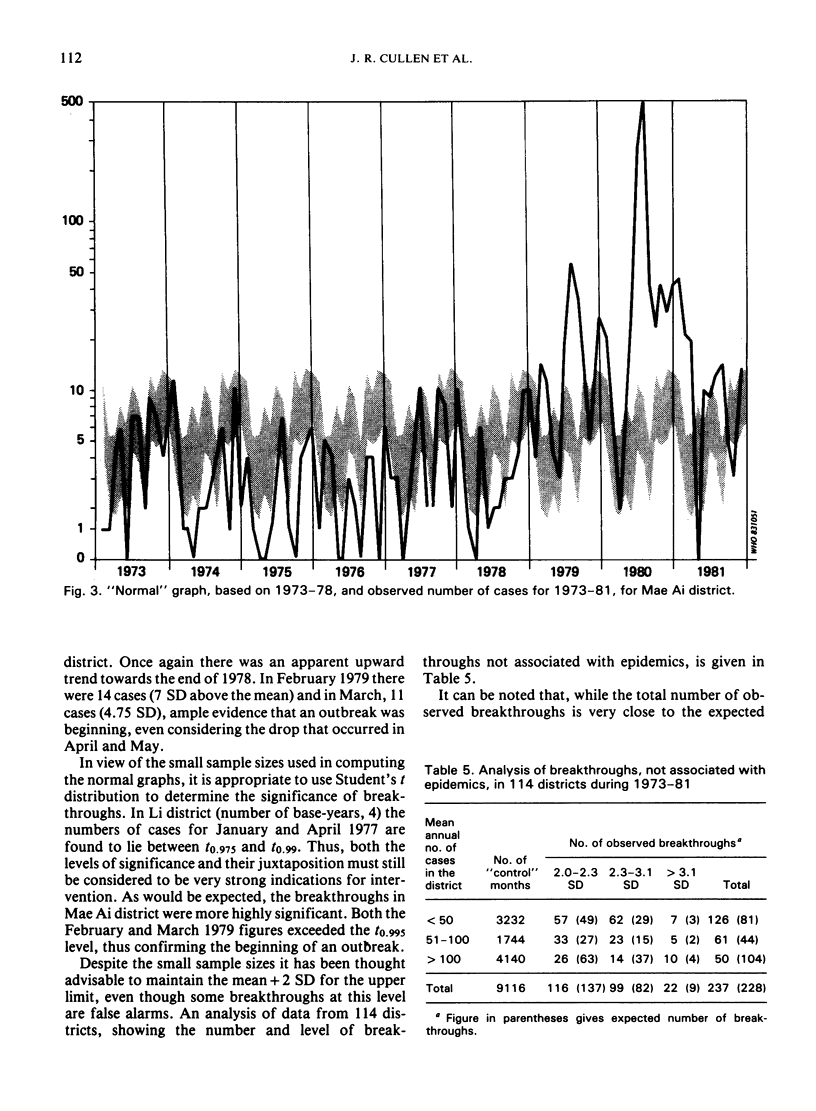
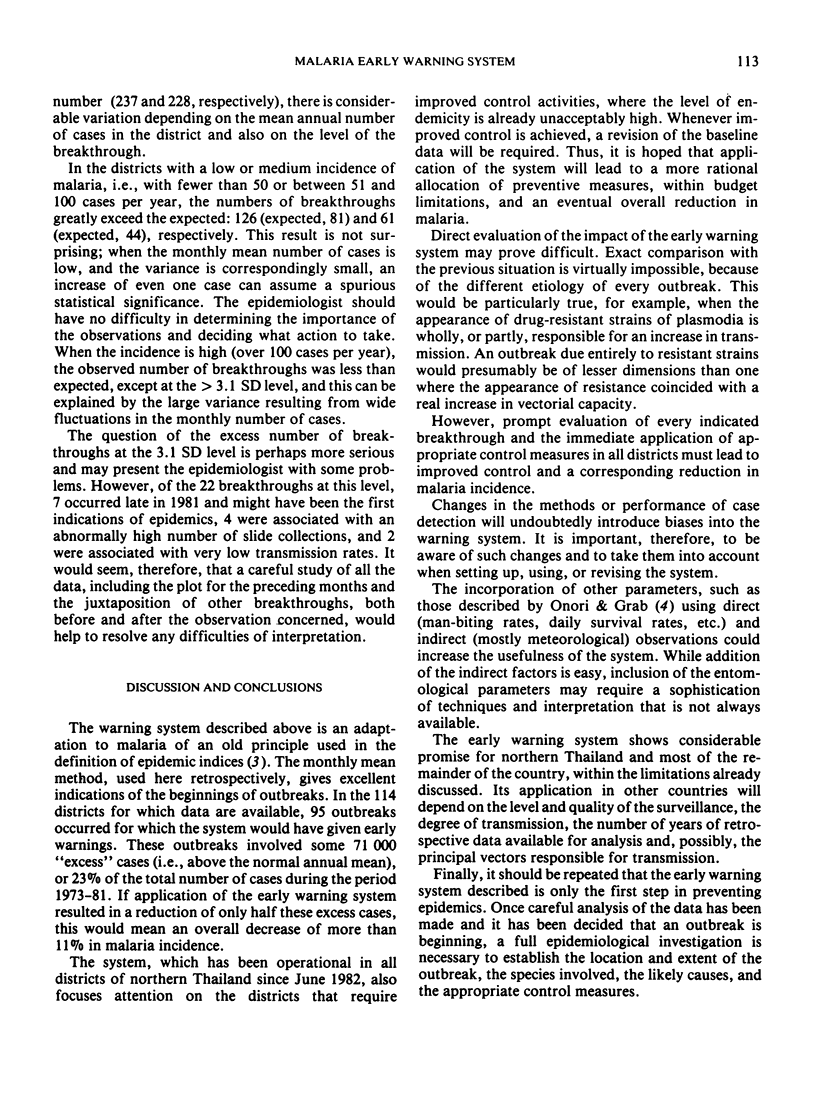
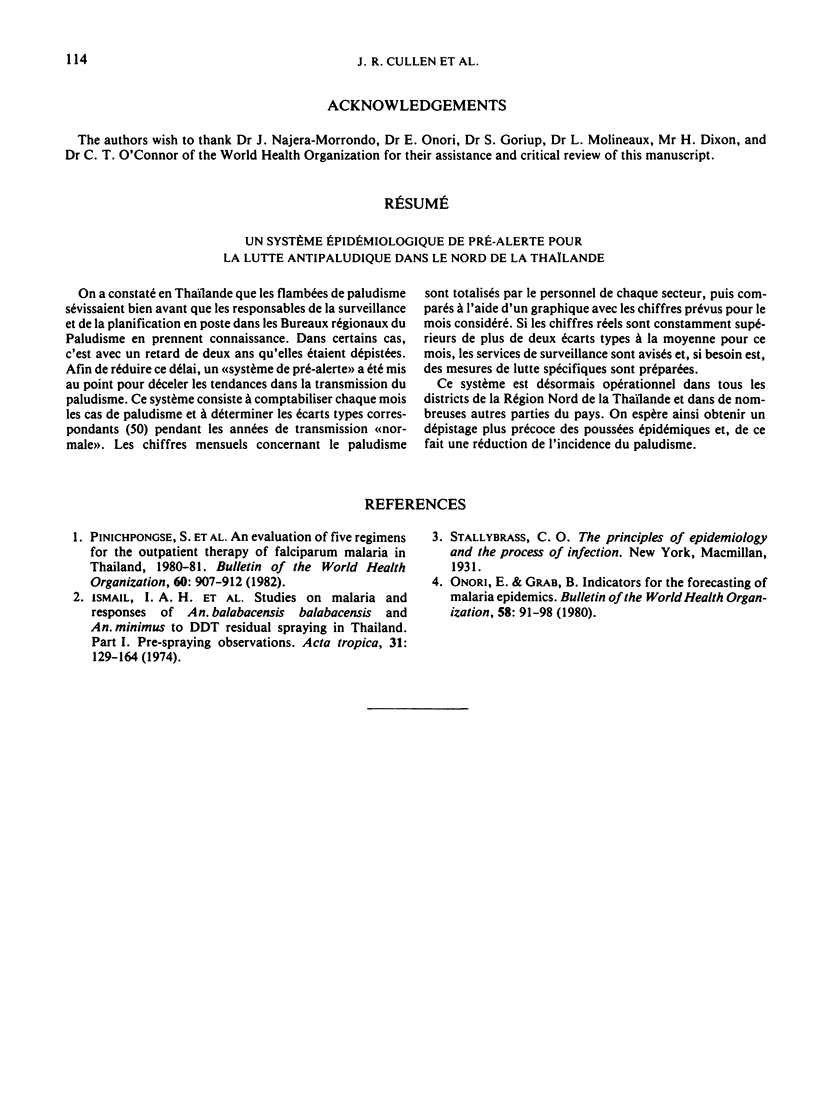
Parasitological data for the years 1973-81 were examined to determine the years of “acceptable” or “normal” transmission of malaria, for every district of northern Thailand. The monthly mean number of cases and the mean plus 2 standard deviations (SD) were calculated for the selected years and plotted on log-linear graph paper. The resulting graphs were distributed to the Malaria Sector Offices. Sector Chiefs were then responsible for plotting the monthly observed number of cases of malaria as the data became available; if the observed incidence was more than 2 SD greater than the “normal” mean for that month, the Zone and Regional Malaria Offices were informed. Retrospective analysis of data from districts where malaria outbreaks had occurred indicated that the method provides an effective warning of impending epidemics. It is expected that the resulting earlier implementation of appropriate remedial control measures will lead to a reduction in malaria incidence in the region.
Full text
PDF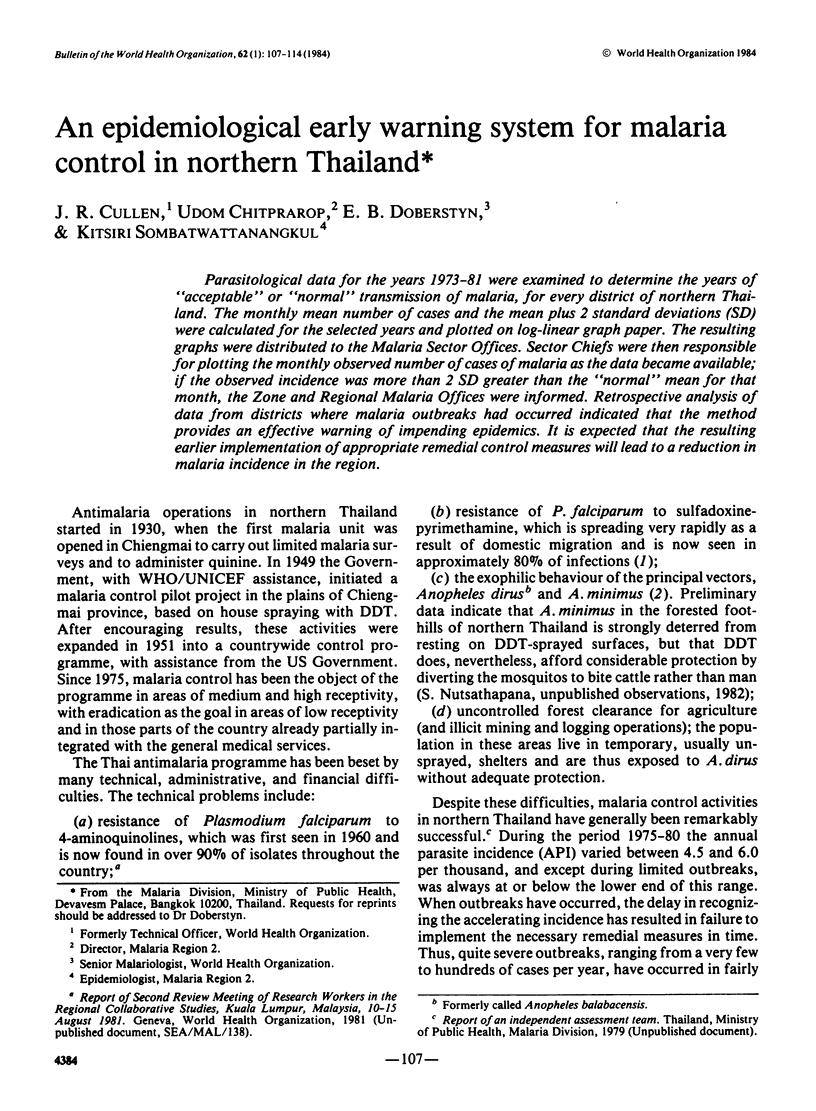
Selected References
These references are in PubMed. This may not be the complete list of references from this article.
- Ismail I. A., Notananda V., Schepens J. Studies on malaria and responses of Anopheles balabacensis balabacensis and Anopheles minimus to DDT residual spraying in Thailand. I. Pre-spraying observations. Acta Trop. 1974;31(2):129–164. [PubMed] [Google Scholar]
- Onori E., Grab B. Indicators for the forecasting of malaria epidemics. Bull World Health Organ. 1980;58(1):91–98. [PMC free article] [PubMed] [Google Scholar]
- Pinichpongse S., Doberstyn E. B., Cullen J. R., Yisunsri L., Thongsombun Y., Thimasarn K. An evaluation of five regimens for the outpatient therapy of falciparum malaria in Thailand 1980-81. Bull World Health Organ. 1982;60(6):907–912. [PMC free article] [PubMed] [Google Scholar]


