

Abstract
Objective
To investigate the difference of neck fat tissue distribution by sex and its correlation with retropalatal and retroglossal airway.
Study Design
38 consecutive patients (Male:19;Female:19) who received a CT scan were compared in the retroglossal region and at the narrowest cross-section of the airway. Retroglossal fat tissue volume (FV) was segmented with Amira software and separated into subcutaneous and internal fat volume (SFV, IFV). These volumes were normalized by retroglossal neck volume (NV).
Results
Men had 51.9% more IFV/NV and 64.4% less SFV/NV compared to the women. Age-adjusted BMI was negatively correlated with retroglossal airway volume (normalized by NV) and with the lateral width of the smallest cross-section airway (LW) in females. In males the IFV/NV was negatively correlated with LW, after adjusting for BMI and age.
Conclusion
Upper airway collapsibility analysis is needed to rule out whether increased BMI or IFV causes an increase in airway collapsibility.
Keywords: Fat tissue, Obstructive sleep apnea, airway configuration, computed tomography, airway volume, 3D imaging
1. Introduction
Epidemiology studies have shown that obstructive sleep apnea (OSA) has a clear difference in prevalence when comparing men and women of similar age with the ratio being in the range of 2:1 males to females. 1 2 3 4 A recent dynamic study with CT by Yucel et al. found in a group of 24 snorers, 27 mild/moderate and 20 severe OSA patients that severe OSA was in fact more common in men than in women even if the women in the study had greater Body Mass Index (BMI). In addition, the female-to-male ratio declined with increasing Apnea-Hypoapnea Index (AHI).5 The authors also found a correlation between neck circumference (an index of local adiposity in the context of OSA) and AHI, soft palate length and MP-H (distance from mandibular plane to the hyoid bone).
One factor that has been offered to explain the increased prevalence of OSA in men compared to women is that they have differing patterns of fat deposition and these fat tissue deposits may contribute to airway collapse. 6 7 8 9 For example, it is known that after puberty women preferentially deposit more fat peripherally (except on the stomach) and on the buttocks, thighs, or gluteofemoral region than men. Men lose fat from lower body parts and begin depositing fat centrally (or intra-abdominally) and on upper parts (shoulder, abdomen, and nape of the neck).
A recent study specifically examined whether body fat and/or neck fat distribution was associated with OSA in men. 10 Specifically, this study collected MRI imaging of both the abdomen and neck area to examine total abdominal and neck fat in 85 consecutive male patients who were referred to a sleep center for suspected OSA. They subdivided the neck fat into subcutaneous neck fat and parapharyngeal fat tissue and all subjects had an overnight polysomnogram allowing individual AHI scores to be calculated. They performed a linear regression analysis for predictors of AHI and reported that it was significantly correlated with intra-abdominal fat and subcutaneous abdominal fat, but subcutaneous fat in the neck region and parapharyngeal fat in the airway were not significantly correlated with AHI. On the other hand, in a group of 18 OSAS with higher BMI and larger neck circumference than the 11 controls included in the study, Hora et al. found in awake patients using MRI that the transversal (lateral) dimension of the airway at the retroglossal level was an independent predictor of OSAs, and this lateral narrowing of the airway was not associated with increased fat pad thickness. 11 The authors conclude that the narrowing of the lateral airway is due to parapharyngeal muscular hypertrophy not the accumulation of fat. This conclusion agrees with the findings of Ciscar et al., who found in obese subjects that the parapharyngeal fat increase was not related to OSAS. 12 Schwab et al. 13 found that enlargement of the nonadipose soft tissue structures were associated with OSAS. Hora el al. conclude that differences in the size of upper airway structures between patients and controls could not simply be explained by fat deposition at this level.
The above results are in conflict with other studies in the literature. For example, one study examined fat tissue in the neck using MRI in 12 obese but non-apneic women on a weight loss program. 14 They reported there was an increase in the upper airway volume in both the retropalatal and retroglossal regions following a mean weight loss of 17.1 kg (17.3% of their initial weight). This weight loss produced a retroglossal increase in upper airway volume of 55.8% and a retropalatal increase of 28.8%. Another study examined whether local fat deposition around the upper airway may be different in non-obese patients with OSA (BMI < 30) from that in normal subjects with the same body mass using MRI. 15 This study included 9 non-obese, non-snoring control subjects (BMI = 25; age = 37.5), 9 non-obese patients with OSA (BMI = 25.7; age = 40), and 9 obese patients with OSA (BMI = 34; age = 40). Neck volume and fat content were assessed from the hard palate to the vocal cords using T1-weighted images. They found higher total body fat in non-obese and obese patients with OSA than their control subjects. In addition, neck tissue volume was 10% greater in non-obese and 28% greater in obese patients with OSA than in control subjects. The percentage of neck tissue volume attributed to fat was 27% greater in non-obese and 67% greater in obese patients with OSA than control subjects. They concluded that even relatively non-obese patients with OSA have excess fat deposition, especially anterolateral to the upper airway when compared with control subjects with the same level of obesity assessed using BMI and neck circumference. They speculated that fat tissue accumulation in the neck contributes to a predisposition to OSA. Finally, Shelton et al. studied 30 male with and without OSA before and after weight loss. 16 All subjects had a collection of fat tissue adjacent to the upper airway; the volume of this fat tissue correlated with the number of apneas and hypoapneas per hour of sleep (R = 0.59, p < 0.001). Both OSA and non-OSA patients after weight loss had fewer apneas and hypopneas and had a marked decrease in the pharyngeal fat tissue volume. These authors concluded that fat tissue is deposited adjacent to the pharyngeal airway in patients with OSA and that the volume of this tissue is related to the presence and degree of OSA. Cosentini et al. using MRI studied 28 OSA patients and found that an increase of neck adipose tissue (subjective measure) was significantly correlated with BMI, with a low nocturnal oxygen saturation, with a high percentage of sleeping time with oxygen saturation lower than 90%, and with the axial-section shape of the minimal pharyngeal area. 17 Malhotra et al. found in 38 patients that older patients had increased parapharyngeal fat pad size independent of body mass index, thus potentially increasing the upper airway resistance. 18
With regard to male-female differences of neck fat tissue a recent study examined the fat deposition in the neck (defined as the area from top of palate to top of larynx) of 10 normal adult men (mean age 36 years) and 10 normal adult women (mean age 37 years) using MRI imaging. 19 These subjects had equivalent body mass indexes (mean BMI = 25) and they found that total neck soft tissue volume was greater in men (29% smaller in women) but the total volume of neck fat was not significantly different with only a 6% larger volume in men. Interestingly, when they reported fat as a percent of total soft tissue, to correct for the fact that male necks were larger, they found that percent of fat volume was significantly higher in the necks of women (22% for men and 29% for women). Whittle et al. study concludes that there are differences in neck fat deposition between the sexes which, together with the greater overall soft tissue loading on the airway in men, may be factors in the sex distribution of OSAS.
Because of the above conflicting study results and because there have been very few studies that have focused on the sex differences of fat tissue distribution in the upper airway region, we undertook our current study. In it, we examine both subcutaneous fat and the internal fat (excluding subcutaneous fat) in the neck in a retroglossal axial slab (between tip of the soft palate and the top of the epiglottis). We also examine the difference of fat tissue distribution between men and women and look at the correlation of age and BMI with fat tissue volume. Finally we examine if neck fat tissue accumulation is associated with retroglossal volume or retropalatal (using a single axial CT at the narrowest cross-section of the airway) airway size.
2. Subjects and Methods
Subjects
In this study, the subjects were a mixed diagnostic group of 38 consecutive Japanese patients (male: 19, female: 19) who had spiral CT’s taken to further examine their maxillofacial and cervical structures as part of their diagnostic assessment. These patients were seeking treatment for one of several clinical problems including OSA (n=16; M=12; F=4), snoring (n=5; F=5), malocclusion (Anterior Open Bite) (n=7; M=3; F=4), temporomandibular disorders (n = 3, F=3), osteoarthritis (n=2; F=2), minor jaw deformity (n=2 (M=1; F=1), uncomfortable occlusion (n=1; M=1), enlarged torus (n=1; M=1) and possible mandibular fracture (n=1; M=1) at the Tsurumi university dental hospital. As indicated above, a subset of 16 of these subjects had OSA/snoring problems and also had a polysomnogram (mean AHI was 23.8 ± 14.57). The other patients did not have polysomnograms but based on clinical interview, they did not exhibit hypersomonlence or loud snoring symptoms. The age and BMI for the subjects separated by gender is presented in Table 2. The patients gave written consent to participate in this study approved by the Ethics Committee at Tsurumi university dental hospital.
Table 2.
Comparison of each parameter in men and women (independent t-test)
| Variable | Men (n = 19) mean ± one s.d. |
Women (n = 19) mean ± one s.d. |
p value |
|---|---|---|---|
| Age (years) | 51.2 ± 16.07 | 52.9 ± 16.18 | 0.734 |
| BMI (kg/m2) | 23.0 ± 2.52 | 21.9 ± 3.62 | 0.064† |
| Retroglossal Airway Slab | |||
| Distance between uvula and epiglottis (mm) | 14.7 ± 4.17 | 13.1 ± 2.68 | 0.148 |
| Retroglossal neck volume (NV) (cm3) | 271.1 ± 66.26 | 211.3 ± 44.48 | 0.002 |
| Retroglossal fat volume (FV) (cm3) | 46.3 ± 21.24 | 41.3 ± 18.14 | 0.436 |
| Subcutaneous fat volume (SFV) (cm3) | 24.6 ± 10.45 | 29.9 ± 11.82 | 0.155 |
| Internal fat volume (IFV) (cm3) | 21.7 ± 12.17 | 11.4 ± 6.83 | 0.003 |
| Anterior Internal fat volume (AIFV) (cm3) | 7.1± 4.66 | 4.4± 3.20 | 0.044 |
| Posterior Internal fat volume (PIFV) (cm3) | 14.6± 8.49 | 7.0± 4.21 | 0.002 |
| Airway volume (AWV) (cm3) | 4.2 ± 2.10 | 4.0 ± 2.02 | 0.810 |
| Fat as a percent of NV (%) | 17.0 ± 6.13 | 19.1 ± 5.91 | 0.296 |
| Subcutaneous fat as a percent of NV (%) | 9.0 ± 3.18 | 13.8± 3.52 | <.0001 |
| Internal fat as a percent of NV (%) | 7.9 ± 3.59 | 5.2 ± 2.63 | 0.012 |
| Anterior Internal fat volume as a percent of NV (%) | 2.7± 1.61 | 2.0± 1.28 | 0.162 |
| Posterior Internal fat volume as a percent of NV (%) | 5.3± 2.40 | 3.2± 1.64 | 0.004 |
| Airway volume as a percent of NV (%) | 1.6 ± 0.94 | 1.9 ± 0.86 | 0.316 |
| Internal fat as a percent of fat volume (%) | 46.0 ± 8.73 | 25.9 ± 6.24 | < .0001 |
| Retropalatal Airway Slice | |||
| Anterior-posterior at narrowest airway slice (AP)(mm) | 4.4 ± 2.88 | 6.6 ± 3.32 | 0.038 |
| Lateral width at narrowest airway slice (LW) (mm) | 16.3 ± 6.61 | 20.4 ± 7.58 | 0.084 |
Mann-Whitney U-test, non-parametric due to right skewed data.
Device and Software
The spiral CT imaging of the airway was performed using a Radix Prima (Hitachi Medical Co.). The parameters used for the imaging were tube voltage = 120 kV; tube current = 75 mA; irradiation time = 1s; scan = volume scan; slice thickness = 1 mm; table speed = 1 mm/s). From the resulting data, the fat tissue was extracted using image analysis software Amira 3.1 (Mercury Computer Systems / 3D Viz group, San Diego, CA) to reconstruct three-dimensional images and to measure the fat volume. Segmentation was performed automatically based on Hounsfield units (details are provided in next section).
Investigation items
Table 1 presents the items examined in this paper and their acronyms. Two main areas of interest were included for this analysis. The first was an axial retroglossal slab (multiple contiguous 1 mm slices) defined superiorly by the most inferior tip of the soft palate and inferiorly by the most superior tip of the epiglottis (Figure 1). The retroglossal area was selected for study because it was previously shown by Welch et al, (2002) that weight loss produced a larger change in airway diameter here versus a retropalatal area. 14 Our second area of interest was a single axial slice where the airway had its smallest cross-sectional area which is almost always found retropalatally (Figure 2). At the time of imaging, the patients were in a supine position and their head was carefully positioned so that their Frankfort line was perpendicular to the horizontal axis of the device. Within the axial slab shown in Figure 1 we calculated the retroglossal neck volume (NV) from the number of voxels with CT Hounsfield units (HU) 20 ranging from −200 HU to a patient-specific maximum value (to include the soft tissues and hard tissues but not the air). Retroglossal fat volume (FV) within this slab was calculated from the number of voxels that were included in the CT value range from −200 HU to −50 HU. Fat tissue was separated into subcutaneous fat volume (SFV) and other internal fat volume (IFV) (Figure 3). Airway volume (AWV) within this slab was calculated from the number of voxels that had a CT value range from a minimum value (CT value −2000 HU) to −200 HU (to exclude soft and hard tissues) (Figure 4). We did examine for regional internal fat tissue differences (e.g. anterior versus posterior of airway) by separating the internal fat tissue volume into fat that was anterior to anterior border of the spine (AIFV) and fat behind this dividing line (PIFV). To try to minimize the effect of different neck sizes between males and females on our analysis of fat tissue volume, we normalized our data into percentage scores by dividing the retroglossal fat tissue volumes (FV, IFV, AIFV, PIFV) and the airway volume (AWV) by the retroglossal neck volume (NV). We also measured the anterior-posterior (AP) diameter and lateral width (LW) of the narrowest airway cross-section between posterior nasal spine and top of the epiglottis (Figure 2).
Table 1.
Parameters measured in this study and their acronyms.
| Parameter | Acronym or Formula |
|---|---|
| Body Mass Index (kg/m2) | BMI |
| Retroglossal Airway Slab | |
| Retroglossal neck volume (cm3) | NV |
| Retroglossal fat volume (cm3) | FV |
| Subcutaneous fat volume (cm3) | SFV |
| Internal fat volume (cm3) | IFV |
| Anterior Internal fat volume (cm3) | AIFV |
| Posterior Internal fat volume (cm3) | PIFV |
| Airway volume (cm3) | AWV |
| Fat as a percent of neck volume (%) | 100 × FV/NV |
| Subcutaneous fat as a percent of neck volume (%) | 100 × SFV/NV |
| Internal fat as a percent of neck volume (%) | 100 × IFV/NV |
| Anterior Internal fat volume as a percent of NV (%) | 100 × AIFV/NV |
| Posterior Internal fat volume as a percent of NV (%) | 100 × PIFV/NV |
| Airway volume as a percent of total neck volume (%) | 100 × AWV/NV |
| Internal fat as a percent of total fat volume (%) | 100 × IFV/FV |
| Retropalatal Airway Slice | |
| Anterior-posterior width at narrowest airway slice (mm) | AP |
| Lateral width at narrowest airway slice (mm) | LW |
Figure 1.
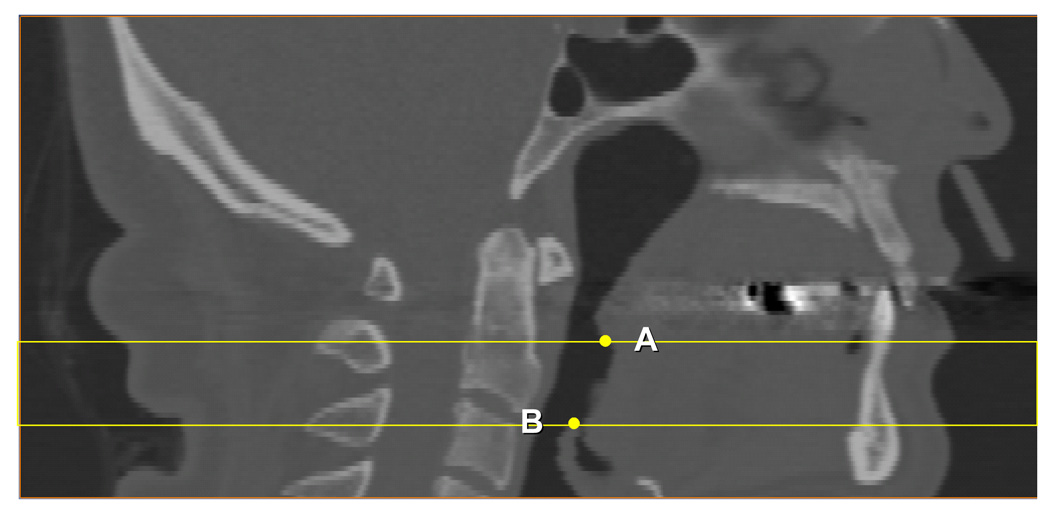
Retroglossal region investigated in this paper: CT slices were 1mm a part between the tip of the soft palate (A) and the top of epiglottis (B).
Figure 2.
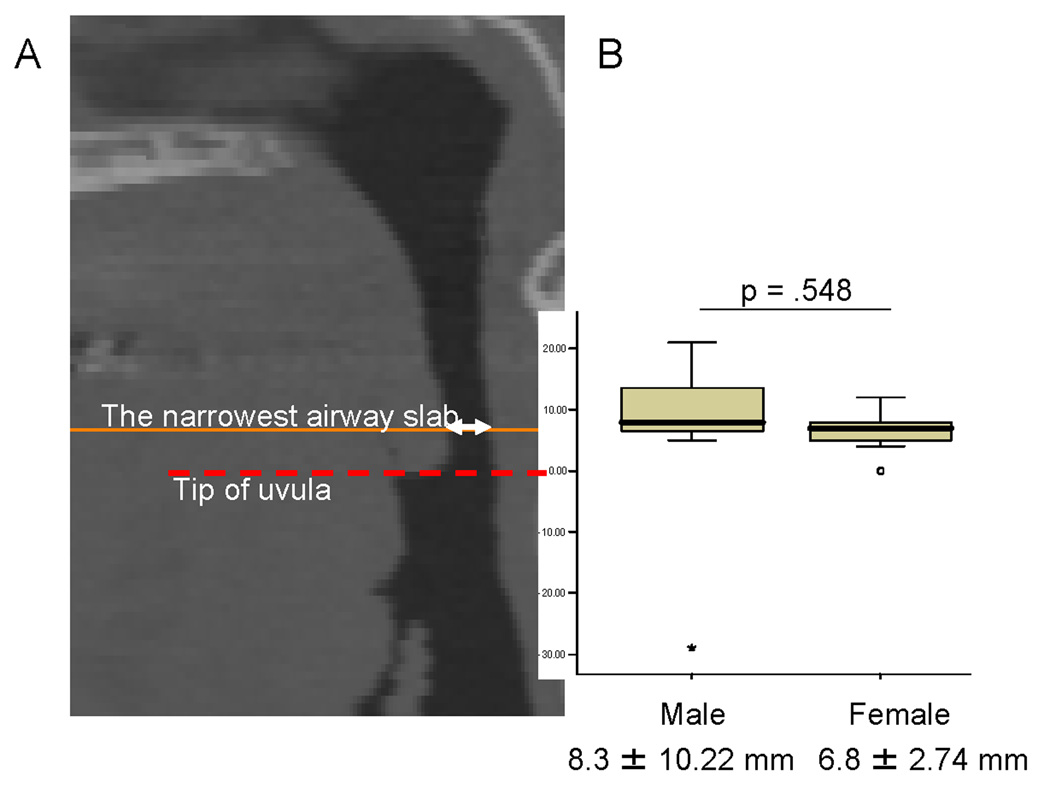
The distance of the narrowest airway cross-section from the tip of the uvula (A), and the results of the t-test comparing this distance in men versus women (B).
Figure 3.
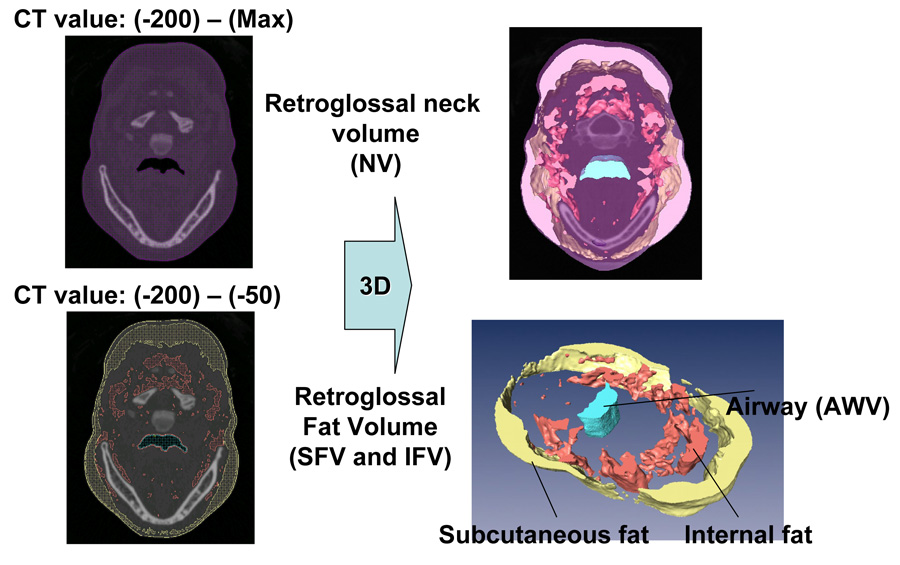
Segmentation (left) and 3D reconstruction (right) for retroglossal neck volume (NV), airway volume (AWV), and fat volume (FV) subdivided in subcutaneous fat volume (SFV) and internal fat volume (IFV).
Figure 4.
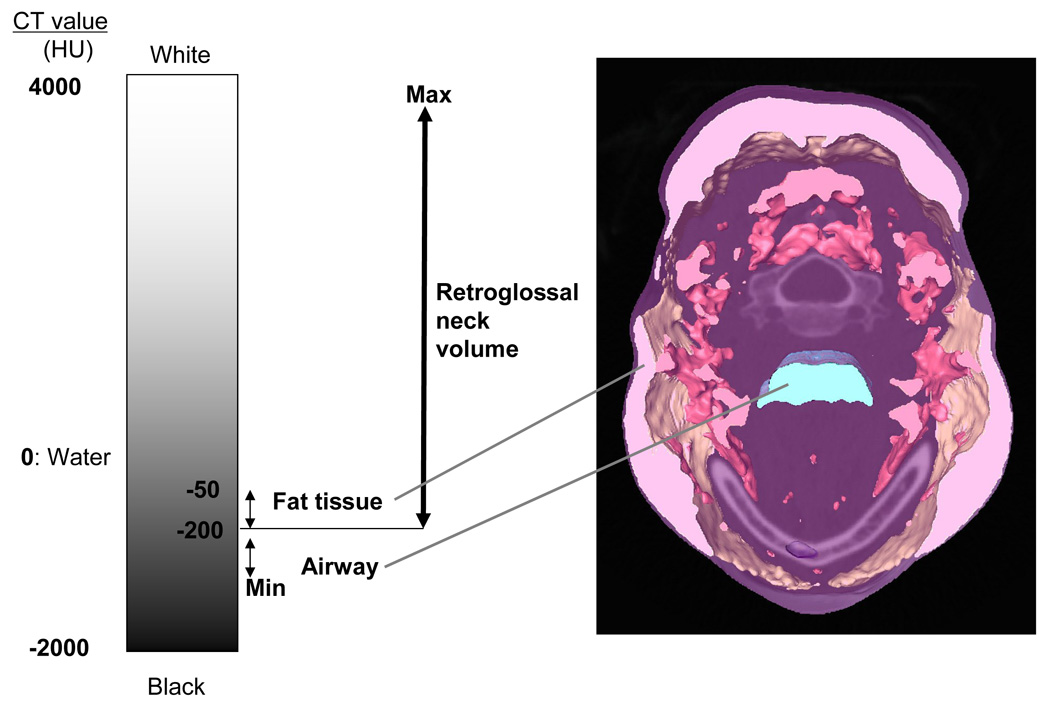
CT values in Hounsfield units used in this investigation to segment retroglossal neck volume (NV), and airway volume (AWV). Retroglossal fat volume (FV) was then segmented from the NV using CT values between −50HU and −200 HU.
Statistical analysis
Data were analyzed by gender and statistical calculations performed using SAS 9.1 (SAS Institute Inc., Cary, NC, USA). Because of the substantial right skew in BMI, non-parametric statistical methods were preferred for any analysis containing this covariate. The skew was decreased by log transformation however, it failed to pass the formal normality test of Kolmogorov-Smirnov (p<0.05) and we are particularly interested in the changes at the upper (obese) end of the distribution. The Mann-Whitney test was used to compare median values of BMI between the two independent samples, while mean values were compared for all normally distributed variables (anatomical volumes and lengths, AP, LW and age) with independent sample t-tests. All continuous variables are quoted as means ± one standard deviation. We used Spearman’s test to conduct simple and partial correlations between our anatomical variables and BMI and age, due to the non-normality of BMI. We conducted linear regression with ANOVA on BMI and age. The linear regression assumptions of linearity, homoscedasticity and normality of the residuals were successfully evaluated. Statistical significance was defined as p<0.05.
3. Results
Descriptive statistics and p-values for the independent t-tests comparing both genders on age, the length of the retroglossal slab in mm, the anterior-posterior (AP) diameter and lateral width (LW) of the narrowest airway cross-section between the hard palate and the tip of the epiglottis, the anatomical volumes (neck, fat, subcutaneous fat, internal fat, anterior internal fat, posterior internal fat, and the airway volumes), and the above volumes normalized by neck volume are shown in Table 2. Non-parametric Mann-Whitney U-test was used to compare male and female median BMI since these data were found to be right skewed. In this Table, five of the variables (AP, NV, IFV, AIFV, PIFV) were found to have a statistically significant sex difference with the men having smaller AP distance, larger neck volume and more internal fat (anterior and posterior) than the women in the retroglossal region. Because the above differences could be accounted for by the fact that men had a larger (28%) neck volume and longer retroglossal region (mean distance between tip of soft palate and top of the epiglottis is 1mm longer in men than females), we normalized by neck volume by computing fat/internal fat (anterior and posterior)/subcutaneous fat/airway volume as a percent of the total neck volume. After normalization, internal fat (posterior) and subcutaneous fat as a percent of the neck volume also showed sex differences with the men having a 2.7% more internal fat as a percent of neck volume (p=.012), which corresponds to an increase of 51.9% more IFV/NV than females, and a 2.1% more posterior internal fat (corresponding to an increase of 65.6% larger PIFV/NV in males). Males also had 5.8% less subcutaneous fat as a percent of neck volume (p<.0001) than our female subjects, which corresponds to a 64.4% decrease. The mean narrowest cross-section of the upper airway was found 8.3mm above the tip of the uvula in males and 6.8mm in females, however there were no statistical significant differences in mean location of the smallest cross-section between the two groups (p=.548) (Figure 2).
In Table 3 we present the results of the linear correlations (Spearman’s correlation coefficients) between fat, internal fat and airway as a percent of NV, AP and LW and the covariates age and BMI. These r values were calculated for each gender independently. In males, fat volume increases significantly with BMI. In females, retroglossal airway volume and retropalatal lateral width (LW) decrease significantly with BMI. Age was no significantly correlated with any of the variables of interest.
Table 3.
Simple and partial correlations between fat, internal fat and airway volumes (as a percent of retroglossal neck volume), with covariates BMI and age.
| Dependent variable |
BMI (unadjusted) r value† (p score) |
BMI (age adjusted) r value† (p score) |
AGE (unadjusted) r value† (p score) |
AGE (BMI- adjusted) r value† (p score) |
|---|---|---|---|---|
| Males only (n=19) | ||||
| Retroglossal Airway Slab | ||||
| Fat volume as a percent of NV | 0.551 (p = .015) | 0.555 (p = .017) | 0.121 (p = .621) | 0.147 (p = .561) |
| Internal Fat as a percent of NV | 0.421 (p = .072) | 0.426 (p = .078) | 0.135 (p= 0.581) | 0.150 (p = .552) |
| Airway volume as a percent of NV | −0.191 (p = .433) | −0.195 (p = .439) | 0.204 (p = .403) | 0.207 (p = .410) |
| Retropalatal Airway Slice | ||||
| AP (mm) | −0.006 (p = .980) | −0.007 (p = .979) | −0.132 (p = .590) | −0.132 (p = .602) |
| LW (mm) | −0.198 (p = .415) | −0.201 (p = .429) | 0.159 (p = .515) | 0.162 (p = .521) |
| Females only (n=19) | ||||
| Retroglossal Airway Slab | ||||
| Fat volume as a percent of NV | 0.396 (p = .093) | 0.310 (p = .211) | 0.357 (p = .133) | 0.254 (p = .309) |
| Internal Fat as a percent of NV | 0.365 (p = .124) | 0.250 (p = .317) | 0.442 (p = .058) | 0.360 (p = .142) |
| Airway volume as a percent of NV | −0.526 (p = .021) | −0.603 (p = .008) | 0.102 (p = .678) | 0.359 (p = .143) |
| Retropalatal Airway Slice | ||||
| AP (mm) | −0.276 (p = .254) | −0.250 (p = .317) | −0.123 (p = .616) | −0.029 (p = .908) |
| LW (mm) | −0.705 (p = .001) | −0.666 (p = .003) | −0.336(p = .159) | −0.134 (p = .595) |
r value is the Spearman’s correlation coefficient
To further understand the linear relationship between the anatomical volumes and BMI and age, in Table 4 we present the results of linear regressions on BMI and age. The table presents the slopes for BMI and age, the R-square and p-value of the ANOVA F-test. In males, age-adjusted BMI was a good predictor of fat volume with 34.4% of the variability of fat explained by age and BMI. In females, BMI was a significant predictor of the airway volume as a percent of NV (p=.016) after adjusting for age (R2 = 32.2%), and of the lateral width of the narrowest cross-section airway (p=.0003) after adjusting for age with this model explaining 65.0% of the variation of LW. With regard to age as a predictor of airway volume, fat tissue, internal fat, AP and LW we found no significant relationships.
Table 4.
Linear regression models to predict retroglossal fat tissue, internal fat and airway volume (normalized by retroglossal neck volume) per unit of age and BMI increase.
| Dependent variable | Change in dependent variable by 1 unit of BMI increase (p value) |
Change in dependent variable by 1 year of age increase (p value) |
R-square (p-value of ANOVA F-test) |
|---|---|---|---|
| Males only (n=19) | |||
| Retroglossal Airway Slab | |||
| Fat as a percent of NV | 1.427 (p = .011) | 0.023 (p = .767) | 34.4% (p=.034) |
| Internal fat as a percent of NV | 0.668 (p = .050) | 0.012 (p = .805) | 22.0% (p=.136) |
| Airway volume as a percent of NV | −0.102 (p = .270) | 0.007 (p = .608) | 9.45% (p=.452) |
| Retropalatal Airway Slice | |||
| AP (mm) | 0.086 (p= .764) | −0.029 (p= .525) | 3.3% (p= .765) |
| LW (mm) | −0.769 (p=. 231) | 0.060 (p= .544) | 11.4% (p= .381) |
| Females only (n=19) | |||
| Retroglossal Airway Slab | |||
| Fat as a percent of NV | 0.581 (p = .150) | 0.087 (p = .329) | 25.0% (p=.101) |
| Internal fat as a percent of NV | 0.214 (p = .213) | 0.060 (p = .124) | 30.7% (p=.053) |
| Airway volume as a percent of NV | −0.142 (p = .016) | 0.019 (p = .125) | 32.2% (p=.045) |
| Retropalatal Airway Slice | |||
| AP(mm) | −0.100 (p= .688) | −0.030 (p= .591) | 4.6% (p= .689) |
| LW (mm) | −1.578 (p=. 0003) | −0.054 (p= .486) | 65.0% (p= .0002) |
In Table 5 we explored the linear relationships between fat volume and internal fat volume with anterior-posterior diameter and lateral airway width of the smallest cross-section. The lateral airway width decreases significantly with internal fat volume but only in males after adjusting for BMI and age (R= −.534; p=.027) (Table 5). On the other hand, only in females, lateral width decreased significantly with increasing BMI (R= −.705; p=.0007).
Table 5.
Simple and partial correlations between retroglossal fat tissue, internal fat tissue, BMI and age, with the AP and lateral dimensions of the smallest cross-sectional airway.
|
AP Spearman’s coefficient r score (p value) |
AP (adjusted for BMI and Age) Partial correlation r score (p value) |
LW Spearman’s coefficient r score (p value) |
LW (adjusted for BMI and Age) Partial correlation r score (p value) |
|
|---|---|---|---|---|
| Males only (n=19) | ||||
| FV/NV | −0.265 (p =.274) | −0.299 (p =.243) | −0.404 (p =.086) | −0.393 (p =.118) |
| IFV/NV | −0.305 (p =.204) | −0.320 (p =.210) | −0.525 (p =.021) | −0.534 (p =.027) |
| BMI | −0.006 (p =.980) | N.A | −0.198 (p =.416) | N.A |
| Age | −0.132 (p =.590) | N.A | 0.159 (p =.515) | N.A |
| Females only (n=19) | ||||
| FV/NV | −0.405 (p =.086) | −0.338 (p =.184) | −0.507 (p =.027) | −0.329 (p =.197) |
| IFV/NV | −0.491 (p =.033) | −0.457 (p =.065) | −0.493 (p =.032) | −0.334 (p =.190) |
| BMI | −0.276 (p =.254) | N.A | −0.705 (p =.0007) | N.A |
| Age | −0.123 (p =.616) | N.A | −0.336 (p =.159) | N.A |
4. Discussion
In this sample of patients the retroglossal fat tissue accumulation did differ for men versus women, specifically we found significant sex differences with the men having a 2.7% more internal fat as a percent of neck volume (females=5.2%; males: 7.9%; p=.012; power = 84.1%), which corresponds to 51.9% more IFV/NV in the males. Men also had a 5.8% less subcutaneous fat as a percent of neck volume (p<.0001; power = 93.3%) than our female subjects (females=13.8%; males:9.0%), which corresponds to a 64.4% decrease in males. These findings are consistent with the fact that men have more OSA than women. However, the above findings are not in full agreement with Whittle et al study. 19 They compared the neck soft tissue and the fat distribution between normal men and women and found the total neck soft tissue volume was greater in men (1295 vs 928 cm3, p<0.001), but the volume of fat did not differ between the sexes (291 vs 273 cm3, p = 0.6). One explanation for the study differences is that Whittle et al did not differentiate between internal fat and subcutaneous fat, instead they reported fat as a percent of total soft tissue. This was done to correct for the fact that male necks were larger. Using their method they found that percent of fat volume was significantly higher in the necks of women (22% for men and 29% for women) which is in contrast to our data. Our study also examined Japanese subjects and there might be racial or ethnic differences in this relationship. Next, we note that our fat tissue measurements were based on CT images not MRI and we examined a much narrower axial slab of the neck than other studies, which we justify in two ways. On this point, the literature concludes that while CT and MRI may yield different absolute values of fat areas (especially visceral fat) the relative ranking of individuals on the basis of their fat areas will be similar by both methods. 21 Second, our primary interest was on the effect of fat tissue in the retroglossal area so we selected a 14 mm thick slab of the neck, not a much wider slab as others have done. Within this slab we did examine for regional fat tissue differences (e.g. anterior to anterior border of the spine (AIFV) and fat behind this dividing line (PIFV)) within our axial slab and found that men had a 2.1% more posterior internal fat volume than women (p=.004; power=88.3%) and no differences in anterior IFV. AIFV and PIFV were highly correlated R=0.690; p=.001 in both genders.
For males, the most significant finding in this paper is that BMI but not age is significantly correlated with retroglossal fat tissue volume (Table 3). BMI and age predict 34.4% of the variability of fat volume in males compared to 25.0% in females (Table 4). The finding that neck fat tissue accumulation is correlated to BMI is not surprising and has been reported by others that note a correlation between BMI and neck circumference 5,22 and BMI and increase in neck adipose tissue. 17 These findings are in agreement with Cosentini et al. who observed MRI images in 28 (27 males and 1 female) OSA patients. Increase of neck adipose tissue did not show any statistically significant correlation with AHI, but good correlation with BMI and acknowledged signs of nocturnal hypoventilation (low average oxyhemoglobin saturation at night and high percentage of sleep time with SaO2 lower than 90%). 17
In terms of how the internal fat in males might affect the airway we found in the smallest cross-section airway there was a significant negative correlation between internal fat volume and lateral airway width in both groups before adjusting for age and BMI. However this correlation was only significant in males after adjusting for age and BMI (R= −0.534; p=.027) (Table 5). Our results agree with the general idea that fat deposition and/or fatty infiltration in the surrounding areas of the pharynx would be related to the presence and severity of OSAS. 15, 16, 23, 24. However, it disagrees with Ciscar et al and Hora et al. who found that the reduction on the transversal diameter of the airways was more associated with muscle hypertrophy than fat deposition. One should note that none of these studies controlled for BMI, and they mostly reported in Caucasian. Schafer and colleagues 10 reported that AHI was significantly correlated with intra-abdominal fat and subcutaneous abdominal fat, whereas subcutaneous fat in the neck region and parapharyngeal fat in the airway vicinity were not correlated with AHI. Of course they did not report on airway dimensions and they did not have female subjects, they used MRI not CT images and they used a much larger volume (larger slab) than we did when assessing the fat tissue in the neck.
For females, BMI affects the airway in a different way, we found a negative statistical correlation between BMI and retroglossal airway volume (Table 3). BMI and age predict 32.2% of the variability of AWV/NV in females compared to 9.45% in males (Table 4). In the smallest cross-section (mostly retropalatal) the lateral width of the airway (LW) was statistically significantly correlated with BMI (Table 3). BMI and age predict 65.0% of the variability of the lateral width in females compared to only 11.4% in males (Table 4). The lateral width (LW) decreases significantly with increasing BMI (r=−70.5%; p=.001) in females only. These results agree with prior work from Mayer et al., 199625 who found a statistical correlation between the airway shape with BMI when they reported that it tends to be more spherical secondary to a decrease in the lateral dimension of the pharynx in patients with a higher BMI. However, their study included a mix of male and female OSA patients (81M:13F) and snorers (40M:6F).
Conclusions
We conclude that in Japanese male and female subjects with BMI ranging from 18 to 30 kg/m2, fat tissue distribution is different by gender with males having more internal (posterior) fat tissue as a percent of neck volume but less subcutaneous fat as a percent of NV. Static configuration of the retroglossal airway is influenced in different ways according to gender. These findings suggest that even though there are increased levels of internal fat in the retroglossal area in males with increasing BMI this accumulation does not differentially narrow the static retroglossal airway in males. In contrast, the lateral dimension of the smallest airway cross-section in males which is retropalatal decreased significantly as internal fat accumulated, and this change may be related to dynamic airway collapse. Certainly, dynamic airway analysis is needed and our study does not rule out or in whether increased fat tissue accumulation in males causes an increase in airway collapsibility.
Sources of funding/Acknowledgments
Dr. Enciso was partially supported by NIDCR grant #5 K25 DE016391. No conflicts of interest.
Dr. Ogawa was partially supported by “High-Tech Research Center” Project for Private Universities and grant # 18390501: matching fund subsidy from MEXT (Ministry of Education, Culture, Sports, Science and Technology). No conflicts of interest.
Footnotes
Publisher's Disclaimer: This is a PDF file of an unedited manuscript that has been accepted for publication. As a service to our customers we are providing this early version of the manuscript. The manuscript will undergo copyediting, typesetting, and review of the resulting proof before it is published in its final citable form. Please note that during the production process errors may be discovered which could affect the content, and all legal disclaimers that apply to the journal pertain.
References
- 1.Schwab J. Sex differences and sleep apnoea. Thorax. 1999;54:284–285. doi: 10.1136/thx.54.4.284. [DOI] [PMC free article] [PubMed] [Google Scholar]
- 2.Gislason T, Benediktsdottir B, Bjornsson JK, Kjartansson G, Kjeld M, Kristbjarnarson H. Snoring, hypertension, and the sleep apnea syndrome. An epidemiologic survey of middle-aged women. Chest. 1993;103:1147–1151. doi: 10.1378/chest.103.4.1147. [DOI] [PubMed] [Google Scholar]
- 3.Guilleminault C, Stoohs R, Kim YD, Chervin R, Black J, Clerk A. Upper airway sleep-disordered breathing in women. Ann Intern Med. 1995;122:493–501. doi: 10.7326/0003-4819-122-7-199504010-00003. [DOI] [PubMed] [Google Scholar]
- 4.Young T, Palta M, Dempsey J, Skatrud J, Weber S, Badr S. The occurrence of sleep-disordered breathing among middle-aged adults. N Engl J Med. 1993;328:1230–1235. doi: 10.1056/NEJM199304293281704. [DOI] [PubMed] [Google Scholar]
- 5.Yucel A, Unlu M, Haktanir A, Acar M, Fidan F. Evaluation of the upper airway cross-sectional area changes in different degrees of severity of obstructive sleep apnea syndrome: cephalometric and dynamic CT study. Am J Neuroradiol. 2005 Nov-Dec;26(10):2624–2629. [PMC free article] [PubMed] [Google Scholar]
- 6.Millman RP, Carlisle CC, McGarvey ST, Eveloff SE, Levinson PD. Body fat distribution and sleep apnea severity in women. Chest. 1995;107:362–366. doi: 10.1378/chest.107.2.362. [DOI] [PubMed] [Google Scholar]
- 7.Pi-Sunyer FX, Dowling HJ. The effects of race and body fat distribution on insulin sensitivity. Trans Am Clin Climatol Assoc. 1995;107:175–185. [PMC free article] [PubMed] [Google Scholar]
- 8.Kissebah AH, Krakower GR. Regional adiposity and morbidity. Physiol Rev. 1994;74:761–811. doi: 10.1152/physrev.1994.74.4.761. [DOI] [PubMed] [Google Scholar]
- 9.Bjorntorp P. Adipose tissue distribution and function. Int J Obes. 1991;15:67–81. [PubMed] [Google Scholar]
- 10.Schafer H, Pauleit D, Sudhop T, Gouni-Berthold I, Ewig S, Berthold HK. Body fat distribution, serum leptin, and cardiovascular risk factors in men with obstructive sleep apnea. Chest. 2002;122:829–839. doi: 10.1378/chest.122.3.829. [DOI] [PubMed] [Google Scholar]
- 11.Hora F, Napolis LM, Daltro C, Kodaira SK, Tufik S, Togeiro AM, et al. Clinical, Anthropometric and Upper Airway Anatomic Characteristics of Obese Patients with Obstructive Sleep Apnea Syndrome. Respiration. 2007;74:517–524. doi: 10.1159/000097790. [DOI] [PubMed] [Google Scholar]
- 12.Ciscar MA, Juang G, Martinez V, Ramón M, Lioret T, Minguez J, et al. Magnetic resonance imaging of the pharynx in OSA patients and healthy subjects. Eur Respir J. 2001;17:79–86. doi: 10.1183/09031936.01.17100790. [DOI] [PubMed] [Google Scholar]
- 13.Schwab RJ, Pasirstein M, Pierson R, Mackley A, Hachadoorian R, Arens R, et al. Identification of upper airway anatomic risk factors for obstructive sleep apnea with volumetric magnetic resonance imaging. Am J Respir Crit Care Med. 2003;168:522–530. doi: 10.1164/rccm.200208-866OC. [DOI] [PubMed] [Google Scholar]
- 14.Welch KC, Foster GD, Ritter CT, Wadden TA, Arens R, Maislin G, et al. A novel volumetric magnetic resonance imaging paradigm to study upper airway anatomy. Sleep. 2002;25:532–542. [PubMed] [Google Scholar]
- 15.Mortimore IL, Marshall I, Wraith PK, Sellar RJ, Douglas NJ. Neck and total body fat deposition in nonobese and obese patients with sleep apnea compared with that in control subjects. Am J Respir Crit Care Med. 1998;157:280–283. doi: 10.1164/ajrccm.157.1.9703018. [DOI] [PubMed] [Google Scholar]
- 16.Shelton KE, Woodson H, Gay S, Suratt PM. Pharyngeal fat in obstructive sleep apnea. Am Rev Respir Dis. 1993;148:462–466. doi: 10.1164/ajrccm/148.2.462. [DOI] [PubMed] [Google Scholar]
- 17.Cosentini T, Le Donne R, Mancini D, Colavita N. Magnetic resonance imaging of the upper airway in obstructive sleep apnea. Radiol Med. 2004 Oct;108(4):404–416. [PubMed] [Google Scholar]
- 18.Malhotra A, Huang Y, Fogel R, Lazic S, Pillar G, Jakab M, et al. Aging influences on pharyngeal anatomy and physiology: the predisposition to pharyngeal collapse. Am J Med. 2006;119:72e9–72e14. doi: 10.1016/j.amjmed.2005.01.077. [DOI] [PMC free article] [PubMed] [Google Scholar]
- 19.Whittle AT, Marshall I, Mortimore IL, Wraith PK, Sellar RJ, Douglas NJ. Neck soft tissue and fat distribution: comparison between normal men and women by magnetic resonance imaging. Thorax. 1999;54:323–328. doi: 10.1136/thx.54.4.323. [DOI] [PMC free article] [PubMed] [Google Scholar]
- 20.Hounsfield GN. Med Phys. 1980;7:283–290. doi: 10.1118/1.594709. [DOI] [PubMed] [Google Scholar]
- 21.Seidell JC, Bakker CJ, van der Kooy K. Imaging techniques for measuring adipose-tissue distribution--a comparison between computed tomography and 1.5-T magnetic resonance. Am J Clin Nutr. 1990;51:953–957. doi: 10.1093/ajcn/51.6.953. [DOI] [PubMed] [Google Scholar]
- 22.Ogretmenoglu O, Suslu AE, Yucel OT, Onerci TM, Sahin A. Body fat composition: a predictive factor for obstructive sleep apnea. Laryngoscope. 2005;115:1493–1498. doi: 10.1097/01.mlg.0000172204.82314.c3. [DOI] [PubMed] [Google Scholar]
- 23.Sakakibara H, Tong M, Matsushita K, Hirata M, Konishi Y, Suetsugu S. Cephalometric abnormalities in non-obese and obese patients with obstructive sleep apnoea. Eur Respir J. 1999;13:403–410. doi: 10.1183/09031936.99.13240399. [DOI] [PubMed] [Google Scholar]
- 24.Ikeda K, Ogura M, Oshima T, Suzuki H, Higano S, Takahashi S, et al. Quantitative assessment of the pharyngeal airway by dynamic magnetic resonance imaging in obstructive sleep apnea syndrome. Ann Otol Rhinol Laryngol. 2001;110:183–189. doi: 10.1177/000348940111000215. [DOI] [PubMed] [Google Scholar]
- 25.Mayer P, Pépin J-l, Bettega G, Veale D, Ferretti G, Deschaux C, et al. Relationship between body mass index, age and upper airway measurements in snorers and sleep apnoea patients. Eur Respir J. 1996;9:1801–1809. doi: 10.1183/09031936.96.09091801. [DOI] [PubMed] [Google Scholar]