

Abstract
We present a microfluidic cell sorting device which augments microscopy with the capability to perform facile image-based cell sorting. This combination enables intuitive, complex phenotype sorting based on spatio-temporal fluorescence or cell morphology. The microfluidic device contains a microwell array that can be passively loaded with mammalian cells via sedimentation and can be subsequently inspected with microscopy. After inspection, we use the scattering force from a focused infrared laser to levitate cells of interest from their wells into a flow field for collection. First, we demonstrate image-based sorting predicated on whole-cell fluorescence, which could enable sorting based on temporal whole-cell fluorescence behavior. Second, we demonstrate image-based sorting predicated on fluorescence localization (nuclear vs. whole-cell fluorescence), highlighting the capability of our approach to sort based on imaged sub-cellular events, such as localized protein expression or translocation events. We achieve post-sort purities up to 89%, and up to 155-fold enrichment of target cells. Optical manipulation literature and a direct cell viability assay suggest that cells remain viable after using our technique. The architecture is highly scalable and supports over 10,000 individually addressable trap sites. Our approach enables sorting of significant populations based on sub-cellular spatio-temporal information, which is difficult or impossible with existing widespread sorting technologies.
Keywords: Cell sorting, optofluidics, optical manipulation, scattering force, optical tweezers, microwell array, microscopy, microfabrication
The need to isolate small numbers of specific cells from background populations is ubiquitous, with applications in pathology, clinical diagnosis, cloning, and cell biology research. In the context of cell biology experiments, sorting can be a way to select a desired starting population of cells of known characteristics1, or can be a tool to analyze the results of an experiment and isolate particularly interesting cells for further investigation.
Our ability to sort cells is dictated by our ability to both detect useful criteria for sorting and physically sort cells in response to that information. Present cell sorting technologies can base sorts on an impressive range of criteria. Fluorescence-activated cell sorting (FACS) enables high-throughput viable sorting based on fluorescent probes designed to report a wide range of cellular parameters2. Laser capture microdissection (LCM)3 permits microscopy-based imaging of samples immediately before selection, allowing a user to base selection on information-rich images. However, despite the breadth of sorting criteria available with mature techniques, there is a strong tradeoff between the ability to image cells and to sort them easily and viably. For instance, while FACS offers high-throughput viable cell sorting, it cannot resolve fluorescence localization and constrains sorting decisions to a single decision timepoint. These limitations rule out sorts based on temporal, spatial, or spatio-temporal fluorescence dynamics. Traditional LCM, meanwhile, offers the ability to use microscopy techniques to select cells, but is typically applied to fixed cells. Laser microdissection has also been adapted to allow viable cell selection in commercial systems (e.g., Zeiss PALM MicroBeam system, Zeiss CellScience Clonis). These commercial solutions offer a powerful level of control, precision, and user-friendly selection of target cells in a turnkey system. However, LCM systems require the purchase of specific, dedicated instruments, often require use of proprietary films, and have not been widely adopted by individual labs for routine work, largely owing to cost.
Recent progress has started to erode this tradeoff between imaging and user-friendly sorting. Optical manipulation methods centered around optical tweezers4 have been adapted to cell sorting5 and are intuitive – a user directly focuses a laser onto a target cell and uses the beam to tweeze or push the cell to a desired location. Optical tweezer arrays and optical lattices can optically manipulate and sort multiple cells and particles simultaneously6, 7. However, the high-numerical aperture (NA) requirements of optical tweezers greatly restrict imaging field size and constrain device architecture due to the short working distances of the objective lenses typically used. While a small field size is sufficient to work with large numbers of small particles or small cells such as bacteria, only small numbers of mammalian cells can fit in such a small field (~2500 μm2) for optical tweezer array-based manipulation. Further, power requirements are high, as each trap site might require upwards of ~100 mW of optical power. Optoelectronic tweezers (OETs)8 employ lower-NA optics, and thus enable larger area (~1 mm2) manipulation fields via optically mediated dielectrophoretic (DEP) trap arrays, extending “virtual” optical manipulation to field areas better suited for mammalian cell manipulation. Unfortunately, owing to buffer incompatibilities, OET forces exerted on cells suspended in standard cell culture medium are weak, and a ~1 mm2 manipulation area, while an improvement over traditional optical tweezers, is still insufficient to simultaneously manage large populations of cells. Use of a large-area display to directly actuate OETs without lenses circumvents the issue of lens field size, but decreases manipulation resolution and suffers from the same buffer incompatibilities of traditional OETs9.
Array-based systems employing non-optical confinement methods can form arrays of cells extending beyond a single imaged field. DEP trap arrays have successfully demonstrated trap and release sorting capability and can, in principle, be scaled to large array sizes10. Unfortunately, such site-addressable electrical approaches require complex on-chip interconnects and significant off-chip support circuitry when scaled to large array sizes. Hydrodynamic trap arrays, utilizing either microwells11 or obstacles12 for cell confinement, offer simple, passive, mostly single-cell loading over large areas with minimal complexity, allowing microscopy-based imaging of large arrays over time to investigate single-cell behavior. Viable retrieval of small numbers of single cells from microwell arrays using micropipettes/micromanipulators based on temporal fluorescence behavior has also been demonstrated13, 14, but the retrieval method is time-consuming and cumbersome.
Here we present a microscope-compatible, array-based microfluidic cell sorting architecture centered around passive hydrodynamic trapping of cells and active release using the optical scattering force (Figure 1). As with the simplest microfluidic devices, our platform requires only flow and a clear optical path to the chip. As a result, we minimize on-chip complexity, and the approach requires no fabrication outside of a traditional SU-8/PDMS molding process. Array loading is passive, requires no interconnects to individual sites, and thereby allows straightforward scaling to large array sizes and minimizes off-chip complexity. Addressing during release also requires no permanent interconnects and merely requires incorporation of a laser into the microscope, making the platform truly scalable to sort large cell populations.
Figure 1.
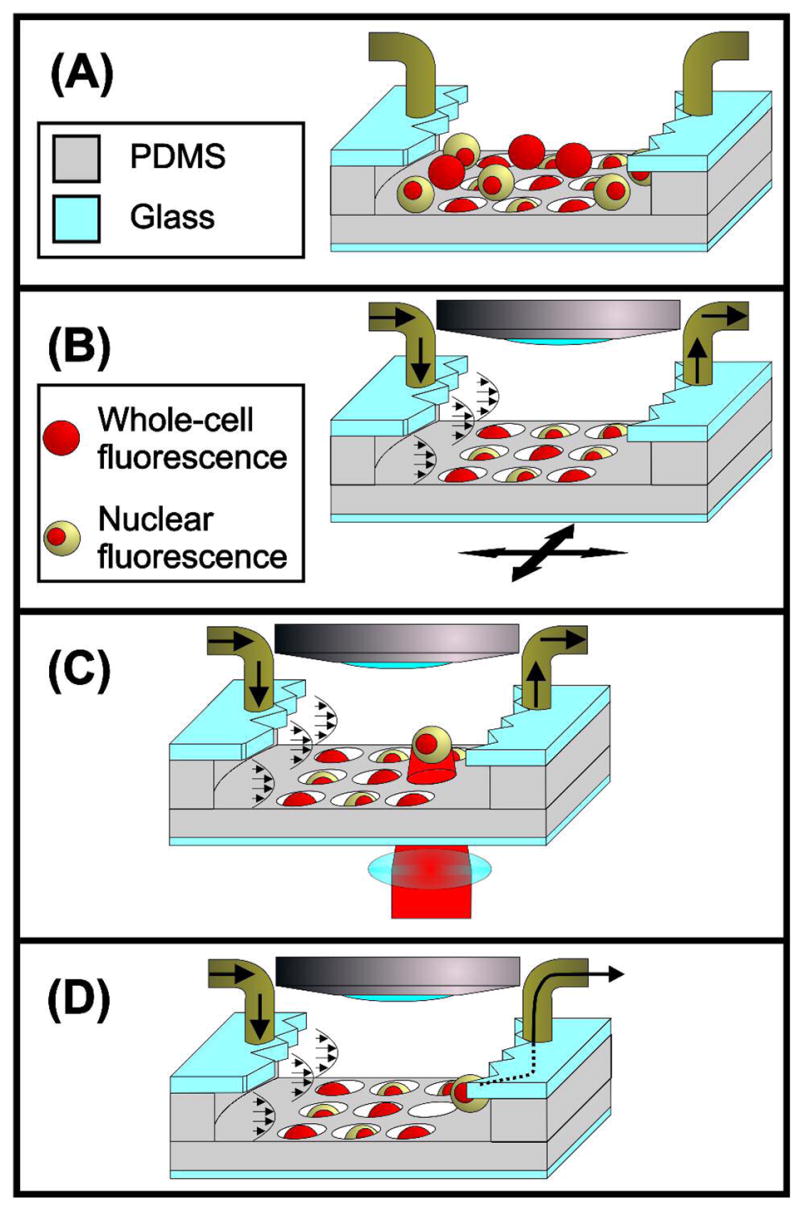
Device overview. (A) Following injection into the device, cells sediment into the microwell array. (B) Cells remaining outside wells flow away after flow resumes. We then inspect the array using any desired microscopy technique (brightfield, DIC, fluorescence, etc.). (C) After locating cells of interest, we focus an infrared (IR) laser beam onto target cells, levitating the cells into the flow field with the optical scattering force. (D) Fluid drag overcomes lateral optical forces, releasing the cell and washing it downstream for fractionation.
Our device enables cell sorting based on spatial and temporal fluorescence characteristics of single cells, or any other property apparent under an arbitrary microscopy technique. Utilizing strengths of other array and sorting techniques, our platform combines the simplicity and wide-area advantages of microwell arrays with the intuitive operation of optical techniques. Operation is highly amenable to automation and requires no cumbersome, direct physical handling of cells. Here we demonstrate user-friendly, image-based selection and removal of particular target cells from a background population using this method.
EXPERIMENTAL SECTION
Microfabrication and Packaging
We used a two-layer SU-8 process to fabricate silicon wafer masters for PDMS molding. The first SU-8 layer (105 μm-thick, 1600 rpm, SU-8 2050, MicroChem, Newton, MA) defined flow channels, while the second SU-8 layer (35-μm-thick, 2750 rpm, SU-8 2035, MicroChem) defined arrays of 25- and 30-μm-diameter posts to pattern microwell arrays into the bottom of the flow channels after molding. Flow channels were 3 mm-wide in the vicinity of the microwell array. We silanized wafers for 24 h with (tridecafluoro-1,2,2-tetrahydrooctyl)-1-tricholorosilane (T2492-KG, United Chemical Technologies, PA) evaporated in a dessicator with the masters to decrease adhesion of PDMS to the master during molding. After mixing PDMS (Sylgard 184, Dow Corning, MI) at a 10:1 base: curing agent ratio and degassing the PDMS for ~1 hour in a dessicator, we poured the PDMS onto the wafer, cured the PDMS for 2 h in a 65 °C convection oven, and peeled the cured PDMS off of the master, achieving a PDMS thickness of ~2 mm. Using diamond-tipped drill bits (Tripple Ripple product line, CR Laurence, CA), we drilled tubing ports into 1-mm-thick glass slides and glued PEEK tubing (1532, Upchurch Scientific, WA) to the ports using epoxy (High performance Epoxy, 99393, Loctite, Avon, OH). We drilled an additional interfacing hole into the glass to connect the microfluidic chamber to a reservoir that we would epoxy to the top side of the glass. After exposing the PDMS layer to an oxygen plasma (PDC-001, Harrick Scientific, Ossining, NY) we bonded the PDMS to the glass slide, resulting in a sealed flow chamber with a microwell array patterned into the chamber floor (Figure 2-A). We then attached a reservoir to the top side of the glass with epoxy and plasma bonded a thin piece of PDMS over the interfacing hole to isolate the reservoir from the microfluidic chamber until we pierced the membrane with a needle at collection time. After plasma bonding and attaching the reservoir, we placed the chip in a convection oven set to 65°C for 12 h to accelerate PDMS hydrophobicity recovery after plasma bonding to facilitate later adsorption of bovine serum albumin (BSA). Lee et al. postulated that fibronectin more readily adsorbs to hydrophobic PDMS than hydrophilic PDMS15; we found that cells adhered less to BSA-treated hydrophobic PDMS than to BSA-treated hydrophilic PDMS, suggesting that BSA adsorption might be similarly enhanced to hydrophobic PDMS.
Figure 2.

Microfluidic device and system. (A) Support fluidics and device layout. We use syringe pumps and an injection valve to load cells into our device. At collection time, we puncture the PDMS membrane with a needle and close the waste output, allowing target cells to flow into the reservoir for subsequent removal via a 200 μL pipettor. (B) Incorporation into a standard automated upright microscope. A 3-axis stage mounted on a switchable magnetic base allows rapid incorporation and alignment of the laser. Use of KG5 filter glass throughout the microscope protects components from laser damage.
Fluid Handling
We detail the fluid connections in Figure 2-A. The flushing buffer input is arranged to provide sheath flow for the cell loading input, preventing cells from flowing into the entry to the path to the collection reservoir during loading. The waste output connection is toggled with a simple off-chip valve. After we pierce the PDMS membrane at collection time and target cells flow into the reservoir, we use a standard 200 μL pipettor to transfer cells from the output to a 96-well plate. Syringe pumps drive both inputs via 4-way valves (V-101D, Upchurch Scientific) which allows for switching between the syringe pump medium and another fluid (ethanol as illustrated) in a bubble-free manner. We use an injection valve (V-451, Upchurch Scientific) with a 100 μL PEEK sample loop to inject cell suspensions into the device.
Optics and Laser Incorporation
All experiments utilized an upright Axioplan 2-MOT (Zeiss, Thornwood, NY) microscope with a computer-controllable motorized stage (999000, Ludl). For fluorescence imaging, we used an EXFO X-Cite 120 fluorescence source (EXFO Photonic Solutions, Inc., Richardson, TX), Chroma 41001 FITC, 41007a Cy3, and 31004 Texas Red fluorescence filter sets (Chroma Technology Corp., Rockingham, VT). We used a LaVision Image r 3 QE CCD digital camera (LaVision GmbH, Goettingen, Germany) for all image recording. Our computer-controllable laser diode system utilized a 980-nm fiber-coupled semiconductor diode laser (3CN00283AL, Avanex, Fremont, CA) capable of outputting up to 290 mW of single-mode output power. A butterfly package holder (LM14S2, Thorlabs, Newton, NJ) interfaced with the diode and laser output levels were controllable using a laser diode/thermoelectric cooler (LD/TEC) controller (LDTC 2/2, Wavelength Electronics, Bozeman, MT). We controlled the LD/TEC controller remotely through a USB-interfaced A/D and D/A converter (USB-1408 FS, Measurement Computing, Norton, MA) via the MatLab Data Acquisition Toolbox (MathWorks, Natick, MA).
A simple cage-mounted collimation/focusing apparatus allowed simple incorporation of the fiber-coupled laser into the microscope. We positioned the assembly underneath the microscope stage using optomechanics mounted on switchable magnetic bases for straightforward insertion and removal of the laser (Figure 2-B). To collimate and focus the beam, we used identical 0.15 NA aspheric lenses (C280TM-B, Thorlabs). During laser exposures, we protected microscope components from IR damage by using a filter cube with 3-mm-thick KG5 glass in the fluorescence excitation and emission paths (Chroma Technology) and 2-mm-thick KG5 glass in two filter sliders leading to the light sources (Figure 2-B). We shut off eyepiece transmission during laser exposures, and used a 20× Achroplan objective (440040, Zeiss) for all imaging during laser exposure. The switcher in the dual video output tube of the microscope diverted imaging from the LaVision CCD to a Bullet CCD connected to a television during laser exposures that we wished to visualize, protecting the LaVision CCD. When recording videos, we replaced the Bullet CCD with a FireWire CCD (Fire-i 400, Unibrain, San Ramon, CA), again in the interest of protecting the LaVision CCD from damage. The above modifications are straightforward, temporary, and can be applied or adapted to a wide range of existing upright and inverted microscopes, unlike commercialized versions of LCM which require more dedicated, semipermanent, and less flexible equipment.
Computer Automation and Interfacing
We wrote software using MatLab to simultaneously interface with the laser, microscope, and motorized stage. The software automatically scanned over the microwell array and recorded multi-wavelength fluorescence/brightfield images of the entire array. The software also allowed us to perform rapid image-based inspection of individual array sites and easy marking of sites of interest. Subsequently, the software generated a list of marked sites and allowed for rapid, automatic return to those sites for removal of target cells. The software isolates the user from bookkeeping and registration of large arrays. The interface allows for natural extension of the software to incorporate automatic image-based selection of cells of interest through image algorithms.
Device Preparation
Prior to all experiments, we used the fluidic arrangement shown in Figure 2-A. We first opened the output valve and flowed an ethanol mixture (80% ethanol, 20% de-ionized water) into both inputs to facilitate device filling and sterilize the device. After closing the output path, we degassed the microwells by applying pressure to both input syringes, driving bubbles in the microwells out through the PDMS. After filling the device, we opened the output and flushed the device with phosphate-buffered saline (PBS) (14190, Gibco, Carlsbad, CA). Next, we flowed a 75 mg/mL bovine serum albumin (BSA) fraction V solution prepared in PBS (15260, Invitrogen, Carlsbad, CA) into the cell injection and flushing inputs and filled the device. The BSA remained in the chamber at room temperature for 1 h to adsorb to the PDMS surface to help block cell adhesion in the subsequent experiment. Afterwards, we flushed the chamber with PBS.
Cell Culture and Preparation
Cell incubation conditions were 37°C, 7.5% CO2, in a humidified atmosphere. We cultured BA/F3 pro B cells and WeHi-3B myelomonocytic leukemia cells (a kind gift from Susan Lindquist, Whitehead Institute, Cambridge, MA) . B cell culture medium was RPMI 1640 (21870, Gibco), supplemented with 10% v/v fetal bovine serum (FBS) (SH30088.03, Hyclone, Logan, UT), 2% v/v L-glutamine (25030, Gibco), 1% v/v penicillin-streptomycin (15140, Gibco), and 10% v/v WeHi-3B conditioned medium. Leukemia cell medium was Iscove’s modified Dulbecco’s medium (IMDM) (12440, Gibco) supplemented with 10% v/v FBS, 1% v/v penicillin-streptomycin and 25 μM 2-mercaptoethanol (21985, Gibco). We prepared WeHi-3B conditioned media by collecting media from WeHi-3B cells grown in T75 flasks (3 days after seeding), spinning media down at 1000 rpm for 7 minutes, and collecting the supernatant. After collection, we filtered the media through a 0.2 μm vacuum filter bottle, aliquotted the media, and stored it at −20 °C for future use in B cell culture.
Additionally, we cultured two lines of MCF7 epithelial breast cancer cells, one of which was transfected with a construct expressing the red fluorescent protein mCherry16 fused to the mouse ornithine decarboxylase PEST sequence and three copies of the SV40 large T-antigene nuclear localization sequence (NLS) under the control of the p21 promoter. Selection with blasticidin established a stable, clonal cell line. This cell line will be published in detail elsewhere. A second line was not transfected. Both lines were a kind gift from Galit Lahav, Harvard Medical School, Boston, MA. MCF7 culture medium for the non-transfected line was RPMI 1640 supplemented with 10% v/v FBS, 1% v/v L-glutamine, and 1% v/v penicillin-streptomycin. Culture medium for the transfected cell line additionally contained 5 μg/mL blasticidin (ant-bl-1, InvivoGen, San Diego, CA).
For experiments using CellTracker dyes, we used either CellTracker Green CMFDA (C7025, Invitrogen) or CellTracker Orange CMRA (C34551, Invitrogen) at concentrations of 5–10 μM, and stained cells as per product datasheet, unless noted otherwise. Prior to injection into the device, we re-suspended cells in standard culture medium at total cell concentrations of 1–10 × 106 cells/mL.
Device Operation
After injecting cells into a 100 μL sample loop via the injection port/valve assembly, we pumped the cell suspension into the cell loading input at a flow rate of 100 μL/min with the syringe pump while flowing media through the flushing input at 30 μL/min to provide sheath flow. After the cell suspension filled the device, we stopped flow for ~5 min., allowing cells to sediment into the wells. We then pumped fresh media first through both inputs at ~40 μL/min, and then solely through the flushing input, and briefly from the flushing input backward through the cell loading input. This protocol removed cells residing outside the microwell array in all chip regions as well as cells trapped unstably in the array while avoiding introduction of residual cells through the cell loading input. Using our software, we scanned the entire array, inspected and marked individual sites, and returned to specific sites to remove cells using the laser. During removal, we used a flow rate of 2.5–5 μL/min and applied 100–150 mW of laser power to each cell until the cell was levitated high enough that the flow displaced the cell and carried it downstream.
Cell Experiments
For initial whole-cell fluorescence sorting validation, we labeled a majority of BA/F3 cells with CellTracker Green and a minority with CellTracker Orange in a ratio of ~ 50:1 to demonstrate the removal of rare cells from a background population. For localization-based sorting, we double-stained a non-transfected population of MCF7 cells with CellTracker Green (2.4 μM) and CellTracker Orange (0.4 μM), staining the entire cell. We mixed this double-stained population with a population of transfected MCF7 cells expressing nuclear-confined mCherry fluorescence. We used the low concentration of CellTracker Orange to roughly match the mCherry fluorescence levels in the transfected cells for demonstration purposes. In this localization-based sort, we used brightfield images to define the edge of the cell and the overlaid fluorescence image to qualitatively determine fluorescence localization via user interpretation.
Subsequently we performed three sorting experiments to quantify aspects of device operation. We injected binary mixtures of BA/F3 cells distinguishable by whole cell fluorescence at known concentrations measured using a Coulter counter (Z2, Beckman Coulter, Fullerton, CA) and quantified performance parameters of our device. We also used our basic reservoir collection and pipette retrieval method to quantify the final retrieval efficiency in two of the experiments.
We used Trypan Blue exclusion to assay viability of cells handled by our technique. We used a standard Trypan Blue exclusion protocol, adapted to chip by excluding the BSA coating step, thereby promoting cells to stick to the bottoms of microwells. After loading BA/F3 cells, we irradiated 50 cells at 150 mW for 30 s, and then injected the Trypan Blue solution into the chamber, and compared the exclusion rates to dish controls.
SAFETY CONSIDERATIONS
The optical power levels used are dangerous without safety precautions. When using the laser, we wore appropriate laser eyewear, wrapped a laser curtain (Kentek, Pittsfield, NH) around our entire working area around the microscope, shut off the microscope eyepieces, and performed all imaging with a CCD. SU -8 processing is hazardous and must be carried out in an appropriately ventilated environment as per manufacturer’s guidelines. In addition, the silane used during silanization is highly hazardous; the silanization step must be carried out in a chemical hood and all manufacturer’s warnings must be considered.
RESULTS
Selective Levitation of Single Cells from Microwells
We desired to remove single cells from microwells in a manner that was straightforward, user-friendly, contact-free, and conceivably automatable. We decided that using the optical scattering force to levitate cells from microwells met these criteria, and that such a system was simple to implement in a standard microscope with minimal modification. Rather than use the laser as a film-cutting or –melting tool for indirect cell actuation as in many LCM applications, we therefore used our IR laser to directly apply radiation pressure to actuate and levitate cells of interest, combining the steps of physical selection and target removal into a single step. In most optical tweezers applications, the laser is focused into a high-divergence beam shape, producing strong optical gradient forces in both the axial and lateral directions on cells in the laser beam. In contrast, we focus the laser into a low-divergence shape, which results in gradient forces that are significant in the lateral direction, but miniscule in the axial direction.
In our low-divergence case, the result is that the radiation pressure induced onto the cell by photon scattering is greater than the axial gradient force. Therefore, when we focus our beam onto a cell, the lateral gradient force quickly translates the cell to the lateral beam center, and the scattering force causes the cell to levitate axially. This operational mode has been used by others to both push cells along channels5 and levitate cells between vertically connected channels.17 This effect is analogous to a beach ball being pushed vertically by a fire hose6, and offers a couple of advantages over traditional optical tweezers in our case. First, while many high-NA lenses used for 3-D optical trapping must be used through substrates of specified (usually thin) thickness and have short working distances, the low-divergence of the beam allows for longer working distances and actuation ease is much less sensitive to substrate thickness. In our case, we easily focused the beam through a ~2 mm PDMS substrate whose thickness varied throughout the device and achieved adequate actuation. Second, focused spot sizes are larger than those typically used in optical tweezers applications, which can lower peak optical intensities and thus mitigate cell damage, as discussed later.
Ashkin derived a ray-optics regime model of the optical forces exerted on a partially reflecting sphere, applicable in cases whe re particle size significantly exceeds the wavelength18. This approach breaks the incident beam into rays each independently contributing to the total scattering and gradient force. Each ray contributes a scattering force FS of
| (Eq. 1) |
where n1 is the refractive index of the medium, P is the ray power, c is the speed of light in free space, R and T are the Fresnel reflection and transmission coefficients respectively for the ray, and θ and r are the incidence and refraction angles respectively of the ray on the particle. Summing contributions of all incident rays yields the predicted total force on the particle.
Eq. 1 clearly shows that the scattering force is linearly proportional to power. However, the underlying richness of the Fresnel coefficients makes further intuitive reasoning about behavior difficult without focusing on a specific set of optical parameters. Kim et al. discuss consequences of manipulating particles with weakly focused Gaussian beams.19 Their findings, while outside the immediate scope of this paper, carry implications for future performance optimization with respect to beam intensity profile and beam waist size relative to the particle size, among other parameters.
We first demonstrated the feasibility of selectively levitating a single BA/F3 cell from a microwell without perturbing cells in neighboring wells. We focused the beam so that the beam waist was roughly equal to the cell diameter (~9 μm). To a first approximation, a larger beam waist could waste power, as photons missed the cell, while a smaller one would create unnecessarily high local intensities and increase the axial gradient force, which competes against the levitating scattering force. On average, levitation and release of a cell from a well takes about 15–20 s, but can ultimately range from 3 s to 30 s. This range is largely due to variations in cell size and shape. As the cell diameter approaches the well diameter, Stokes drag wall effects become more significant, leading to longer removal times for larger cells in the population. Significantly aspheric cells, such as those undergoing mitosis, can be removed quickly, as their asymmetry makes them easier to remove via the fluid flow after they are levitated slightly. The removal efficiency, defined as the percentage of cells we successfully removed from a well out of the total number of cells which we attempted to remove, can vary between 25% and 100%, depending on the well dimensions used. In some trials, we achieved a 100% removal efficiency by using wells 30-μm in diameter and 35-μm in depth, and therefore used these dimensions for experiments reported here. In cases with less than 100% removal efficiency, nonspecific surface interactions appear to be the primary reason that cell removal fails. Use of larger (i.e., 30 -μm-diameter) wells allows the optical forces to more directly compete with these surface effects rather than with increased Stokes drag wall effects seen in smaller wells.
The actual process of cell removal has two qualitative phases, which are predicted by the theory described earlier. First, after the laser is focused onto the cell, the gradient force in the lateral beam dimension quickly drags the cell laterally into the beam center, just as with traditional optical tweezers. Next, the scattering force overwhelms gravity and the small axial gradient force, and the cell is levitated up into the flow field. As the cell is levitated away from the laser focus, the local intensity and lateral gradient force drop due to beam divergence, and eventually Stokes drag from the fluid flow overcomes the lateral gradient force, releasing the cell into the flow stream (Figure 3-A, Movie S-1). A single cell can, in general, even be removed selectively from a well with multiple cells (Figure 3-B, Movie S-2), a testament to the tight localization of the optical force.
Figure 3.
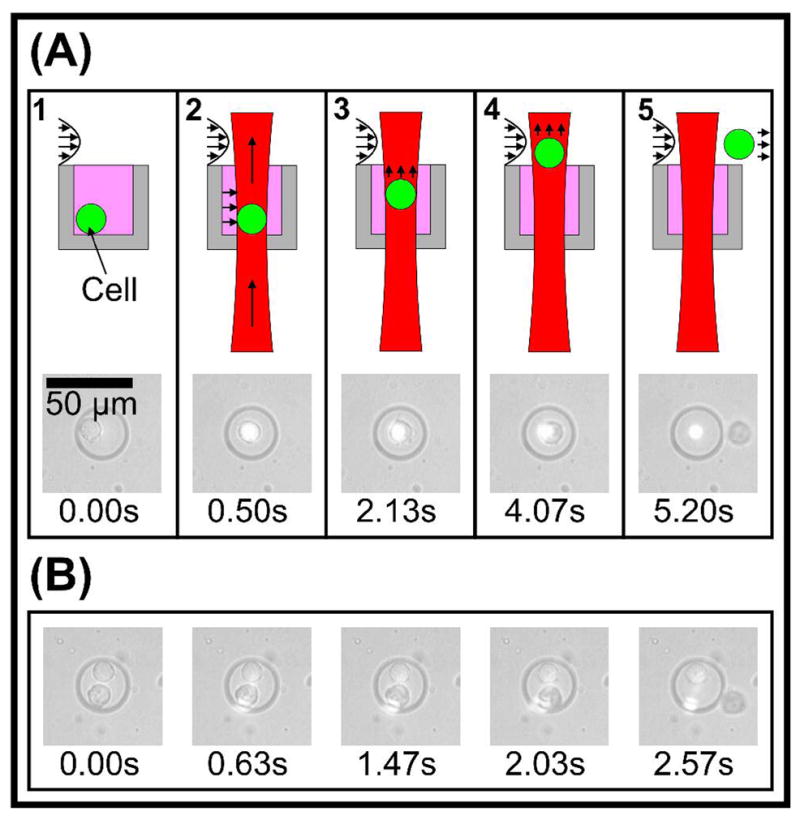
Cell release. (A) Sequence of images showing levitation and removal of a target cell. Illustrations qualitatively show cell state in each frame. 1 - Cell at rest, 100 ms before laser is turned on. 2 – Lateral optical gradient force moves cell to lateral center of beam. 3 - Optical scattering force begins to levitate cell. 4 – Scattering force levitates cell into flow field. 5 - Fluid drag force overwhelms optical gradient force, releasing cell. (B) Tight localization of optical force. We demonstrate the ability to remove a single targeted cell residing in a doubly-loaded well.
Whole Cell Fluorescence-Based Cell Sorting
While FACS allows straightforward whole-cell fluorescence-based sorting, an image-based approach to whole-cell fluorescence-based sorting could allow sorting based on single-cell fluorescence levels monitored over time. LCM could offer such monitoring over time, but without including cell confinement or computational cell tracking techniques, monitoring fluorescence dynamics over time could be difficult, especially for non-anchorage-dependent cells such as the BA/F3 cells. Our microwell structures, however, are especially suited for cell confinement. For these reasons, we demonstrated the capability of our platform to image thousands of single cells and release single target cells from their trap sites based on whole-cell fluorescence. After loading the microwell array with a 50:1 ratio of CellTracker Green: CellTracker Orange-labeled BA/F3 cells, we scanned the entire array under brightfield and fluorescence illumination and inspected the images to determine the location of orange-labeled cells. We then automatically returned to array sites containing orange-labeled cells, re-instated buffer flow, and levitated orange -labeled cells into the flow field for selective removal (Figure 4). Currently, the process of releasing a cell takes about 18–45 s, with selecting and scanning to an array site, aligning the laser to the cell, and levitating and releasing a cell taking about 10 s, 5 s, and 3–30 s respectively. Attempting removal of 60–70 cells per hour is reasonable, which is a useful throughput in applications where 10’s to ~100 rare cells are desired. Our result demonstrates that a >10k-site array can be iteratively imaged using fluorescence to predicate single-cell sorting decisions.
Figure 4.

Whole cell fluorescence-based cell sorting. We scanned a loaded 10,000-site array and located orange-labeled cells. We selectively released orange cells (false-colored red) from their trap sites, demonstrating the ability of image-based sorting based on time-resolved, whole cell fluorescence, a capability effectively missing from FACS. Chip -level detail, shown in (A), is intentionally oversaturated in order to make cell-containing sites more visible for viewing/printing.
Fluorescence Localization-Based Cell Sorting
FACS cannot resolve localization of a fluorophore within a cell. Such localization can be important when studying translocation events of proteins within cells or protein localization, among other applications. To demonstrate a sort predicated on fluorescence localization, we imaged and sorted a mixed population of MCF7 cells exhibiting nuclear fluorescence and MCF7 cells double-stained with CellTracker Orange and Green, which exhibited diffuse whole cell fluorescence (Figure 5). We used the green double-stain for demonstrating sorting verification. Our platform allowed us to selectively remove the nuclear-fluorescent cells, despite the fact that the diffuse fluorescent signal was spectrally indistinguishable from the nuclear signal. We used a slightly higher power (150 mW) for this experiment because of the slightly larger size of the MCF7 cells as compared with the BA/F3 cells, although the short removal times for the two cells (6 s and 12 s) suggest that they could have also been removed with a typical exposure of 100 mW for ~20–30 s. This experiment demonstrates predication of sorts on fluorescence localization, or any other image-based criteria. Our method therefore has the ability to combine spatial and temporal fluorescence information from multiple channels with any other image data, (i.e. brightfield images as shown in Figure 5) to allow sorting of cells based on phenotypes far more complex than is practical or possible with FACS and without the investment and significant overhead required by LCM.
Figure 5.

Fluorescence localization-based cell sorting. We demonstrate the ability to sort cells based on sub-cellular fluorescence localization. We loaded a mixture of transfected cells exhibiting a nuclear-localized protein coupled to mCherry and non-transfected cells doubled stained with CellTracker Orange and Green which exhibited diffuse, whole-cell fluorescence. We distinguish between the two populations by overlaying orange fluorescence and brightfield images. The laser is then used to remove cells exhibiting nuclear-confined fluorescence while leaving behind cells exhibiting whole-cell fluorescence, demonstrating that our platform could perform fluorescence localization/translocation-predicated sorts. CellTracker Green is used as a double stain for validation.
Cell Health
Cell viability and potential for cell damage is a point of concern when using any cell manipulation technique. Our method is likely to be relatively benign, as our use of a weakly focused 980-nm beam for up to 30 s at power levels of ~100–150 mW for cell manipulation is considerably gentler than parameters in many optical tweezers applications, where the beam is focused to micron-sized spots, sometimes at power levels up to ~1 W for longer durations. Considerable effort has been made to determine cell damage thresholds for optical manipulation. Studies have considered metrics including post-exposure clonability20, motility21, DNA damage22, 23, and viability22. We compare the laser beam parameters present in our platform with the minimum harmful levels found in literature in Table S-1, adapted from Wang et al24. Wang et al. evaluated stress pathway gene expression levels in a HeLa line to show that their particularly high powers used were not damaging; their parameters are shown as an acceptable operating point in Table S-1 for comparison.
These health studies did not explicitly separate thermal damage-effects from strictly photon-damage effects. This is largely because, in general, heating due to optical tweezers is influenced heavily by absorption of the trapping medium, and typical temperature rises in water have been reported between ~1–10 K/100 mW optical power, with the lower end of the range reported for cell manipulation22, 25, 26. The large spot size used by our method results in power and energy densities orders of magnitude lower than reported damage thresholds. Further, three of the examples in Table S-1 use wavelengths of ~1064 nm. Liang et al. showed that the 990-nm wavelength is considerably less harmful than 1064 nm20, so damage thresholds from Liu and Mohanty may be more pessimistic than those possible at 980 nm.
We additionally performed a measurement of viability on-chip using Trypan Blue exclusion. Upon irradiating 50 cells at 150 mW for 30 s, the most extreme parameters we would consider for cell removal, we observed no statistical differences in viability between irradiated BA/F3 cells (97.3%, n=37) and non-irradiated cells (97.3%, n=195) in the device, and both were similar to viability measured in dish controls (97.9%, n=512). These results suggest that neither the cell loading procedure, nor hydrodynamic transport and trapping on the device, nor upper limit of laser irradiation impacted viability, confirming the results of expected viability given our optical parameters and standard microfluidic architecture. Cell retrieval from the device requires a simple pipetting step, which is standard lab practice and unlikely to damage cells. Therefore, we consider our technique to be within the parameter space for healthy, viable cell sorting.
Quantification of Sorting Performance
Our device demonstrated purification performance that would be useful in applications with small numbers of starting target cells. Table S-2 extensively quantifies the capabilities of our present design. We define population purity as the percentage of target cells comprising a total cell population, while target cell ratio is the ratio of target cells to unwanted cells. Enrichment is the target cell ratio after sorting divided by the target cell ratio before sorting. We determined these numbers by analyzing cell array images before sorting and by analyzing images of the bottom of the collection reservoir after sorting, as implied in Figure S-1.
When using a total cell starting number of ~3000 and an initial target cell ratio of ~1/20, output purities ranged from 81%–89%, and enrichment ranged from 78–155×. Impurities came primarily from two paths. The first impurity source was random release of cells stuck non-specifically outside of microwells during the time of target cell selection. This impurity source was small compared with random release of untargeted cells from microwells at release time due to their partial instability within traps. This release rate correlated positively with flow rate, necessitating the use of the slowest flow rate during release which manages to avoid re-trapping of removed cells (> ~ 1 μL/min). However, flow rates smaller than 4 μL/min unreliably maintained flow through the device during release, possibly due to re-closing of the punctured membrane in the reservoir at low flow rates. These constraints dictated the lowest useable flow rate, and, by implication, the ceiling on purity, for the current design.
Cell losses between removal and transport to the collection reservoir are small (~18–28%) and could be due to non-specific adhesion within the device or possibly recapture by the array. The most inefficient step at present is the manual transfer of target cells from the collection reservoir to a 96-well plate via pipette. In two attempts at transfer, one attempt transferred 74% of target cells, while the other transferred 26%. These losses existed largely because cells tended to sediment just under the glass interface between the PDMS and the reservoir, while the hole in the glass between the reservoir and flow channel was slightly too small for a pipette tip to directly fit into the channel. These losses are straightforward to eliminate in future re-designs of the device; our focus in this report is on the laser-based sorting aspect of the system.
DISCUSSION
We have demonstrated examples of image-based sorting that are either cumbersome or impossible to carry out with existing technologies. Because our device allows cells to be observed over time before sorting, we can sort based on combinations of spatial and temporal information obtained through any microscopy technique, enabling complex phenotype sorting. We have demonstrated that our platform presently allows straightforward image-based inspection and sorting of thousands of cells. Our platform offers simple scalability to large sizes with minimal additional complexity. We have successfully demonstrated a functional 10,000 site array, and fabricating larger arrays is trivial. The strongest limitation of further scaling will likely not be the complexity of fabricating a larger array and the bookkeeping of information regarding each site, but rather the array inspection speed and image processing time to make sorting decisions. With respect to data mining, the platform is therefore limited by a constraint common to all array-based methods and LCM-based approaches, inspection and data analysis time, rather than by the specific technology used.
Array inspection time ultimately dictates the temporal resolution of assays. We can presently inspect a 10,000 site array under brightfield illumination and two fluorescence wavelengths in about 25 minutes when using a 10× objective lens. We can achieve even faster image-based screening in specific types of assays with minor modifications. In temporal whole-cell fluorescence applications, where total cell fluorescence signal is the critical information to capture, simply placing a 0.5× de-magnifier before the CCD while using the same 10× objective lens could reduce this time by a factor of 4. Wells could likely be packed more densely; reducing the center-to-center distance between 30-μm-diameter wells from 65 μm to 45 μm would double the area density of trapped cells. With these two simple changes, we could achieve an eightfold increase in sampling rate for a given number of cells, yielding a 3 -minute inspection time for a 10,000 site array. Using a larger CCD could further increase the rate.
Cell removal is currently simple and straightforward; software stores locations of target cells and scans the automated stage back to target sites for removal automatically. Automating fine laser alignment (which is now done manually) immediately before cell release would quicken release by ~ 5–7 s per site. Using slightly higher laser powers briefly to overcome surface interactions may also quicken cell release by a few seconds. The most dramatic improvements could be made by incorporating multiple beams, allowing quasi-parallel release. For instance, we could use a four-beam system with 125 mW beams (Avanex produces low-cost 980 nm, 600 mW single mode output semiconductor laser diodes) and independently steer the beams via mirrors. This off-chip complexity is easily abstracted from the user, and provides a realistic avenue for scale up in release. These two changes could reduce the average total removal time per cell to ~10 s or less, making removal of 100–300 cells per hour practical, independent of the type of imaging assay employed.
The current purity and enrichment performance is useful for numerous assays even without expansion of sorted cells. With target cell purities between ~80%–90% versus ~5% before sorting, enrichment of ~2 orders of magnitude, and sorted population sizes of ~50–100 cells, using our technique in conjunction with RT-PCR and/or engineered cell lines with fluorescent reporters could allow useful, quantitative assay readout with our current setup. However, purity performance can be even further improved. Purity can be increased by operating at lower flow rates, causing random release from the array to decrease. We did not observe flow stalling at low flow rates when the waste output was open, further suggesting that the membrane-puncture valve was responsible for the observed flow stalling. Replacing the membrane-puncture valve with a true on-chip valve-based architecture could likely allow operation at lower flow rates. Furthermore, the array could be angled relative to the release flow path, reducing the number of transitions a released cell must make over wells, reducing re-trapping probability and allowing even lower flow rates to be used. Improving removal speed would also improve purity, as the number of contaminating cells collected varies directly with the total time during which target cells are removed. Therefore, the post-sorting target cell fraction will approximately double for each halving of average cell removal time. We therefore believe that significant improvements to purity and enrichment are possible with further automation and more robust valve schemes. Moving to a valve-based architecture could also improve interfacing with a pipettor for more efficient transfer of cells from the device, as well as simplify the necessary support fluidics.
Pathways to automated localization-based screens also extend naturally from our platform. We demonstrated fluorescence localization-based sorting predicated on user input. Alternatively, the platform could support quantitative localization analysis via algorithms. Brightfield images or secondary whole-cell fluorescent staining could be used to quantitatively define cell area and the fractional area of the cell occupied by obtained fluorescence data from the fluorophore of interest could be used to determine the extent of localization. Any image segmentation-based approach would be compatible with our platform, limited only by the time required to execute the algorithms.
Microwells need not be arranged in a grid-like fashion for large array-type experiments –microwell traps could be positioned throughout a substrate to enable addressable retrieval of particular cells in arbitrary alternative experiments. The technique generalizes easily to any application where the goal is to position cells in an environment, observe them using microscopy, and later retrieve particular cells.
Both FACS and LCM are essential, mainstay tools optimized for numerous applications and ideal for a core facility. Commercial LCM systems offer multiple approaches to fixed and live cell isolation based on image-based selection. Many offer immediate, direct registration between images of target cells and excised cell samples immediately after removal, offering a direct method for cell isolation. Our architecture trades the throughput of FACS for the ability to sort based on spatio-temporal fluorescence. Complementing the capabilities of commercially available LCM, our opto-fluidic approach provides ordered cell confinement during imaging and trades the complete transparency between selection and collection of target cells in LCM for practical portability to existing in-lab microscopy platforms, helping transform image-based sorting into a more routine capability.
CONCLUSIONS
We have presented an intuitive, user-friendly platform for image-based cell sorting. Our device combines the simplicity of microwell arrays with the intuitive operation of optical manipulation techniques in a system that is simple to fabricate and replicate. We have demonstrated an example of image-based cell sorting predicated on whole-cell fluorescence which is easily extendable to temporal, whole-cell, fluorescence-based assays. Furthermore, we have shown sorting based on spatial localization of fluorescence, addressing the need to sort based on protein translocations and protein localization, among other applications. In addition, the simple scalability of the architecture has enabled us to implement a 10,000-site addressable array, allowing us to perform assays with significantly large cell populations. Our architecture exhibits core sorting functionality with enrichment and purity performance immediately useful in applications where low-incidence cell purification and isolation is desired. Our device fills a role effectively unaddressed with traditional cell sorting techniques: practical selection of cells based on microscopy. We intend to use this platform to perform new types of viable cell sorting assays where critical information is encoded in temporal, morphological, or spatio-temporal fluorescence behavior in cells.
Supplementary Material
A table comparing the power/energy parameters of our method with known damage thresholds, a table and figure describing the performance of our device, and videos demonstrating the selective levitation and release of single cells from microwells are available free of charge via the Internet at http://pubs.acs.org.
Acknowledgments
This work was supported by the NIH (RR19652), the Singapore-MIT Alliance (SMA) and an American Society for Engineering Education Department of Defense fellowship. We thank David Appleyard and Prof. Matthew Lang for help with preliminary experiments, Salil Desai for culturing WeHi-3B cells for creating conditioned media, and Brianna Petrone for help in optimizing device protocols. We also thank the Microsystems Technology Laboratories for microfabrication facilities.
References
- 1.Eisenstein M. Nature. 2006;441:1179. doi: 10.1038/4411179a. + [DOI] [PubMed] [Google Scholar]
- 2.Ashcroft RG, Lopez PA. J Immunol Methods. 2000;243:13–24. doi: 10.1016/s0022-1759(00)00219-2. [DOI] [PubMed] [Google Scholar]
- 3.EmmertBuck MR, Bonner RF, Smith PD, Chuaqui RF, Zhuang ZP, Goldstein SR, Weiss RA, Liotta LA. Science. 1996;274:998–1001. doi: 10.1126/science.274.5289.998. [DOI] [PubMed] [Google Scholar]
- 4.Ashkin A, Dziedzic JM, Bjorkholm JE, Chu S. Optics Letters. 1986;11:288–290. doi: 10.1364/ol.11.000288. [DOI] [PubMed] [Google Scholar]
- 5.Buican TN, Smyth MJ, Crissman HA, Salzman GC, Stewart CC, Martin JC. Applied Optics. 1987;26:5311–5316. doi: 10.1364/AO.26.005311. [DOI] [PubMed] [Google Scholar]
- 6.Grier DG. Nature. 2003;424:810–816. doi: 10.1038/nature01935. [DOI] [PubMed] [Google Scholar]
- 7.MacDonald MP, Spalding GC, Dholakia K. Nature. 2003;426:421–424. doi: 10.1038/nature02144. [DOI] [PubMed] [Google Scholar]
- 8.Chiou PY, Ohta AT, Wu MC. Nature. 2005;436:370–372. doi: 10.1038/nature03831. [DOI] [PubMed] [Google Scholar]
- 9.Choi W, Kim SH, Jang J, Park JK. Microfluidics and Nanofluidics. 2007;3:217–225. [Google Scholar]
- 10.Taff BM, Voldman J. Analytical Chemistry. 2005;77:7976–7983. doi: 10.1021/ac0513616. [DOI] [PubMed] [Google Scholar]
- 11.Rettig JR, Folch A. Analytical Chemistry. 2005;77:5628–5634. doi: 10.1021/ac0505977. [DOI] [PubMed] [Google Scholar]
- 12.Di Carlo D, Wu LY, Lee LP. Lab on a Chip. 2006;6:1445–1449. doi: 10.1039/b605937f. [DOI] [PubMed] [Google Scholar]
- 13.Love JC, Ronan JL, Grotenbreg GM, van der Veen AG, Ploegh HL. Nature Biotechnology. 2006;24:703–707. doi: 10.1038/nbt1210. [DOI] [PubMed] [Google Scholar]
- 14.Yamamura S, Kishi H, Tokimitsu Y, Kondo S, Honda R, Rao SR, Omori M, Tamiya E, Muraguchi A. Analytical Chemistry. 2005;77:8050–8056. doi: 10.1021/ac0515632. [DOI] [PubMed] [Google Scholar]
- 15.Lee JN, Jiang X, Ryan D, Whitesides GM. Langmuir. 2004;20:11684–11691. doi: 10.1021/la048562+. [DOI] [PubMed] [Google Scholar]
- 16.Shaner NC, Campbell RE, Steinbach PA, Giepmans BNG, Palmer AE, Tsien RY. Nature Biotechnology. 2004;22:1567–1572. doi: 10.1038/nbt1037. [DOI] [PubMed] [Google Scholar]
- 17.Ozkan M, Wang M, Ozkan C, Flynn R, Birkbeck A, Esener S. Biomedical Microdevices. 2003;5:61–67. [Google Scholar]
- 18.Ashkin A. Biophysical Journal. 1992;61:569–582. doi: 10.1016/S0006-3495(92)81860-X. [DOI] [PMC free article] [PubMed] [Google Scholar]
- 19.Kim SB, Kim SS. Journal of the Optical Society of America B-Optical Physics. 2006;23:897–903. [Google Scholar]
- 20.Liang H, Vu KT, Krishnan P, Trang TC, Shin D, Kimel S, Berns MW. Biophys J. 1996;70:1529–1533. doi: 10.1016/S0006-3495(96)79716-3. [DOI] [PMC free article] [PubMed] [Google Scholar]
- 21.Neuman KC, Chadd EH, Liou GF, Bergman K, Block SM. Biophys J. 1999;77:2856–2863. doi: 10.1016/S0006-3495(99)77117-1. [DOI] [PMC free article] [PubMed] [Google Scholar]
- 22.Liu Y, Sonek GJ, Berns MW, Tromberg BJ. Biophys J. 1996;71:2158–2167. doi: 10.1016/S0006-3495(96)79417-1. [DOI] [PMC free article] [PubMed] [Google Scholar]
- 23.Mohanty SK, Rapp A, Monajembashi S, Gupta PK, Greulich KO. Radiation Research. 2002;157:378–385. doi: 10.1667/0033-7587(2002)157[0378:camodd]2.0.co;2. [DOI] [PubMed] [Google Scholar]
- 24.Wang MM, Tu E, Raymond DE, Yang JM, Zhang HC, Hagen N, Dees B, Mercer EM, Forster AH, Kariv I, Marchand PJ, Butler WF. Nature Biotechnology. 2005;23:83–87. doi: 10.1038/nbt1050. [DOI] [PubMed] [Google Scholar]
- 25.Peterman EJ, Gittes F, Schmidt CF. Biophys J. 2003;84:1308–1316. doi: 10.1016/S0006-3495(03)74946-7. [DOI] [PMC free article] [PubMed] [Google Scholar]
- 26.Liu Y, Cheng DK, Sonek GJ, Berns MW, Chapman CF, Tromberg BJ. Biophys J. 1995;68:2137–2144. doi: 10.1016/S0006-3495(95)80396-6. [DOI] [PMC free article] [PubMed] [Google Scholar]
Associated Data
This section collects any data citations, data availability statements, or supplementary materials included in this article.
Supplementary Materials
A table comparing the power/energy parameters of our method with known damage thresholds, a table and figure describing the performance of our device, and videos demonstrating the selective levitation and release of single cells from microwells are available free of charge via the Internet at http://pubs.acs.org.