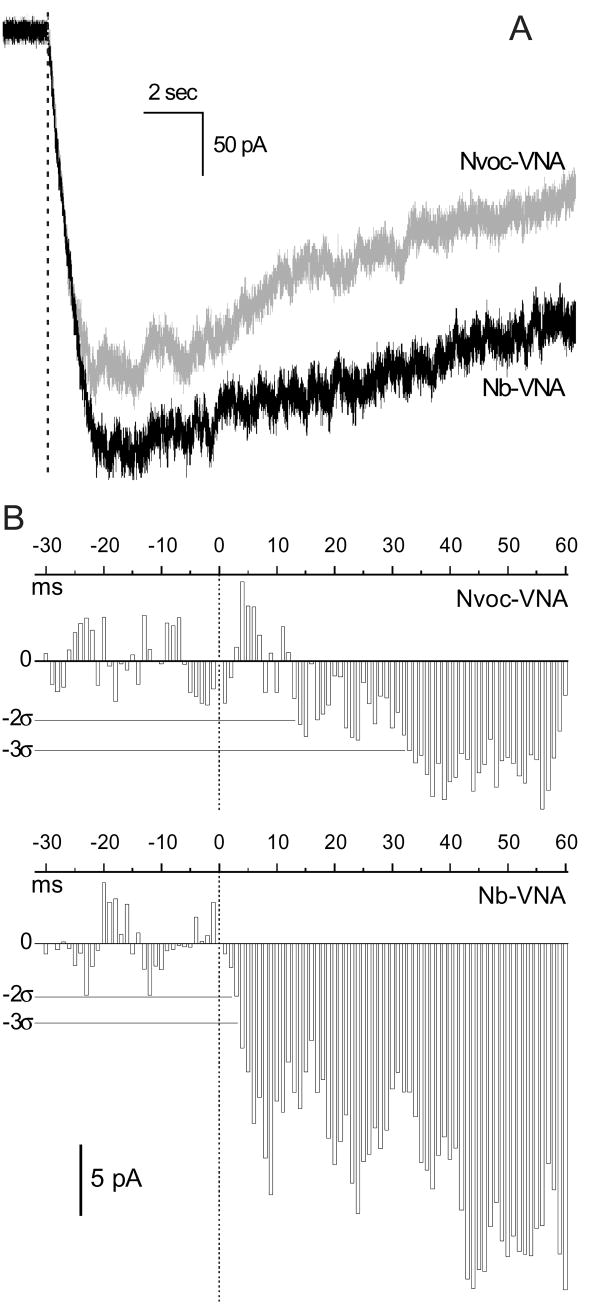
Figure 5. Comparson of inward currents activated by photorelease of Nb-VNA and Nvoc-VNA in nodose ganglion neurons.
(A) Whole-cell currents recorded in rat nodose ganglion neurons loaded with Nb-VNA (black trace; average of 3 experiments) or Nvoc-VNA (gray trace; average of 2 experiments), and voltage-clamped at −55 mV. Cells were loaded by incubation with 5 μM caged vanilloid for ∼7 min and then superfused with physiological saline. Currents were activated by a 5-msec flash of 355-nm light delivered to a 10-μm spot positioned over the edge of the neuron (typically 35 – 50 μm in diameter). Photolysis was thus restricted to a small region near the plasma membrane. The dashed line marks the start of the photolytic flash. The UV exposure was 1.1 μJ/μm2.
(B) Time courses of whole-cell currents around the time of photolysis shown at higher resolution. Data from Fig. 5A were grouped into 1-msec intervals and the average current in each interval was plotted as a bar graph against time (upper panel, Nvoc-VNA data; lower panel, Nb-VNA data); vertical dotted lines mark the start of the 5-msec flash. Current levels corresponding to 2 and 3 standard deviations (2σ and 3σ) from baseline are marked by thin horizontal lines in each panel. The current activated by Nvoc-VNA exceeded the 2σ level after 13 msec, and the 3σ level after 32 msec. The current activated by Nb-VNA exceeded both the 2σ and 3σ levels in < 4 msec.

