Abstract
Enantiomeric excess (ee) was originally defined as a term to describe enantiomeric composition, and was equated with optical purity. More recently, ee and its cousin de (diastereomeric excess) have been used (inappropriately) to quantitate stereoselectivity. The quantity ee has been used in equations describing processes such as kinetic resolutions, but these equations are unnecessarily complex due to the fact that it is enantiomer ratio, not enantiomeric excess, that directly reflects relative rates. A historical summary of the development of ee as an expression of enantiomer composition and enantioselectivity is presented, along with new equations and Figures defining and illustrating the stereoselectivity factor (s, Equation 9 and Figure 3), kinetic resolutions (Equations 11–13), and linear correlations of enantiomer composition of catalysts and products (Equation 15 and Figure 5). New figures illustrating nonlinear effects versus enaniomer composition are presented (Figure 6) and Kagan’s index of amplification (I, Equation 16) for positive nonlinear effects is discussed and illustrated (Figure 7). A case is made for the discontinuance of ee and de as descriptors of stereoisomer composition and stereoselectivity.
In their landmark 1971 book,1 Morrison and Mosher coined the term “enantiomeric excess” to describe the relationship of two enantiomers in a mixture: “Assuming a linear relationship between rotation and composition and no experimental error, percent ‘optical purity’ [op] is equated with the percent of one enantiomer over the other, which we shall designate percent enantiomeric excess (% e.e.)” Neglecting the percentage component, the following relationships define the terms ee and op:
| (1) |
| (2) |
where R and S are the respective fractions of enantiomers in a mixture such that R + S = 1, and [α]obs and [α]max are the observed and maximum specific rotations of a sample. Note that Morrison and Mosher explicitly specified equality between optical rotation and enantiomer composition, meaning that op = ee. The presumed equality between ee and the earlier term op was, of course, known prior to 1971, but sometimes by other names (e.g., enantiomeric purity).2
Origin of the term ee
In the late 1960s, it became obvious that there were serious limitations to using polarimetry to evaluate enantiomer composition. In 1968, Krow and Hill showed that the specific rotation of (S)-2-ethyl-2-methyl succinic acid, 1 (Figure 1), having an enantiomer composition of 92.5% S and 7.5% R (85% ee) varies markedly with concentration (Figure 1a), and even changes from dextrorotatory to levorotatory at higher concentrations.3 In 1969, Horeau followed up on Krow and Hill’s observation by measuring the specific rotation, at constant concentration, of samples of 1 having known enantiomer composition.2 He found that the two quantities were unequal except when enantiopure and racemic, and this deviation from linearity has become known as the Horeau effect (Figure 1b). In 1973, Yamaguschi and Mosher showed that the specific rotation of enantiopure 1-phenylethanol could be enhanced by the addition of acetophenone, an achiral impurity!4
Figure 1.
(a) Left, deviation of specific rotation of 1 vs concentration;3 (b) Right, nonlinearity of optical purity vs enantiomeric excess of 1.2
Thus, optical purity is not a satisfactory descriptor of enantiomer composition. New terminology was needed to unequivocally describe enantiomer composition of a sample, one which did not rely on a physical property. The term “enantiomeric excess” is unequivocal, since it describes the relationship between two enantiomers, as determined by whatever means are available. Thus, in the context of removing ambiguity, coining the term “%ee” was a logical development. But, if chemists had not relied on optical rotation for so many years to determine enantiomer composition, would we ever have defined “ee “ as an expression of enantiomer composition or purity? Certainly not. The association between enantiomer composition and optical “purity” is unfortunate, as it implies that the “impurity” is the racemate, and not the minor enantiomer.
Stereoselectivity
In the 1970s and 1980s, as methods of asymmetric synthesis advanced, the composition of enantiomerically enriched products was expressed as ee, and usage expanded to include the use of ee to describe stereoselectivity. Does this make sense? Consider the reaction of any prochiral substrate, S, that gives enantiomeric products, PR and PS, under conditions of kinetic control. The relative rates of reaction determine the outcome. The product ratio (PR/PS) is given by
| (3) |
where k1 and k2 are the rate constants for the formation of PR and PS, respectively. ΔΔG‡ is the difference in the transition state energies for each process: , where and are the free energies of activation for the formation of PR and PS, respectively. From this equation, it is clear that enantiomer ratio is the most appropriate relationship to describe enantioselectivity.
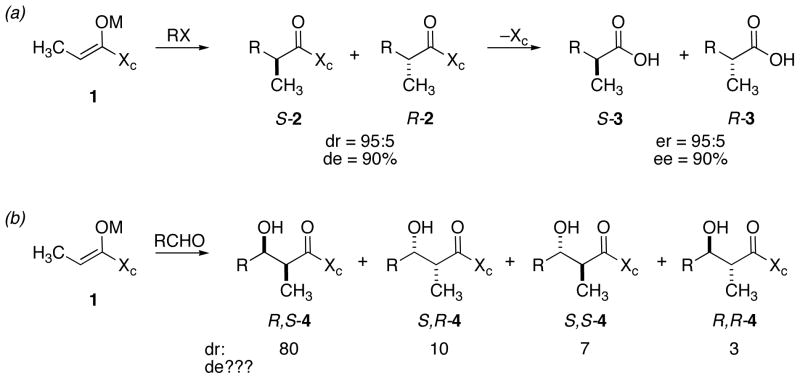
Also during the 1980s, as methods of auxiliary mediated asymmetric synthesis advanced, “ee” spawned the term “de” (diastereomeric excess). The idea was that - once a chiral auxiliary is removed, the ee of the product would equal the de of the educt. An example is shown in Scheme 1a. Hypothetical enolate 1 (Scheme 1a) having chiral auxiliary Xc, is alkylated with an alkyl halide to give diasteromeric products S-2 and R-2 in a ratio of 95:5. Removal of the auxiliary affords enantiomers S-3 and R-3 in the same ratio, assuming no adventitious enrichment during purification. However, one must ask: what is gained by expressing the diastereomer composition of 2 as % de? The product is 95% pure, not 90%. The relative rate for formation of the S and R diastereomers is 95:5 (19:1), not 90:10 (9:1). When the auxiliary is removed, 3 is 95% S, with a 5% impurity of R-3. Thus, critical examination of “% de” as a criterion or statement of selectivity or purity reveals the weakness of both ee and de.
Scheme 1.
The use of de as an expression of selectivity or diastereomer composition is impossible when more than one stereocenter is formed. Consider the aldol addition of enolate 1 shown in Scheme 1b. There are four possible diastereomers of aldol adduct 4. In this hypothetical example where the diastereomers are formed in a normalized ratio of 80:10:7:3, trying to incorporate a term such as de into a description of the steric course of the reaction adds nothing and detracts considerably.
Methods of analysis of enantiomer composition
Analytical methods such as NMR,5–8 and especially chiral stationary phase chromatography9,10 have made measurement of enantiomer composition trivially easy and considerably more accurate than polarimetry in determing enantiomer composition. In fact, polarimetry is rarely used for this purpose anymore. Emerging methods of high-throughput analysis of enantiomer composition,11 including mass spectrometry12,13 and infrared spectroscopy14 measure er directly. What is gained by converting to ee?
Alternatives to ee
Over ten years ago, several authors discussed the desirability of dropping the use of ee15–17 In 1996, Kagan asked “Is there a preferred expression for the composition of a mixture of enantiomers?”, and concluded that “the use of enantiomeric ratio should be encouraged.”18 Enantiomer ratio has been expressed as both a number, q (i.e., a ratio having a denominator of 1), or as a ratio normalized as a percent (e.g., er = 98:2). Using q is preferable for comparison of relative rates, such as 100/1 or 1000/1. Normalizing the ratio to a percent or fraction (which Kagan called enantiomer composition, ec18) has several advantages in other instances. For example, product enantiomers or diastereomers whose ratios vary might range from 20:80 to 80:20 (R:S). If not normalized, the ratios, q, would be 0.25 and 4.0. In general, q could range from 0 to ∞. If q is defined as R/S, and if R ≥ S, then 1 ≤ q ≤ ∞; but if S ≥ R, then 0 ≤ q ≤ 1. In other words, for selective production of the R enantiomer, the range for q is 1 to ∞, whereas selectivity for the S enantiomer is in the range of 0 to 1. In this instance, expressing as a percent having a 50:50 mirror point is preferable. Expressing er as a percent or mole fraction is also most convenient if comparing literature reports of ee.
Mathematical treatments
It has already been shown by others that a normalized enantiomer composition (expressed as mole fraction R/(R+S)) is as convenient as ee for mixing of samples of different enantiomeric composition18 and is appropriate for evaluation of selectivity in dynamic thermodynamic resolutions.19 The quantity q is superior for the evaluation of temperature effects on selectivity,18 the comparison of relative rates15,18,20 in linear free energy relationships,18 and in the evaluation of the index of amplification in catalytic reactions exhibiting nonlinear behavior (see below).21
The quantity “ee” has been used to derive equations describing kinetic resolutions,22–24 and linear relationships between monomeric homochiral catalysts and enantioselectivity.21,25 To our knowledge, no derivations of equivalent equations using er have been published. Below, a normalized fraction of enantiomer composition is used in new equations describing these processes, obviating the need to cling to ee as an expression of enantiomer composition or selectivity.
Kinetic Resolutions
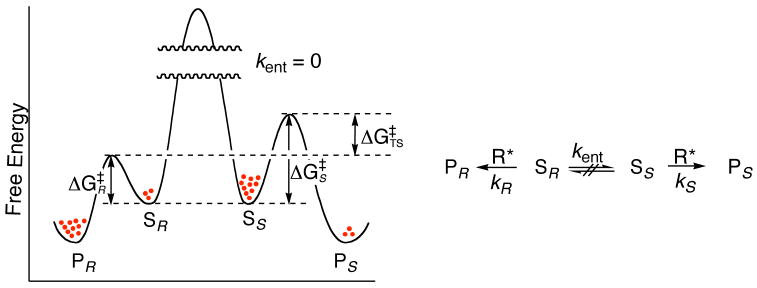
Using the principles of double asymmetric induction, it is possible to achieve resolutions by selective reaction of one enantiomer of a racemate with a chiral reagent, catalyst, or enzyme.23 The reaction is easily understood in terms of the general reaction and kinetic profile illustrated in Figure 2. A pair of enantiomeric substrates, Ss and SR, that are not interconvertible on the time scale of the reaction (i.e., kent = 0, or kR, ks ≫ kent), react at different rates with chiral reagent R*, or with an achiral reagent, R, in the presence of a chiral catalyst, such that kR ≠ ks. If kR > kS,the R enantiomer of the substrate (SR) will be consumed faster than the S (SS), leaving the unreacted substrate enriched in SS.
Figure 2.
Energy diagram and reaction scheme for a kinetic resolution.
The ratio of relative rates of the two enantiomers is known as the selectivity factor, s:
| (4) |
Kinetic resolutions are evaluated by comparing the enantiomer composition of unreacted substrate as a function of percent conversion. For example if kR > kS, one evaluates %SS vs. C. If one begins a kinetic resolution with a racemate, at t0. If at time, t, conversion is 0 <C< 1, then at time t,
| (5) |
Rearranging,
| (6) |
If consumption of SR and SS are first order or pseudo-first order in [S], then:
| (7) |
Kagan23 used these equations, plus the definition of ee, to show that the selectivity factor is related to C and ee by:
| (8) |
However, integration of Equation 7 and substitution from Equation 6 reveals that the stereoselectivity factor, s, is more readily (and simply) expressed as Equation 9:
| (9) |
This relationship is valid for all cases where the reaction is first order with respect to substrate, and any order with respect to R* or to an achiral reagent, R, in the presence of a chiral catalyst.23
In 1975, Horeau22 showed that it is possible to prepare a sample of any enantiomeric purity by kinetic resolution, beginning with either a racemate or an enantiomerically enriched substrate, and using the selectivity factor, s, to calculate the necessary extent of conversion, C, to achieve the desired ee, using Equation 10:
| (10) |
where ee0 is the ee of the substrate, S, at time zero.
However, the relationship is more simply expressed as Equation 11:
| (11) |
where Ss and SR are the desired fractions of unreacted enantiomer after the resolution, and are their fractions at t0.
Solving for C in Equation 11, one obtains:
| (12) |
Here again, the conversion necessary to achieve the desired er is C, and s is the selectivity factor. For example, a kinetic resolution having s = 5.0 can be used to enrich a sample from 90:10 er to 99:1 er by carrying the resolution to 50.1% conversion:
If starting with a racemate (50:50 er), equation 12 simplifies to:
| (13) |
With a selectivity factor of 5.0, a racemate can be enriched to 99:1 er by carrying the resolution to 84.0% conversion:
To illustrate these principles graphically, Sharpless plotted ee as a function of conversion for several values of s.24 Figure 3 shows similar plots of the relationship of enantiopurity, this time using Equation 9, for three values of s.
Figure 3.
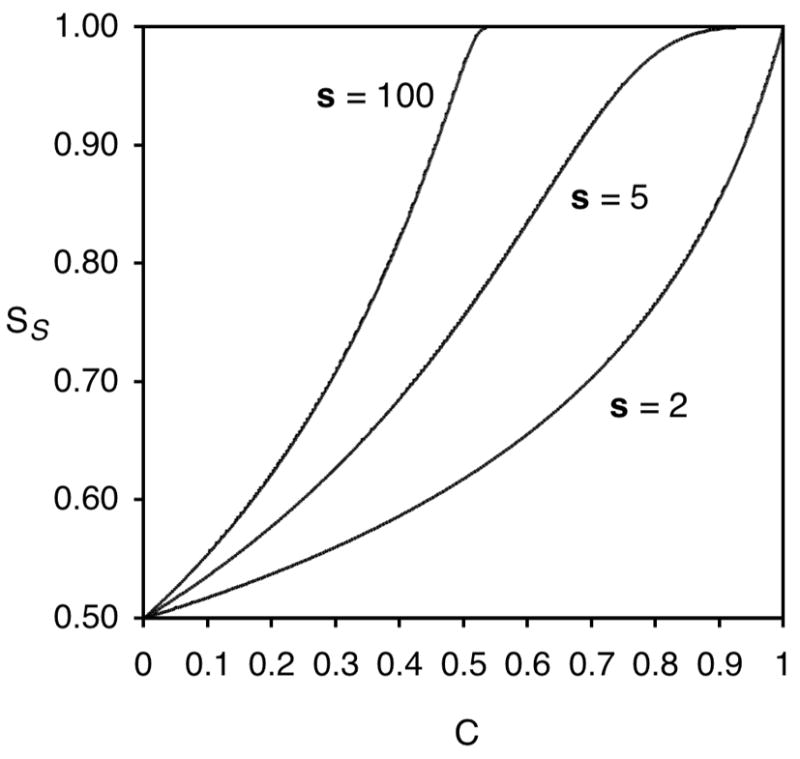
Relationship between fraction unreacted S-substrate enantiomer (SS) and conversion (C) in a kinetic resolution for three values of s.
Catalysts and reagents that are not enantiopures
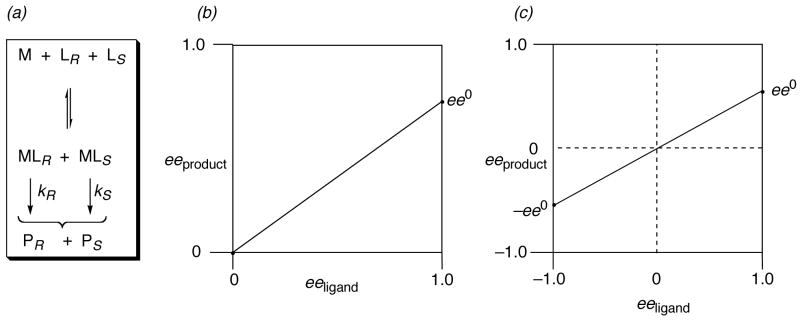
In order to evaluate and appreciate asymmetric catalysis, one must think in four dimensions: the x, y, z coordinates of transition state assemblies, as well as the kinetics of the catalyzed reaction.26 For a chiral metal catalyst having one chiral ligand (ML), assume that the R enantiomer of the ligand (LR) produces predominantly the R enantiomer of the product (PR), that the catalyst is monomeric, and there is only one catalyst molecule in the transition state of the stereoselective step. The reaction scheme is shown in Figure 4a: kR and kS are the rate constants for reaction with the R and S enantiomers of the catalyst, respectively. When the chiral ligand is enantiopure, the selectivity of the reaction is reflected in the enantiomeric composition of the product. This can be expressed as ee0 or as (the fraction of R product). Under these conditions, Kagan21 has shown that the ee of the product is a linear function of the ee of the ligand:
| (14) |
as plotted in Figure 4b. The slope of the line is ee0 and the y intercept is at the origin. However, this is really only a partial plot of the possible situations. If the S enantiomer of the ligand is in excess, and the ee is defined as in Equation 1, the more complete situation is as shown in Figure 4c, where −1 ≤ ee ≤ 1.
Figure 4.
Linear relationship between eeproduct and eeligand in asymmetric catalysis, where , when LR = 1 and Ls = 0. Likewise, when LR = 0 and LS = 1.
The linear function in Figure 4c can be replotted as shown in Figure 5, where is the fraction of the product R enantiomer when the R ligand is enantiopure. Since PR + PS = 1, and since when LR = 0, the slope of the line is ( ) and the y intercept is . It follows that the equation describing the line is given by:
| (15) |
where LR is the fraction of the R enantiomer of the ligand.
Figure 5.
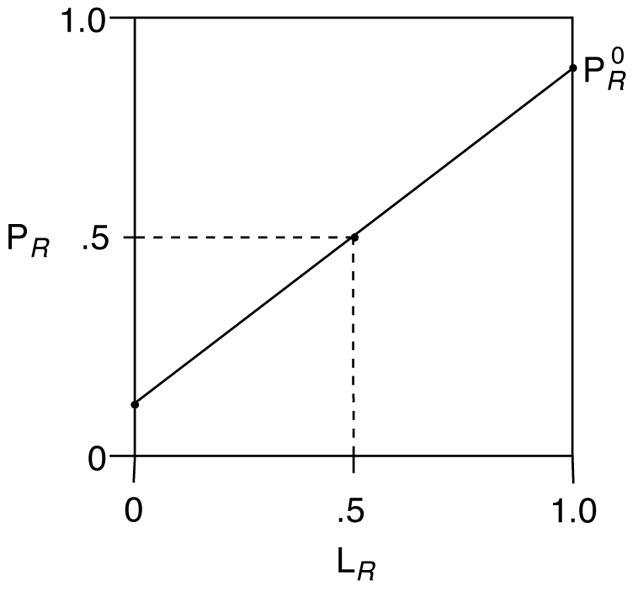
Linear relationship between enantiomeric composition of ligand and product in asymmetric catalysis.
This derivation of Equation 15, and the graphs in Figure 4a and Figure 5 assume catalysis by a metal-ligand complex, but the same relationship holds for organocatalysts.27,28 In all cases, when more than one ligand or catalyst is involved in the stereodifferentiating step, both homochiral and heterochiral combinations of ligands or catalysts are possible, and deviations from linearity are often observed.21,25
Nonlinear effects
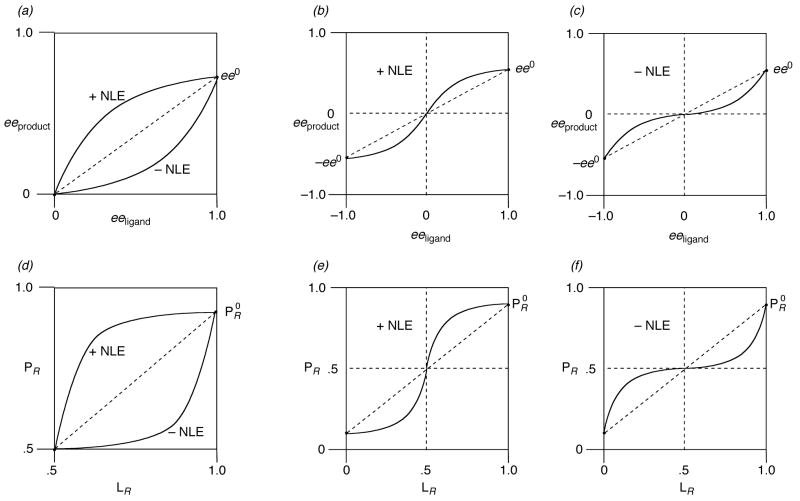
In 1976, Wynberg and Feringa showed that there can be real consequences of having mixtures of enantiomers participating in chemical processes.29 Ten years later, Kagan and colleagues demonstrated how the Wynberg principles can induce nonlinear effects (deviations from the linear relationship in Figure 5) in three reactions mediated by chiral catalysts.27 Figure 6a shows graphical representation of two types of nonlinear effects, as defined by Kagan and Mikami.27,30 When the ee of the product is plotted versus the ee of a ligand, Equation 14 predicts a straight line, as indicated by the dotted line in Figure 6a. If the ee of the product exceeds that of the catalyst, the phenomenon is a positive nonlinear effect (+ NLE). Conversely, if the ee of the product is less than that predicted by Equation 14, it is a negative nonlinear effect (−NLE). Kagan has already illustrated the appearance of a positive nonlinear effect when the total enantiomer composition is taken into account (Figure 6b). The graphical representation of a negative nonlinear effect is shown in Figure 6c. The plots of nonlinear effects using LR and PR are similar in appearance, but with a steeper slope for the linear relationship, and more pronounced deviations for the nonlinear effects (Figure 6d-f).
Figure 6.
(a–c) Nonlinear effects in asymmetric catalysis plotted using ee21,25 (d,e) Plotted using er.
The index of amplification, I, for positive nonlinear effects is defined as follows:
| (16) |
where qobserved is the experimentally observed enantiomer ratio of the product, and qlinear is the enantiomer ratio predicted for a linear relationship according to Equation 15.21 Kagan showed that plotting the index of amplification as a function of the enantiomer composition of the ligand (or catalyst) provides a useful graphic tool with which to interpret nonlinear effects.21 Figure 7 shows a plot of the index of amplification as a function of LR for Noyori’s diethylzinc reaction.31 The maximum amplification occurs when the catalyst has ~60:40 er.
Figure 7.
Index of amplification, I, as a function of LR, for Noyori’s diethylzinc reaction.31
Summary
In 1971, there were good reasons to switch from optical purity, op, to an expression of enantiomeric composition that did not rely on a physical property. Enantiomeric excess, ee, was adopted because in most cases, ee = op, and polarimetry was the virtually exclusive method for determining enantiomer composition. In the intervening years, spectroscopic and chromatographic methods have displaced polarimetry as the primary means of determining enantiomeric composition, so the utility of ee as an expression of enantiomeric composition has vanished. Stereoselectivity in a reaction is reflected by the ratio of products. Under kinetic control, the relative rates of reaction determine the product ratio. Under thermodynamic control, the equilibrium constant determines the product ratio. The product ratios (er or dr) directly reflect the relative rates or equilibrium constant, and are the best descriptors of stereoselectivity, not the “product excess” (ee or de). As an expression of stereoselectivity, ee and de are clearly inappropriate. Use of ee in equations describing kinetic resolutions are unnecessarily complex, and are an artifact of a 19th century technique that is now rarely used for determination of enantiomer composition. In conclusion, it is recommended that the terms ee and de be abandoned in favor of er, dr and q as descriptors of stereoisomer composition and stereoselectivity. It may be of interest to teachers of organic chemistry that many introductory textbooks do not mention the concept of enantiomer composition (ee or er).
Acknowledgments
This work was supported by the National Institutes of Health (R01 GM56271 and P20 R15569). Acknowledgement is made to the donors of the Petroleum Research Fund, for partial support of this work (44364-AC1). I am grateful also to Peter Beak and Dieter Seebach for insightful discussions.
References
- 1.Morrison JD, Mosher HS. Asymmetric Organic Reactions. Prentice-Hall; Englewood Cliffs, NJ: 1971. [Google Scholar]
- 2.Horeau A. Tetrahedron Lett. 1969:3121–3124. [Google Scholar]
- 3.Krow G, Hill RK. Chem Commun. 1968:430–431. [Google Scholar]
- 4.Yamaguchi S, Mosher HS. J Org Chem. 1973;38:1870–1877. [Google Scholar]
- 5.Sullivan GR. In: Topics in Stereochemistry. Eliel EL, Allinger NL, editors. Vol. 10. Wiley-Interscience; New York: 1978. pp. 287–329. [Google Scholar]
- 6.Fraser RR. In: Asymmetric Synthesis. Morrison JD, editor. Vol. 1. Academic; Orlando: 1983. pp. 173–196. [Google Scholar]
- 7.Pirkle WH, Hoover DJ. In: Topics in Stereochemistry. Eliel EL, Allinger NL, editors. Vol. 13. Wiley-Interscience; New York: 1982. pp. 263–331. [Google Scholar]
- 8.Weisman GR. In: Asymmetric Synthesis. Morrison JD, editor. Vol. 1. Academic; Orlando: 1983. pp. 153–171. [Google Scholar]
- 9.Beesley TE, Scott RPW. Chiral Chromatography. John Wiley & Sons; ChiChester: 1998. [Google Scholar]
- 10.Schurig V. Chirality. 2005;17:S205–S226. doi: 10.1002/chir.20133. [DOI] [PubMed] [Google Scholar]
- 11.Finn MG. Chirality. 2002;14:534–540. doi: 10.1002/chir.10101. [DOI] [PubMed] [Google Scholar]
- 12.Tao WA, Zhang D, Wang F, Thomas PD, Cooks RG. Anal Chem. 1999;71:4427–4429. doi: 10.1021/ac990530h. [DOI] [PubMed] [Google Scholar]
- 13.Tao WA, Clark RL, Cooks RG. Anal Chem. 2002;74:3783–3789. doi: 10.1021/ac0201124. [DOI] [PubMed] [Google Scholar]
- 14.Tielmann P, Boese M, Luft M, Reetz MT. Chem Eur J. 2003;9:3882–3887. doi: 10.1002/chem.200304885. [DOI] [PubMed] [Google Scholar]
- 15.Selke R, Facklam C, Foken H, Heller D. Tetrahedron Asymmetry. 1993;4:369–382. [Google Scholar]
- 16.Seebach D, Beck AK, Schmidt B, Wang YM. Tetrahedron. 1994;50:4363–4384. [Google Scholar]
- 17.Gallagher DJ, Du H, Long SA, Beak P. J Am Chem Soc. 1996;118:11391–11398. [Google Scholar]
- 18.Kagan HB. Recl Trav Chim Pays-Bas. 1995;114:203–205. [Google Scholar]
- 19.Beak P, Anderson DR, Curtis MD, Laumer JM, Pippel DJ, Weisenburger GA. Acc Chem Res. 2000;33:715–727. doi: 10.1021/ar000077s. [DOI] [PubMed] [Google Scholar]
- 20.Masamune S, Choy W, Petersen JS, Sita LR. Angew Chem Int Ed Engl. 1985;24:1–76. [Google Scholar]
- 21.Fenwick DR, Kagan HB. In: Topics in Stereochemistry. Denmark SE, editor. Vol. 22. Interscience; New York: 1999. pp. 257–296. [Google Scholar]
- 22.Horeau A. Tetrahedron. 1975;31:1307–1309. [Google Scholar]
- 23.Kagan HB, Fiaud JC. In: Topics in Stereochemistry. Eliel EL, Wilen SH, editors. Vol. 18. Interscience; New York: 1988. pp. 249–330. [Google Scholar]
- 24.Martin VS, Woodard SS, Katsuki T, Yamada Y, Ikeda M, Sharpless KB. J Am Chem Soc. 1981;103:6237–6240. [Google Scholar]
- 25.Girard C, Kagan HB. Can J Chem. 2000;78:816–828. [Google Scholar]
- 26.Noyori R. Asymmetric Catalysis in Organic Synthesis. Wiley-Interscience; New York: 1994. pp. 124–131. [Google Scholar]
- 27.Puchot C, Samuel O, Duñach E, Zhao S, Agami C, Kagan H. J Am Chem Soc. 1986;108:2353–2357. doi: 10.1021/ja00269a036. [DOI] [PubMed] [Google Scholar]
- 28.Guillaneaux D, Zhao SH, Samuel O, Rainford D, Kagan HB. J Am Chem Soc. 1994;116:9430–9439. [Google Scholar]
- 29.Wynberg H, Feringa B. Tetrahedron. 1976;32:2831–2834. [Google Scholar]
- 30.Mikami K, Terada M. Tetrahedron. 1992;48:5671–5680. [Google Scholar]
- 31.Kitamura M, Okada S, Suga S, Noyori R. J Am Chem Soc. 1989;111:4028–4036. [Google Scholar]


