

Abstract
Objective
Deficient prosody is a hallmark of the pragmatic (socially contextualized) language impairment in Autism Spectrum Disorders (ASD). Prosody communicates emotion and intention and is conveyed through acoustic cues such as pitch contour. Thus, the objective of this study was to examine the subcortical representations of prosodic speech in children with ASD.
Methods
Using passively-evoked brainstem responses to speech syllables with descending and ascending pitch contours, we examined sensory encoding of pitch in children with ASD who had normal intelligence and hearing and were age-matched with typically-developing (TD) control children.
Results
We found that some children on the autism spectrum show deficient pitch tracking (evidenced by increased frequency and slope errors and reduced phase locking) compared with TD children.
Conclusions
This is the first demonstration of subcortical involvement in prosody encoding deficits in this population of children.
Significance
Our findings may have implications for diagnostic and remediation strategies in a subset of children with ASD and open up an avenue for future investigations.
Keywords: auditory brainstem, autism, pitch tracking, prosody
1. Introduction
Autism Spectrum Disorders (ASD) refers to the cluster of disorders including autism, Asperger Disorder, and Pervasive Developmental Disorder Not Otherwise Specified (PDD-NOS). Impairment in pragmatic (socially contextualized) language is a hallmark of all ASD. Prosodic elements of spoken language, including alterations in pitch, duration and amplitude at the word and phrase levels, convey pragmatic information including the importance of a particular word, the requirement for a response to an utterance, or the speaker's affective state. Whereas aberrant prosodic elements — poor inflection, excessive or misaligned stress, monotonous intonation — are known to characterize the expressive language of individuals with ASD (McCann and Peppe, 2003), less is known about the potential contribution of a neurological source to this receptive prosody deficit. Prosody in autism has been extensively investigated at cognitive and behavioral levels (Hobson, 1986; Shriberg et al., 2001; Rapin and Dunn, 2003; Paul et al., 2005) but a better understanding of the underlying neurophysiology is warranted. Specifically, subcortical responses to prosodic speech have never been studied in individuals with ASD.
1.1 Cortical processing of prosody in ASD
Although data addressing brainstem involvement are lacking, studies using cortical evoked potentials in patients on the autism spectrum (specifically Asperger Disorder) have demonstrated deficient encoding of speech and related this deficit to poor receptive prosody. For example, adults with Asperger Disorder who were presented with a woman’s name uttered neutrally or with scornful, sad, or commanding affect had relative difficulty identifying the emotional connotations compared with controls, and also showed significant differences in mismatch negativity (MMN, a response reflecting encoding of acoustic change) including longer latencies, smaller amplitudes, and fewer elicited responses (Kujala et al., 2005). In a second study (Korpilahti et al., 2006), boys with Asperger Disorder were presented with a woman’s name at two different fundamental frequencies (f0) to express either tender or commanding affect. Their N1 responses (reflecting stimulus onset) were both delayed and reduced in amplitude compared with controls, and their MMN responses were earlier, larger, and had atypical laterality. The most recent study using the MMN in this population showed an enhanced response (amplitude) in individuals with ASD in a constant-feature discrimination for both pitch and vowel stimuli, whereas this effect disappeared when the condition involved deciphering phonemes with pitch variations (Lepisto et al., 2007). These data are similar to earlier work by Lepisto and colleagues, indicating that adults and children with Asperger Disorder (Lepisto et al., 2006), as well as children with autism (Lepisto et al., 2005), had enhanced MMN responses to sounds that deviated in pitch from the standard stimulus. In this study, both the standard and deviant stimuli had constant pitch for the duration of the sound. However, they also showed reduced P3a responses (involuntary orienting response) to changes in pitch in speech, albeit non-variant, within the syllable.
1.2 Pitch and the auditory brainstem
Pitch is the psychophysical correlate of f0 and is determined by the rate of vocal fold vibration. The auditory brainstem encodes frequency components of speech with high fidelity such that the f0 and its harmonics can be extracted from the passively-elicited auditory brainstem response (Galbraith et al., 2004a; Krishnan et al., 2004; Kraus and Nicol, 2005; Krishnan et al., 2005; Musacchia et al., 2007; Wong et al., 2007). Accurate brainstem encoding of the pitch contour of a speech syllable is crucial for producing and perceiving both linguistic meaning (e.g. statement vs. question) and emotional affect in speech.
An emergent body of literature has demonstrated that pitch tracking in the auditory brainstem is experience-dependent, malleable and linked to the processing of higher order cognitive factors such as language and music. For example, adult native speakers of a tonal language (Mandarin) demonstrated more precise brainstem pitch encoding than did non-native speakers (Krishnan et al., 2004; Krishnan et al., 2005). Similarly, brainstem frequency-following responses (FFR) more faithfully encoded stimulus f0 contour and demonstrated more robust phase locking in musicians than non-musicians (Musacchia et al., 2007; Wong et al., 2007). Finally, brainstem pitch tracking can be improved by short-term training (Song et al., 2007).
Because click-evoked auditory brainstem responses have historically been used to detect abnormal auditory encoding of sound in the clinical setting, most existing ASD research assesses the integrity of the auditory brainstem via this method (Klin, 1993; Rapin and Dunn, 2003). However, work from our laboratory has demonstrated that some children with language-based learning problems exhibit deficient brainstem encoding of speech stimuli despite normal encoding of click stimuli (Banai et al., 2005; Song et al., 2006; Johnson et al., 2007). Thus, speech stimuli have been shown to be more sensitive and hence more useful than click stimuli for the detection of subtle abnormalities in the processing of language. This finding could be particularly relevant to children with ASD because the transient and periodic dimensions of speech stimuli convey prosodic as well as phonetic information.
To test the hypothesis that faulty brainstem representation of variations in pitch contributes to the impaired prosody in ASD, we compared responses to speech syllables with descending and ascending pitch contours in a population of children with ASD to those of a control population of typically-developing (TD) children.
2. METHODS
The Institutional Review Board of Northwestern University approved all research and consent and assent were obtained from the parent(s) or legal guardian(s) and the child.
Children were acclimated to the testing circumstances prior to experimental data collection. They were allowed to visit the laboratory and interact with the tester on multiple occasions. Some children brought an electrode home with them to better familiarize themselves with the neurophysiological procedure.
2.1 Participants
Of the 48 children originally recruited for this study, six (all children with ASD) were excluded for the following reasons: abnormal click-evoked brainstem responses (N=2), mental ability below inclusion cutoff (N=1), non-compliance resulting in inability to test (N=1), parental decision to discontinue due to the required time commitment of the study (N=1) and relocation (N=1). Final participants included 21 verbal children with ASD (N=19 boys, 2 girls) and 21 typically-developing children (TD, N=13 boys, 8 girls). Age range was 7–13 years old and mean age (years ± SD) did not differ between groups (9.90 ± 1.921 in ASD vs. 9.95 ± 2.085 in TD; independent two-tailed t-test; t=0.077, p=0.939).
Study participants were recruited from community and internet-based organizations for families of children with ASD. They were required to have a formal diagnosis of ASD made by a child neurologist or psychologist and to be actively monitored by their physicians and school professionals at regular intervals. Parents were asked to supply the names of the examining professionals, their credentials, office location, date of initial evaluation and the specific diagnosis made. These parent-reported diagnoses included autism (n=1), Asperger Disorder (n=7), PDD-NOS (n=1), and a combined diagnosis (i.e., Asperger Disorder/PDD-NOS; n=12). Additionally, parental reports indicated deficient prosody perception in the children with ASD. The diagnosis of ASD was supplemented by observations during testing such that included subjects were noted to have some or all of the following: reduced eye contact, lack of social or emotional reciprocity; perseverative behavior; restricted range of interests in spontaneous and directed conversation during testing set-up; repetitive use of language or idiosyncratic language; abnormal pitch, volume, and intonation; echolalia or scripted speech; and stereotyped body and hand movements. Diagnosis was also supplemented by an internal questionnaire that provided developmental history, a description of current symptoms, and functional level at time of entry into the study.
Further inclusion criteria for both TD and ASD groups were 1) the absence of a confounding neurological diagnosis (e.g. active seizure disorder, cerebral palsy), 2) normal peripheral hearing as measured by air threshold pure-tone audiogram and click-evoked auditory brainstem responses and 3) a full-scale mental ability score whose confidence interval included a value ≥80.
2.1.1 Hearing screening
Normal hearing thresholds and click-evoked wave V latencies confirmed normal hearing status and were required for inclusion in this study. On the first day of testing, children underwent a screening for normal bilateral peripheral hearing (≤20 dB HL) for octaves between 250 and 8000 Hz via an air conduction threshold audiogram on a Grason Stadler model GSI 61. Children wore insert earphones in each ear and were instructed to press a response button every time they heard a beep. At each subsequent test session, follow-up hearing screenings at 20 dB HL for octaves between 125 and 4000 Hz were conducted using a Beltone audiometer and headphones.
2.1.2 Mental and language ability assessment
The Wechsler Abbreviated Scale of Intelligence (WASI, four subtests) (Woerner and Overstreet, 1999) was administered to screen for intellectual ability and provided scores of verbal, performance, and full-scale mental ability (Fig. 1; mean and standard error values are plotted). A full-scale mental ability score whose confidence interval included a value ≥80 was necessary for inclusion in the study. Performance and verbal mental ability scores were recorded, but not used as inclusion criteria. Additionally, the Clinical Evaluation of Language Fundamentals-4 (CELF) (Semel et al., 2003) was administered to provide indices of core, expressive and receptive language abilities (Fig. 1). Performance on the CELF was not used as a study inclusion criterion.
Figure 1.
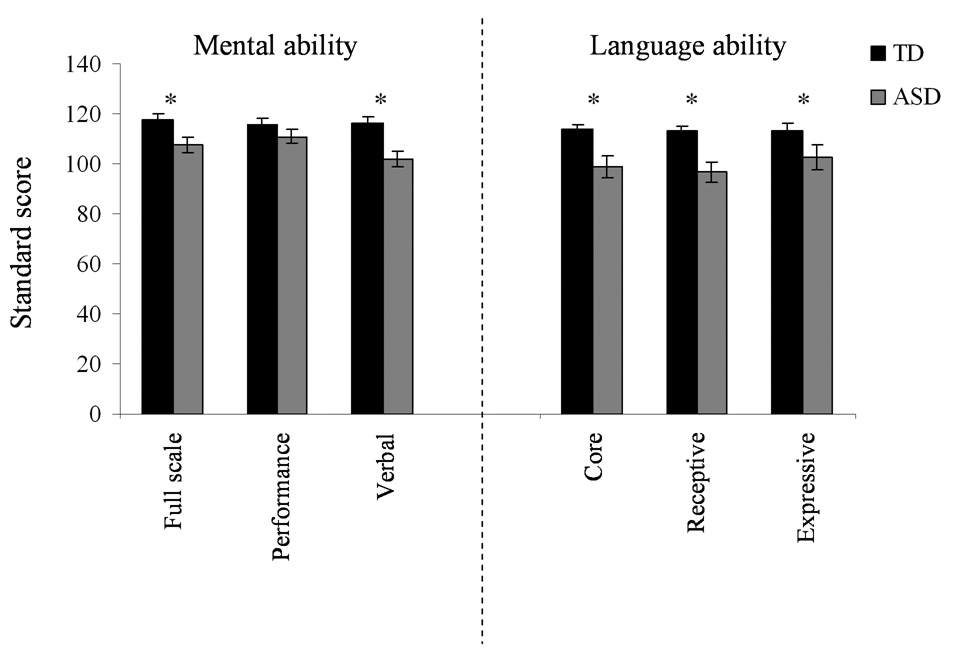
Mental (left) and language ability (right) means (standard errors) for TD and ASD groups. Children with ASD demonstrated poorer mental and language abilities, although their mental ability level was within normal limits.
2.2 Neurophysiology Recording and Stimuli
All neurophysiological recordings took place in a sound attenuated chamber. During testing, children sat comfortably in a recliner chair and watched a video of their choice while experimental stimuli were delivered monaurally to their right ear. The movie soundtrack was presented in free field with the sound level set to <40 dB SPL, allowing the child to hear the soundtrack via the unoccluded, non-test ear. Children were instructed to ignore the sounds being delivered to their right ear and attend to the movie. Because brainstem responses were collected passively, the results were not biased by attention and cognitive abilities, an important consideration with an ASD population. To ensure compliance of the child and to alert the tester of any complications during testing, the child’s parent(s) sat with the child in the chamber. At any time, if the child chose to discontinue testing or take a break during testing, s/he was allowed to do so without penalty.
Auditory evoked responses were recorded via three Ag-AgCl scalp electrodes located centrally (Cz), with an earlobe reference and forehead as ground; all electrodes maintained a contact impedance of ≤5 kΩ. Stimuli were presented via ER-3 insert earphones (Etymotic Research, Elk Grove Village, IL, USA).
The click stimuli (100 µs duration square waves with broad spectral content) were presented at 80.3 dB SPL at a rate of 13/sec Hz. Click-evoked responses (10.66 ms recording window) were digitally sampled at 24 kHz and were online bandpass filtered from 100–1500 Hz, 12 dB/octave. Trials with artifacts exceeding 23.8 µV were rejected online. Two blocks of 1000 non-rejected sweeps each were collected at the beginning of the neurophysiologic test session and an additional block of 1000 sweeps was collected at the conclusion to confirm that ear insert placement did not change during testing.
The speech syllables were created from a natural spoken /ya/ syllable (fully voiced, flat pitch contour) that was produced by a native English speaking female and subsequently manipulated in Praat (Boersma and Weenink, 2004).The speech sample was duration normalized to 230 ms before digitally manipulating the fundamental frequency (f0) contour of the original production to create the descending and ascending reciprocal pitch contours (descending: 220–130 Hz; ascending: 130–220 Hz). Descending and ascending contours were chosen to provide a basic model of statement versus question. Because the stimuli originated from the same speech token, all acoustic parameters, with the exception of f0, were identical.
Speech stimuli were presented at 60 dB SPL in alternating polarities. Alternating polarities were presented in order to minimize stimulus artifact and cochlear microphonics (Gorga et al., 1985). To avoid any potential confound of an anticipatory response, the stimuli were presented in random order with a variable interstimulus interval of 51 ms (±16 ms) (Neuroscan, Stim, Compumedics, El Paso, TX). Speech-evoked responses were recorded (Neuroscan, Scan, Compumedics) at sampling rate of 20,000 Hz. Two replications of 1200 sweeps/polarity (total, 4800) were recorded for each syllable. Trials with artifacts greater than 35 µV were rejected offline. On average, 92% of the trials (~8800/9600 sweeps; range: 6207–9567 sweeps) remained after artifact rejection.
2.3 Analyses
2.3.1 Click-evoked brainstem responses
Wave V latency was identified for each subject and needed to fall within the normal range for 80 dB SPL clicks. Delayed wave V latency was used as an exclusionary criterion because latencies beyond the normal range may indicate other confounding deficits.
2.3.2 Speech-evoked brainstem responses: Pitch tracking in the auditory brainstem
Speech-evoked response waveforms were averaged offline in Neuroscan with a recording time window spanning from 50 ms prior to the onset of the stimulus until 20 ms past the offset. Responses were bandpass filtered offline from 80–1000 Hz with a 12 dB/octave rolloff to isolate the frequencies that are most robustly encoded at the level of the brainstem. For the purpose of calculating signal-to-noise ratios (SNR), a single waveform per subject representing the non-stimulus evoked activity was created by averaging the neural activity prior to stimulus onset.
For all analyses, measures were first assessed in stimulus-specific responses and then averaged across stimuli to obtain a single number for each measure for each participant. This combination was possible because the same patterns were observed with both descending and ascending /ya/ conditions. Thus, the combined-stimulus averages are reported here. All pitch-tracking analyses were performed using routines coded in Matlab 7.0.4 (The Mathworks, Natick, MA).
Frequency-following response pitch contours were extracted for each subject for the f0 and second harmonic (H2) and analyzed with respect to the frequency contours of the stimuli. Pitch tracking and phase locking were described by measures of Frequency Error, Slope Error, and Pitch Strength. Frequency Error represented the accuracy of pitch encoding over the duration of the stimulus. Slope Error measured the degree to which the shape of the pitch contour was preserved in the response. Pitch Strength, a measure of response periodicity, indicated the robustness of neural phase locking to the stimulus f0 contour. Due to limitations of the autocorrelation method used for calculating Pitch Strength, H2 was assessed only by Frequency and Slope Error.
Pitch-tracking measures were derived using a sliding window analysis procedure. A 40-ms window was slid across the FFR in 1 ms increments, and an FFT and autocorrelation were computed on each 40-ms portion of the FFR. The window was shifted 190 times and this produced a total of 191 spectral and autocorrelational estimates. The time period encapsulated by each shift of the 40 ms window is referred to as a time bin. In the pitch-tracking and pitch strength plots, the time indicated on the x-axis refers to the midpoint of each 40-ms time bin. A short-term Fourier transform was calculated for each Hanning-windowed bin. The resulting spectrogram gave an estimate of spectral energy over time. The f0 and H2 contours were extracted from the spectrogram by finding the frequency (between 0 and 300 Hz for f0 and 260–440 Hz for H2) with the largest spectral magnitude for each bin. Spectral peaks that did not fall above the noise-floor (SNR<1) were excluded as possible f0 or harmonic candidates. The same short-term spectral analysis procedure was applied to the stimulus waveforms (methods for f0 extraction follow Musacchia et al., 2007; Wong et al., 2007).
The three measures of pitch tracking were calculated as follows: To obtain a measure of Frequency Error, the absolute Euclidian distance between the stimulus and response f0 and H2 (respectively) at each time bin was calculated and then averaged across all 191 bins. Slope Error represented the absolute difference between the slopes of the stimulus and response pitch tracking regression lines. For this measure, the extracted f0 and H2 data points were fit to a linear model from which a regression line was calculated. The slope of the regression line was recorded and compared to the slope of the regression line created from the stimulus waveforms (f0: descending stimulus, m=−440 Hz/sec; ascending stimulus, m=460 Hz/sec; H2: descending stimulus, m=−880 Hz/sec; ascending stimulus, m=920 Hz/sec). For calculating all pitch-tracking variables, stimulus measurements were derived from a recording of the original stimuli as presented through the Neuroscan and Etymotic equipment, as this recorded output waveform is an accurate representation of what the participants actually heard. Subtle differences between input and output stimulus waveforms account for the slight deviation in above-reported slopes of the descending and ascending stimuli.
The third measure of pitch tracking, Pitch Strength, was derived using a short-term autocorrelation method. This method is used to determine signal periodicity over time wherein a signal is compared to a time-shifted copy of itself. The time-shift is quantified in terms of lag (ms). For each time lag, a correlation r-value, representing the degree of signal periodicity or pitch strength, is calculated (expressed as a value between −1 and 1). Fundamental frequency is calculated from the autocorrelation function (r-value vs. lag) by finding the fundamental period — the time lag needed to obtain the correlational maxima — and taking the inverse (frequency = 1/period; e.g., 1/15 ms =66.67 Hz). Because there was no interest in frequencies below 67 Hz, the lag was limited to 15 ms.
For the stimulus, the fundamental period of each time bin was recorded. The Pitch Strength of each response bin was quantified as the r-value corresponding to the fundamental period of the stimulus at the corresponding time bin; larger r-vales indicated more periodic time frames. Similar to Frequency Error and Slope Error, Pitch Strength was the average r-value across the 191 bins. The reported mean r-values were converted to Fisher z’-scores for all statistical analyses. Running autocorrelograms (Fig. 3) (Krishnan et al., 2004; Krishnan et al., 2005; Musacchia et al., 2007; Wong et al., 2007) were generated as a means of visualizing and quantifying periodicity and Pitch Strength variation over the course of the response. The x- and y- axes are time and lag, and the third dimension, Pitch Strength, is plotted using a color continuum from black to white, with brighter colors representing higher correlations.
Figure 3.
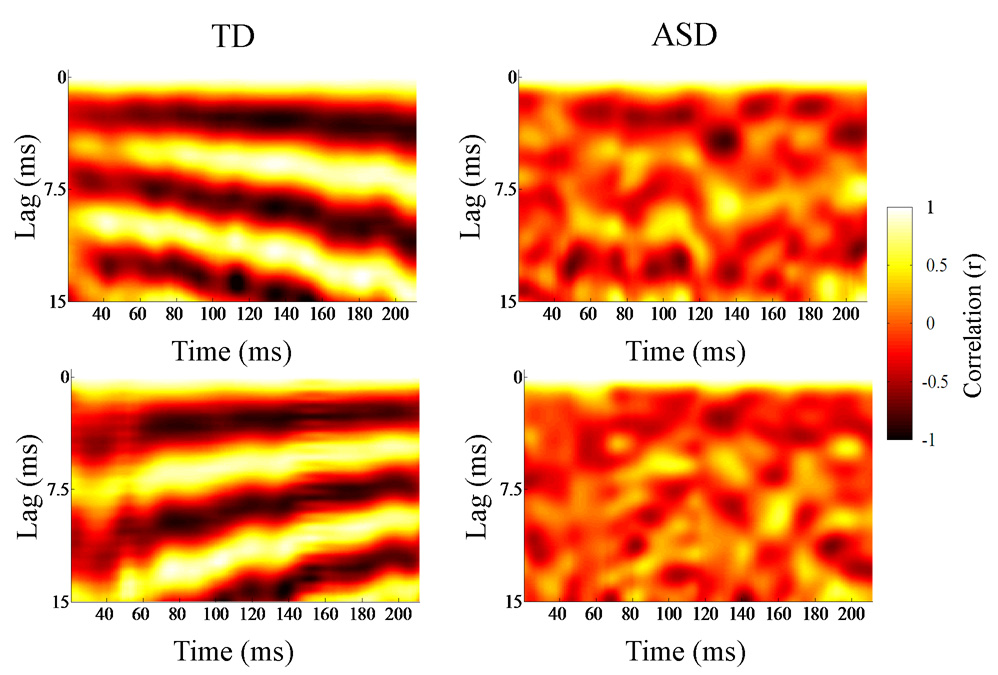
Autocorrelograms of individual TD (left) and ASD (right) brainstem responses to descending (top) and ascending (bottom) /ya/ stimuli. Running autocorrelations quantify the degree of neural phase locking over time. The autocorrelograms (lag versus time) act a means of visualizing periodicity variation over the course of the response. The time indicated on the x-axis refers to the midpoint of each 40-ms time bin analyzed. The y-axis refers to the amount of lag between the signal (each 40-ms time bin) and a time-shifted copy, and the third dimension, Pitch Strength, is plotted using a color continuum from black to white, with brighter colors representing higher correlations, or more robust encoding of the fundamental frequency contour. The TD response indicates more precise phase locking of pitch than the ASD response.
2.3.3 Composite score
To comprehensively quantify the deficit in pitch tracking, Frequency Error of f0, Pitch Strength and Frequency Error of H2 scores were transformed into z-scores and then averaged together to obtain a composite pitch-tracking score for each subject. To account for the fact that lower values were better for Frequency Error, while higher values were better for Pitch Strength, Pitch Strength z-scores were first multiplied by a factor of negative one before being entered into the composite score calculation.
2.4 Statistical Analyses
A one-way analysis of variance (ANOVA) was used to evaluate group differences in click-evoked response latencies; the two-tailed result is reported because no differences were expected since all children met our inclusion criterion. Multivariate analyses of variance (MANOVA) were conducted between groups to test the hypothesis that sensory encoding of acoustic cues of prosody in speech (here, pitch and harmonic contour) is disrupted in children with ASD. Dependent variables included Frequency Error, Slope Error, and Pitch Strength; diagnosis was the fixed factor. Due to limitations inherent in the interpretation of a MANOVA (Tabachnick and Fidell, 2007), one-tailed independent t-tests (because our pitch-tracking results were hypothesis-driven) and Cohen’s d effect sizes were calculated to describe diagnostic group differences (p-values ≤0.05 and d ≥0.50 were required to be considered significant). Levene’s Test for Equality of Variances was applied to each statistical analysis and, when relevant, the reported p-values reflect corrections based on unequal variances. The non-parametric Kruskal-Wallis statistic was used for subgroup comparisons due to the smaller number of subjects in these groups.
3. RESULTS
3.1 Age, sex and intelligence considerations
Because of the variability in age and intelligence, we considered these variables in preliminary statistical analyses. Further, due to the greater incidence of ASD in males versus females, our ASD group included a majority of male participants. Since sex differences can occur in brainstem responses (Jerger and Hall, 1980; Rupa and Dayal, 1993), we also evaluated effects of sex. The distribution of age did not vary between groups and therefore it is unlikely to be a contributing factor to any of the differences we report (χ2=3.652, p=0.724). There were no significant relationships between age, sex or mental ability with any of the neurophysiological measures (Pearson’s r-value≤0.093 p≥0.557, all tests). Finally, although there were no significant correlations, preliminary MANOVA ruled out age, sex and mental ability as co-variates for the neurophysiological measures because they were not statistically significant. Thus, subsequent analyses were conducted without these co-variates.
3.2 Brainstem responses to click stimuli
All children exhibited normal brainstem responses to click stimuli; there were no between group differences (ASD mean latency=5.6 ms (SD=0.19), TD mean=5.6 ms (SD=0.17); ANOVA, F(1,40)=0.772, p=0.385). As a combined group, the TD and ASD wave V latencies ranged from 5.15–5.90 ms, with TD responses ranging from 5.28–5.90 ms. These results were consistent with their normal pure tone audiometric hearing thresholds (≤20 dB HL) and indicated normal encoding of the onset of transient acoustic stimuli.
3.3.1 Encoding f0
Despite demonstrating normal brainstem responses to click stimuli, children with ASD demonstrated deficient encoding of pitch in speech compared with TD children. Frequency Error was compared between groups and the ASD responses demonstrated less accurate pitch tracking (TD mean (SD)=8.52(2.201) Hz; ASD=10.10(2.912); t=1.99, p=0.027; d =0.61; Fig. 2, Fig. 4). Slope Error indicated a trend toward greater error in the ASD group (TD=30(20) Hz/sec; ASD=50(44); t=1.58, p=0.063; d=0.59; Fig. 2, Fig. 4). Further, Pitch Strength autocorrelations were significantly higher in TD responses (TD mean (SD) r=0.39(0.198); ASD mean (SD) r=0.30(0.159); t=1.96, p=0.0465; d=0.56; Fig. 3, Fig. 4). Lower Frequency Error and higher Pitch Strength values indicated that the stimulus f0 contour was better preserved and more robustly encoded in the brainstem responses of TD subjects.
Figure 2.
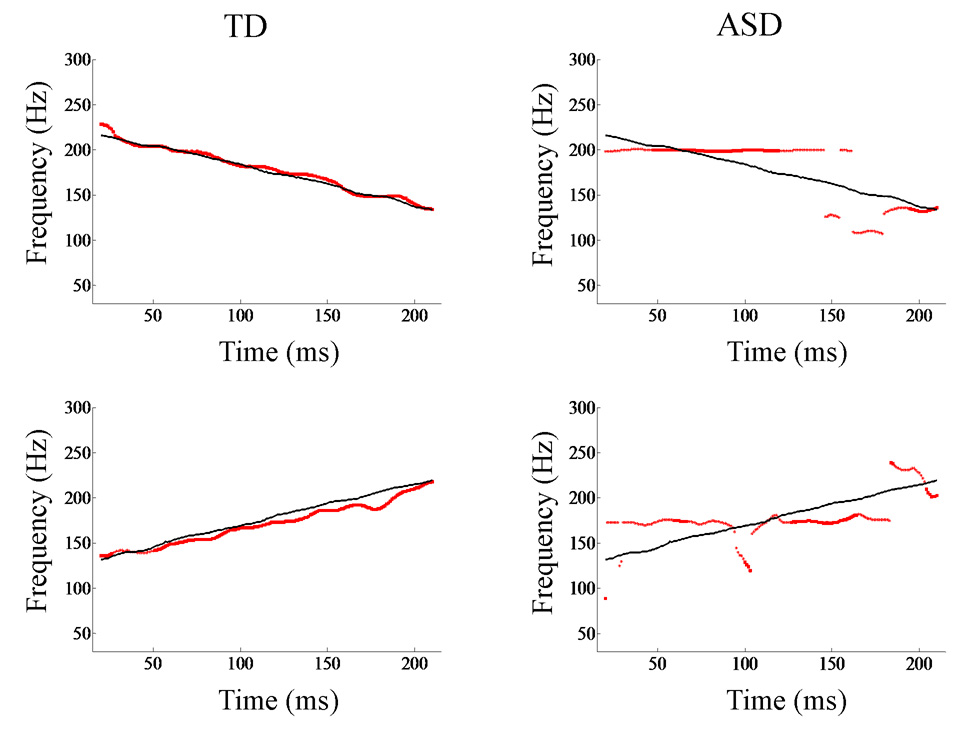
Representative pitch-tracking contours extracted from brainstem responses of TD (left) and ASD (right) individuals. The fundamental frequency contour of the response (red) is plotted against the contour of the stimulus (black). Shown here are data from both the descending (top) and ascending (bottom) /ya/ stimuli. Pitch tracking is more precise in the typically-developing system. Frequency (Hz) is plotted along the y-axis. The x-axis shows the time corresponding to the midpoint of each 40-ms time bin analyzed.
Figure 4.

Group means (standard error) for f0 Frequency Error (Hz), Pitch Strength (autocorrelation r values), H2 Frequency Error (Hz) and Composite Score (z values). Encoding was significantly more precise in TD responses (left, black) as compared to the ASD group as a whole (middle left, dark gray). ASD OUT children (light gray) are those who have pitch tracking composite scores outside of the TD group, while ASD IN children (middle right, white) have scores that are within the normal range. The ASD OUT group (far right, gray) was largely driving the significant group differences, as the ASD IN group demonstrated encoding similar to the TD group.
3.3.2 Encoding harmonics
Frequency Error and Slope Error of H2 were also compared; because an autocorrelation is not meaningful for the harmonics, Pitch Strength was not calculated. ASD responses demonstrated greater Frequency Error (TD=13.43(2.071) Hz; ASD=15.06(2.392); t=2.368, p=0.02; d=0.73), but Slope Error did not differ between groups.
3.3.3 Composite score and subgrouping of participants
The composite score, described above, was calculated for each participant to provide a comprehensive measure of pitch encoding deficits in the brainstem. TD responses demonstrated significantly better encoding of the pitch contour than ASD responses (TD z=0.00(0.790); ASD z=0.68(0.888), t=2.636, p=0.012; d=1.15; Fig. 4). Using this composite score, we were able to isolate 5 children with ASD (~20%) who demonstrated pitch-encoding deficits greater than 1.65 standard deviations (accounting for 95% of the variance). Therefore, children with ASD were classified as deficient pitch trackers (“ASD OUT,” n=5) or typical pitch trackers (“ASD IN,” n=16) on the basis of their composite scores. The ASD OUT group included three children with Asperger Disorder, one with PDD-NOS, and one with “Autism Spectrum Disorder plus Sensory Integration Disorder”.
3.3.3.1 Encoding f0
The individual pitch-tracking measures were re-assessed (Table 1) and revealed that the overall diagnostic group difference reported previously was driven by the ASD OUT group whereas the ASD IN group demonstrated averages comparable to the TD group (Fig. 4). There was a significant group difference in Frequency Error (Kruskal-Wallis test, H(2)=10.415, p=0.005) and Pitch Strength (H(2)=7.337, p=0.026), Slope Error did not reach significance using this categorization (H(2)=2.608, p=0.271). Follow-up one-tailed Mann-Whitney tests showed that the TD and ASD IN groups did not vary significantly on any measure, whereas the ASD OUT group differed significantly from both TD and ASD IN groups on both Frequency Error (U=6.0, p=0.001 and U=5.0, p=0.002, respectively) and Pitch Strength (U=13.0, p=0.008 and U=12.0, p=0.019, respectively).
Table 1.
Means and standard deviations (SD) for individual pitch-tracking measures for TD, ASD IN and ASD OUT groups. Note that the means of the TD and ASD IN group were similar, while the ASD OUT group (as determined by the Composite Score) had pervasive deficits.
| TD (n=21) | ASD IN (n=16) | ASD OUT (n=5) | ||||
|---|---|---|---|---|---|---|
| Mean | SD | Mean | SD | Mean | SD | |
| f0 Frequency Error (Hz) | 8.52 | 2.201 | 9.16 | 2.216 | 14.10 | 1.998 |
| f0 Slope Error (Hz/sec) | 35 | 20.2 | 35 | 23.9 | 120 | 45.6 |
| f0 Pitch Strength (r-value) | 0.40 | 0.198 | 0.32 | 0.154 | 0.23 | 0.169 |
| H2 Frequency Error (Hz) | 13.43 | 2.071 | 14.19 | 1.893 | 17.86 | 1.534 |
| H2 Slope Error (Hz/sec) | 66 | 48.0 | 56 | 28.0 | 64 | 23.0 |
3.3.3.2 Encoding harmonics
Kruskal-Wallis tests indicated a significant group difference in Frequency Error for encoding of H2, but not in Slope Error of H2 (H(2)=11.472, p=0.003 and H(2)=0.397, p=0.820, respectively). Follow-up one-tailed Mann-Whitney tests showed that the TD and ASD IN groups did not differ in harmonics encoding, while the ASD OUT group had lower Frequency Error of H2 compared to both the TD and ASD IN groups (U=5.0, p=0.001 and U=4.0, p=0.001, respectively).
3.4 Relationship to behavior
ASD subjects had significantly lower scores than TD subjects on both mental ability and language testing (p<0.025, all tests), with the exception of performance mental ability (p=0.133), for which the ASD group scored similarly to the TD group (Fig. 1). Mann-Whitney tests between the ASD IN and ASD OUT group revealed no significant differences on the behavioral tests (U=22.5–32.50, p≥0.153, all tests). There were no significant relationships (Pearson’s r≤0.421, p≥0.061, all tests) between pitch tracking in the brainstem and measures of language and mental ability in either diagnostic group or the ASD IN subgroup; it was not possible to evaluate meaningful correlations in the ASD OUT group due to the small group size.
3.5 Pitch tracking test-rest reliability
As children with ASD represent a difficult to test population, we were interested in the stability of these results across multiple test sessions. In a separate study (unpublished data), measures of pitch tracking were evaluated for stability from test to follow-up retest session in six of the original 21 children with ASD (all ASD IN children). With only six children, we chose to conduct a non-parametric paired test (Wilcoxon Signed Ranks test) to be more conservative. Data indicated no significant changes in f0 Frequency Error (Z=−0.314, p=0.753), Slope Error (Z=−0.105, p=0.917) and Pitch Strength (Z=−0.105, p=0.917) or in H2 Frequency Error (Z=−0.105, p=0.917) or Slope Error (Z=−0.677, p=0.498) which indicate the reliability and stability of this response.
4. Discussion
Using speech syllables with variable pitch, we have demonstrated deficient brainstem encoding of pitch in a subgroup of verbal children with ASD. Specifically we found that these children with ASD had aberrant, non-direction-specific pitch tracking (increased frequency and slope error) and reduced neural phase locking to the stimulus (poorer autocorrelations) compared to TD children. These results were detected in children over a restricted age range, with normal peripheral hearing and brainstem conductions times, full scale intelligence scores >80 and without confounding neurological impairment. Because the diagnoses of children in both the ASD IN and ASD OUT groups varied, diagnosis alone was not a distinguishing factor of good or poor pitch tracking. Nevertheless possible effects of diagnoses should be investigated more thoroughly in future work. That only a subset of our population showed abnormalities in the auditory brainstem is consistent with the findings of other investigators (Maziade et al., 2000; Rosenhall et al., 2003) and also consistent with the known heterogeneity within and between diagnostic categories of the autism spectrum (Freitag, 2007). Both the ASD IN and the ASD OUT groups met criteria for ASD, and thus would not be predicted to differ on the behavioral measures that were tested. Neither the WASI nor the CELF specifically target deficits in prosody perception. That they did not differ in language testing but did differ in FFR is, in our view, a reflection of the greater sensitivity of the electrophysiologic testing. Because the brainstem paradigm is passive, quantifiably poor pitch tracking in the FFR may be more conspicuous than in behavioral tests, during which participants may use other cues and tools to compensate for this deficit. Thus, it is possible that better designed behavioral tests of receptive and expressive prosody may correlate with the deficits in the FFR.
Within speech signals, the f0 and its harmonics are important for conveying affect (Patel et al., 1998; Schon et al., 2004). In a typical system, the auditory brainstem robustly extracts and encodes the pitch contour from the speech signal. In brainstem responses of children with ASD, frequency encoding was non-specific, non-periodic and diffuse such that the most robustly encoded frequency did not correspond to the pitch contour of the stimulus. Thus, in many cases, the f0 contour was not registered by the brainstem. This raises the possibility that poor brainstem representation of f0 contour may underlie poor recognition of f0 as a significant acoustic cue. Although some caution is advised due to our small study sample, our data are consistent with the idea that receptive prosody deficits, and by inference, possibly also expressive prosody deficits, stem from an inability to passively encode and transmit variable pitch contours beginning in the auditory brainstem in some patients.
4.1 Brainstem deficits and cortical connections in ASD
4.1.1 Clinical neurophysiology
Several prior studies have examined the integrity of the auditory brainstem in children with ASD and some have reported aberrant brainstem responses to non-speech stimuli (reviewed in Klin, 1993; Rapin and Dunn, 2003). McClelland and colleagues found prolonged brainstem transmission times in response to pulse stimulation in mentally-handicapped individuals with ASD (ages 3–23 years) and attributed the delay to maturational defects in myelination (McClelland et al., 1992). Maziade and colleagues reported increased inter-peak latencies between waves I-III and I-V using click-evoked brainstem responses in 73 children with ASD (ages 2–12 years) who were compliant for the study and had otherwise normal hearing (Maziade et al., 2000). The authors concluded that the slowed conduction time could be attributed to reduced myelination, although they also postulated cerebellar degeneration, hyperserotonemia – or a combination of these abnormalities at the brainstem. Similarly, Rosenhall and colleagues found increased click-evoked brainstem conduction times in just over half of the 153 tested individuals with ASD (ages 4–20 years) although in this study, about 8% of their subjects had hearing loss (Rosenhall et al., 2003). That study included some children with mild or severe mental retardation and it was not reported how many of those cases had abnormal brainstem responses. In contrast to these studies, Tharpe and colleagues did not find sensory encoding deficits at the level of the brainstem in a study of 22 children with ASD (ages 3–10 years) (Tharpe et al., 2006). Although click-evoked brainstem responses were normal, pure tone thresholds were atypical in half of their subjects, suggesting that these children might represent a unique subgroup of children with ASD.
These prior brainstem studies employed a relatively restricted stimulus repertoire (i.e., only clicks or pulses), which only allow for investigation of latency and amplitude variations. Our study evaluated frequency encoding in speech in subjects who demonstrated normal brainstem responses to clicks. As in the present investigation, most of the studies report that only subsets of their children show deficiencies. Thus, any discrepancy between studies could be due either to different mechanisms of auditory pathway dysfunction in various subsets of children with ASD or the different mechanisms of processing clicks versus speech (Hoormann et al., 1992).
4.1.2 The neuro-anatomic basis
4.1.2.1 Brainstem development
Experience-dependent postnatal pruning occurs in multiple subcortical components of the normal auditory system (e.g., lateral superior olivary nucleus, lateral lemniscus, and inferior colliculus) (Sanes and Constantine-Paton, 1985; Gabriele et al., 2000; Sanes and Friaf, 2000; Henkel et al., 2005) such that irregularities in this process may underlie disordered connectivity within the brainstem and between the cortex and brainstem. For example, in the lateral superior olivary nucleus, the postnatal depolarization of inhibitory input allows for elaboration of pre- and post-synaptic connections whereas hyperpolarization leads to elimination of connections and the balance thus promotes refinement of auditory pathways (Sanes and Friaf, 2000). Additionally, abnormal early auditory input affects post-natal pruning in the lateral lemniscus and inferior colliculus which is necessary for spectral and temporal auditory function and frequency tuning (Sanes and Constantine-Paton, 1985; Henkel et al., 2005).
Prior clinical and animal research models have implicated deficits in brainstem maturation and development in ASD. Data from magnetic resonance imaging in individuals with ASD (Hashimoto et al., 1993; Hashimoto et al., 1995), and experiments exploiting genetic defects in an animal model (Rodier et al., 1997; Rodier, 2000), point to atypical embryological development (deficient maturation) and a smaller brainstem. Hashimoto et al. (Hashimoto et al., 1995) and McClelland et al. (McClelland et al., 1992) also suggested maturational myelin-related deficits at the brainstem that may affect either projections to the limbic system or the auditory cortex (reduced long-range connectivity to the cortex), with fewer ascending projections. Together, these studies provide evidence that the brainstem is implicated in ASD and that the brainstem frequency-following response may be used as a marker for one neuropsychological deficit.
4.1.2.2 Neuro-anatomic deficits in brainstem-cortical connections in ASD
Disrupted connections between the brainstem and cortex, as well as deficient sensory encoding of speech within cortex (Ceponiene et al., 2003; Boddaert et al., 2004; Flagg et al., 2005), may account for the auditory processing impairment in individuals with ASD. Anatomical differences in cortical microarchitecture, including decreased long-range connectivity coupled with greater local neuronal proliferation (increased numbers and densely packed neurons), have been linked to autism (Baron-Cohen et al., 2005; Courchesne and Pierce, 2005; Wickelgren, 2005). Because auditory connections are reciprocal, impaired encoding of pitch contour at the brainstem may affect cortical encoding in a feed-forward fashion by propagating to the ascending auditory pathway (Galbraith et al., 2004b). Conversely, because cortical modulation helps shape brainstem encoding and enhances signal processing (Yan and Suga, 1996; Suga et al., 2000; Galbraith et al., 2003; Boylan et al., 2007; Yu et al., 2007), it is plausible that faulty brainstem representation of sound may arise, at least in part, from the lack of optimal top-down, corticofugal engagement of auditory pathway activity. Supporting the theory of disrupted corticofugal function in ASD, Boylan and colleagues (Boylan et al., 2007) discuss converging evidence (using immunochemistry and autoradiography) implicating abnormal cortical innervation, atypical (or absent) pruning and reorganized sensory maps resulting in perceptual processing deficits in their rodent model of autism. In both “bottom up” and “top down” scenarios, inaccurate input from the brainstem could ultimately contribute to defective cortical encoding of speech prosody in the auditory cortex, and limit comprehension of linguistic affect.
4.2 Implications
4.2.1 Brainstem Malleability
Brainstem function for speech and music has been shown to be malleable with short term training (Russo et al., 2005; Song et al., 2007) and sharpened by lifelong auditory experience with language, (Krishnan et al., 2005; Xu et al., 2006) and music (Musacchia et al., 2007; Wong et al., 2007) likely through corticofugal mechanisms. For example, Krishnan and colleagues found that Mandarin speakers had more finely tuned pitch encoding in the brainstem, indicating that brainstem pitch tracking is modulated by language experience (Krishnan et al., 2005; Xu et al., 2006) and musicians have been shown to exhibit enhanced brainstem encoding of both speech and music (Musacchia et al., 2007). Further, although they do not show the same deficits with expressive and receptive prosody, some children with language-based learning problems have brainstem deficiencies encoding acoustic aspects of speech (Wible et al., 2004; Banai et al., 2005; Johnson et al., 2007). Following auditory training, components of the brainstem FFR, of which f0 encoding is a major part, become less “noisy” (fewer non-stimulus related spectral peaks) after auditory training (Russo et al., 2005), a finding that may have direct application to children with ASD.
Because prosody is often considered the “music of language,” music therapy may facilitate pitch learning in language (Schon et al., 2004). Kellerman and colleagues (Kellerman et al., 2005) suggest that the repetitive nature of music is attractive to individuals with ASD and it has also been proposed that the technical aspects of music appeal to individuals with ASD (Levitin, 2006). Some benefits of music therapy have been reported in treating the communication deficit in ASD; case studies have shown that music therapy improved both production and interpretation of others’ intonation (Miller and Toca, 1979; Hoelzley, 1993). In addition, enhanced brainstem encoding of pitch with long-term musical training has been shown for both speech and music (Musacchia et al. 2007; Wong et al., 2007). Extended exposure to music appears to sharpen the auditory encoding of speech containing prosodic pitch contours. The malleability of brainstem encoding and its enhancement with musical training support the view that auditory training aimed at improving pitch tracking, including music training, may provide therapeutic intervention for some children with ASD.
4.2.2 Summary
The brainstem response to speech is a passively-elicited, non-invasive objective index of brainstem encoding of key linguistic cues. Using this response, we have shown that some children with ASD demonstrate marked deficiencies in pitch tracking, offering an attractive candidate mechanism for their deficient receptive prosody. Because the brainstem response matures early, this paradigm could conceivably be utilized to screen for severe deficits in pragmatic language in infants or young children, which may be indicative of early symptoms of ASD.
Several modifications can be anticipated to improve the precision of our approach to the study of the neurophysiology of language impairment in autism. These include the expansion of our study paradigm to include aspects of prosody encoding other than pitch (variations in stress/emphasis), aspects of speech encoding other than prosody (e.g., consonant-vowel syllables with invariant pitch,), standardized behavioral measures of receptive prosody impairment and, finally, more precise tools for clinical classification of subjects (the Autism Diagnostic Observation Schedule (Lord et al., 1989; Lord et al., 2000) and Autism Diagnostic Interview-Revised (Le Couteur et al., 1989; Lord et al., 1994)). Together these modifications are likely to improve our ability to characterize language deficits in children with ASD and further work that incorporates this paradigm may also produce a viable neurophysiologic marker for subtyping these children in conjunction with genetic and behavioral analyses.
Acknowledgements
We would like to thank the children who participated in this study and their families. We would also like to acknowledge Jane Hornickel for her work on the harmonics analyses.
Financial Interests: This research was supported by NIH R01 DC01510. The authors declare that they have no competing financial interests.
Footnotes
Publisher's Disclaimer: This is a PDF file of an unedited manuscript that has been accepted for publication. As a service to our customers we are providing this early version of the manuscript. The manuscript will undergo copyediting, typesetting, and review of the resulting proof before it is published in its final citable form. Please note that during the production process errors may be discovered which could affect the content, and all legal disclaimers that apply to the journal pertain.
References
- Banai K, Nicol T, Zecker SG, Kraus N. Brainstem timing: implications for cortical processing and literacy. J Neurosci. 2005;25:9850–9857. doi: 10.1523/JNEUROSCI.2373-05.2005. [DOI] [PMC free article] [PubMed] [Google Scholar]
- Baron-Cohen S, Knickmeyer RC, Belmonte MK. Sex differences in the brain: implications for explaining autism. Science. 2005;310:819–823. doi: 10.1126/science.1115455. [DOI] [PubMed] [Google Scholar]
- Boddaert N, Chabane N, Gervais H, Good C, Bourgeois M, Plumet M, Barthelemy C, Mouren M, Artiges E, Samson Y, Brunelle F, Frackowiak R, Zilbovicius M. Superior temporal sulcus anatomical abnormalities in childhood autism: a voxel-based morphometry MRI study. Neuroimage. 2004;23:364–369. doi: 10.1016/j.neuroimage.2004.06.016. [DOI] [PubMed] [Google Scholar]
- Boersma P, Weenink D. PRAAT: doing phonetics by computer. 2004 [Google Scholar]
- Boylan CB, Blue ME, Hohmann CF. Modeling early cortical serotonergic deficits in autism. Behav Brain Res. 2007;176:94–108. doi: 10.1016/j.bbr.2006.08.026. [DOI] [PMC free article] [PubMed] [Google Scholar]
- Ceponiene R, Lepisto T, Shestakova A, Vanhala R, Alku P, Naatanen R, Yaguchi K. Speech-sound-selective auditory impairment in children with autism: they can perceive but do not attend. Proc Natl Acad Sci U S A. 2003;100:5567–5572. doi: 10.1073/pnas.0835631100. [DOI] [PMC free article] [PubMed] [Google Scholar]
- Courchesne E, Pierce K. Why the frontal cortex in autism might be talking only to itself: local over-connectivity but long-distance disconnection. Curr Opin Neurobiol. 2005;15:225–230. doi: 10.1016/j.conb.2005.03.001. [DOI] [PubMed] [Google Scholar]
- Flagg EJ, Cardy JE, Roberts W, Roberts TP. Language lateralization development in children with autism: Insights from the late field magnetoencephalogram. Neurosci Lett. 2005;386:82–87. doi: 10.1016/j.neulet.2005.05.037. [DOI] [PubMed] [Google Scholar]
- Freitag CM. The genetics of autistic disorders and its clinical relevance: a review of the literature. Mol Psychiatry. 2007;12:2–22. doi: 10.1038/sj.mp.4001896. [DOI] [PubMed] [Google Scholar]
- Gabriele ML, Brunso-Bechtold JK, Henkel CK. Plasticity in the development of afferent patterns in the inferior colliculus of the rat after unilateral cochlear ablation. J Neurosci. 2000;20:6939–6949. doi: 10.1523/JNEUROSCI.20-18-06939.2000. [DOI] [PMC free article] [PubMed] [Google Scholar]
- Galbraith GC, Amaya EM, de Rivera JM, Donan NM, Duong MT, Hsu JN, Tran K, Tsang LP. Brain stem evoked response to forward and reversed speech in humans. Neuroreport. 2004a;15:2057–2060. doi: 10.1097/00001756-200409150-00012. [DOI] [PubMed] [Google Scholar]
- Galbraith GC, Gutterson RP, Levy DS, Mussey JL, Sabatasso FA, Wasserman RI. Correlated brain stem and cortical evoked responses to auditory tone change. Neuroreport. 2004b;15:2613–2616. doi: 10.1097/00001756-200412030-00010. [DOI] [PubMed] [Google Scholar]
- Galbraith GC, Olfman DM, Huffman TM. Selective attention affects human brain stem frequency-following response. Neuroreport. 2003;14:735–738. doi: 10.1097/00001756-200304150-00015. [DOI] [PubMed] [Google Scholar]
- Gorga MP, Abbas PJ, Worthington DW. Stimulus Calibrations in ABR Measurements. In: Jacobson JT, editor. The Auditory Brainstem Response. San Diego: College-Hill Press; 1985. pp. 49–62. [Google Scholar]
- Hashimoto T, Tayama M, Miyazaki M, Murakawa K, Shimakawa S, Yoneda Y, Kuroda Y. Brainstem involvement in high functioning autistic children. Acta Neurol Scand. 1993;88:123–128. doi: 10.1111/j.1600-0404.1993.tb04203.x. [DOI] [PubMed] [Google Scholar]
- Hashimoto T, Tayama M, Murakawa K, Yoshimoto T, Miyazaki M, Harada M, Kuroda Y. Development of the brainstem and cerebellum in autistic patients. J Autism Dev Disord. 1995;25:1–18. doi: 10.1007/BF02178163. [DOI] [PubMed] [Google Scholar]
- Henkel CK, Gabriele ML, McHaffie JG. Quantitative assessment of developing afferent patterns in the cat inferior colliculus revealed with calbindin immunohistochemistry and tract tracing methods. Neurosci. 2005;136:945–955. doi: 10.1016/j.neuroscience.2005.03.020. [DOI] [PMC free article] [PubMed] [Google Scholar]
- Hobson RP. The autistic child's appraisal of expressions of emotion. J Child Psychol Psychiatry. 1986;27:321–342. doi: 10.1111/j.1469-7610.1986.tb01836.x. [DOI] [PubMed] [Google Scholar]
- Hoelzley PD. Communication potentiating sounds: Developing channels of communication with autistic children through psychobiological responses to novel sound stimuli. Canadian Journal of Music Therapy. 1993;1:54–76. [Google Scholar]
- Hoormann J, Falkenstein M, Hohnsbein J, Blanke L. The human frequency-following response (FFR): normal variability and relation to the click-evoked brainstem response. Hear Res. 1992;59:179–188. doi: 10.1016/0378-5955(92)90114-3. [DOI] [PubMed] [Google Scholar]
- Johnson KL, Nicol TG, Zecker SG, Kraus N. Auditory brainstem correlates of perceptual timing deficits. J Cogn Neursci. 2007;19:376–385. doi: 10.1162/jocn.2007.19.3.376. [DOI] [PubMed] [Google Scholar]
- Kellerman GR, Fan J, Gorman JM. Auditory abnormalities in autism: toward functional distinctions among findings. CNS Spectr. 2005;10:748–756. doi: 10.1017/s1092852900019738. [DOI] [PubMed] [Google Scholar]
- Klin A. Auditory brainstem responses in autism: brainstem dysfunction or peripheral hearing loss? J Autism Dev Disord. 1993;23:15–35. doi: 10.1007/BF01066416. [DOI] [PubMed] [Google Scholar]
- Korpilahti P, Jansson-Verkasalo E, Mattila ML, Kuusikko S, Suominen K, Rytky S, Pauls DL, Moilanen I. Processing of affective speech prosody is impaired in Asperger Syndrome. J Autism Dev Disord. 2006 doi: 10.1007/s10803-006-0271-2. [DOI] [PubMed] [Google Scholar]
- Kraus N, Nicol T. Brainstem origins for cortical 'what' and 'where' pathways in the auditory system. Trends Neurosci. 2005;28:176–181. doi: 10.1016/j.tins.2005.02.003. [DOI] [PubMed] [Google Scholar]
- Krishnan A, Xu Y, Gandour J, Cariani P. Encoding of pitch in the human brainstem is sensitive to language experience. Cogn Brain Res. 2005;25:161–168. doi: 10.1016/j.cogbrainres.2005.05.004. [DOI] [PubMed] [Google Scholar]
- Krishnan A, Xu Y, Gandour JT, Cariani PA. Human frequency-following response: representation of pitch contours in Chinese tones. Hear Res. 2004;189:1–12. doi: 10.1016/S0378-5955(03)00402-7. [DOI] [PubMed] [Google Scholar]
- Kujala T, Lepisto T, Nieminen-von Wendt T, Naatanen P, Naatanen R. Neurophysiological evidence for cortical discrimination impairment of prosody in Asperger syndrome. Neurosci Lett. 2005;383:260–265. doi: 10.1016/j.neulet.2005.04.048. [DOI] [PubMed] [Google Scholar]
- Le Couteur A, Rutter M, Lord C, Rios P, Robertson S, Holdgrafer M, McLennan J. Autism diagnostic interview: a standardized investigator-based instrument. J Autism Dev Disord. 1989;19:363–387. doi: 10.1007/BF02212936. [DOI] [PubMed] [Google Scholar]
- Lepisto T, Kajander M, Vanhala R, Alku P, Huotilainen M, Naatanen R, Kujala T. The perception of invariant speech features in children with autism. Biol Psychol. doi: 10.1016/j.biopsycho.2007.08.010. Available online 31 August 2007. [DOI] [PubMed] [Google Scholar]
- Lepisto T, Kujala T, Vanhala R, Alku P, Huotilainen M, Naatanen R. The discrimination of and orienting to speech and non-speech sounds in children with autism. Brain Res. 2005;1066:147–157. doi: 10.1016/j.brainres.2005.10.052. [DOI] [PubMed] [Google Scholar]
- Lepisto T, Silokallio S, Nieminen-von Wendt T, Alku P, Naatanen R, Kujala T. Auditory perception and attention as reflected by the brain event-related potentials in children with Asperger syndrome. Clin Neurophysiol. 2006;117:2161–2171. doi: 10.1016/j.clinph.2006.06.709. [DOI] [PubMed] [Google Scholar]
- Levitin DJ. The Music Instinct. This is your brain on music: The science of human obsession. New York: Dutton; 2006. The Music Instinct; pp. 240–261. [Google Scholar]
- Lord C, Risi S, Lambrecht L, Cook EH, Jr, Leventhal BL, DiLavore PC, Pickles A, Rutter M. The autism diagnostic observation schedule-generic: a standard measure of social and communication deficits associated with the spectrum of autism. J Autism Dev Disord. 2000;30:205–223. [PubMed] [Google Scholar]
- Lord C, Rutter M, Goode S, Heemsbergen J, Jordan H, Mawhood L, Schopler E. Autism diagnostic observation schedule: a standardized observation of communicative and social behavior. J Autism Dev Disord. 1989;19:185–212. doi: 10.1007/BF02211841. [DOI] [PubMed] [Google Scholar]
- Lord C, Rutter M, Le Couteur A. Autism Diagnostic Interview-Revised: a revised version of a diagnostic interview for caregivers of individuals with possible pervasive developmental disorders. J Autism Dev Disord. 1994;24:659–685. doi: 10.1007/BF02172145. [DOI] [PubMed] [Google Scholar]
- Maziade M, Merette C, Cayer M, Roy MA, Szatmari P, Cote R, Thivierge J. Prolongation of brainstem auditory-evoked responses in autistic probands and their unaffected relatives. Arch Gen Psychiatry. 2000;57:1077–1083. doi: 10.1001/archpsyc.57.11.1077. [DOI] [PubMed] [Google Scholar]
- McCann J, Peppe S. Prosody in autism spectrum disorders: a critical review. Int J Lang Commun Disord. 2003;38:325–350. doi: 10.1080/1368282031000154204. [DOI] [PubMed] [Google Scholar]
- McClelland RJ, Eyre DG, Watson D, Calvert GJ, Sherrard E. Central conduction time in childhood autism. Br J Psychiatry. 1992;160:659–663. doi: 10.1192/bjp.160.5.659. [DOI] [PubMed] [Google Scholar]
- Miller SB, Toca JM. Adapted melodic intonation on therapy: A case study of an experimental language program for an autistic child. J Clin Psychol. 1979;40:201–203. [PubMed] [Google Scholar]
- Musacchia G, Sams M, Skoe E, Kraus N. Musicians have enhanced subcortical auditory and audiovisual processing of speech and music. Proc Natl Acad Sci U S A. 2007;104:15894–15898. doi: 10.1073/pnas.0701498104. [DOI] [PMC free article] [PubMed] [Google Scholar]
- Patel AD, Peretz I, Tramo M, Labreque R. Processing prosodic and musical patterns: a neuropsychological investigation. Brain Lang. 1998;61:123–144. doi: 10.1006/brln.1997.1862. [DOI] [PubMed] [Google Scholar]
- Paul R, Augustyn A, Klin A, Volkmar FR. Perception and production of prosody by speakers with autism spectrum disorders. J Autism Dev Disord. 2005;35:205–220. doi: 10.1007/s10803-004-1999-1. [DOI] [PubMed] [Google Scholar]
- Rapin I, Dunn M. Update on the language disorders of individuals on the autistic spectrum. Brain Dev. 2003;25:166–172. doi: 10.1016/s0387-7604(02)00191-2. [DOI] [PubMed] [Google Scholar]
- Rodier PM. The early origins of autism. Sci Am. 2000;282:56–63. doi: 10.1038/scientificamerican0200-56. [DOI] [PubMed] [Google Scholar]
- Rodier PM, Ingram JL, Tisdale B, Croog VJ. Linking etiologies in humans and animal models: studies of autism. Reprod Toxicol. 1997;11:417–422. doi: 10.1016/s0890-6238(97)80001-u. [DOI] [PubMed] [Google Scholar]
- Rosenhall U, Nordin V, Brantberg K, Gillberg C. Autism and auditory brain stem responses. Ear Hear. 2003;24:206–214. doi: 10.1097/01.AUD.0000069326.11466.7E. [DOI] [PubMed] [Google Scholar]
- Russo NM, Nicol TG, Zecker SG, Hayes EA, Kraus N. Auditory training improves neural timing in the human brainstem. Behav Brain Res. 2005;156:95–103. doi: 10.1016/j.bbr.2004.05.012. [DOI] [PubMed] [Google Scholar]
- Sanes DH, Constantine-Paton M. The sharpening of frequency tuning curves requires patterned activity during development in the mouse, Mus musculus. J Neurosci. 1985;5:1152–1166. doi: 10.1523/JNEUROSCI.05-05-01152.1985. [DOI] [PMC free article] [PubMed] [Google Scholar]
- Sanes DH, Friaf E. Development and influence of inhibition in the lateral superior olivary nucleus. Hear Res. 2000;147:46–58. doi: 10.1016/s0378-5955(00)00119-2. [DOI] [PubMed] [Google Scholar]
- Schon D, Magne C, Besson M. The music of speech: music training facilitates pitch processing in both music and language. Psychophysiology. 2004;41:341–349. doi: 10.1111/1469-8986.00172.x. [DOI] [PubMed] [Google Scholar]
- Semel E, Wiig EH, Secord WA. Clinical evaluation of language fundamentals. 4th ed. San Antonio, TX: Harcourt Assessment Inc.; 2003. [Google Scholar]
- Shriberg LD, Paul R, McSweeny JL, Klin AM, Cohen DJ, Volkmar FR. Speech and prosody characteristics of adolescents and adults with high-functioning autism and Asperger syndrome. J Speech Lang Hear Res. 2001;44:1097–1115. doi: 10.1044/1092-4388(2001/087). [DOI] [PubMed] [Google Scholar]
- Song J, Skoe E, Wong PCM, Kraus N. Plasticity in the adult human auditory brainstem following short-term linguistic training; Human Brain Mapping Conference; Chicago, IL. 2007. [DOI] [PMC free article] [PubMed] [Google Scholar]
- Song JH, Banai K, Russo NM, Kraus N. On the relationship between speech- and nonspeech-evoked auditory brainstem responses. Audiol Neurootol. 2006;11:233–241. doi: 10.1159/000093058. [DOI] [PubMed] [Google Scholar]
- Suga N, Gao E, Zhang Y, Ma X, Olsen JF. The corticofugal system for hearing: recent progress. Proc Natl Acad Sci U S A. 2000;97:11807–11814. doi: 10.1073/pnas.97.22.11807. [DOI] [PMC free article] [PubMed] [Google Scholar]
- Tabachnick B, Fidell L. Multivariate analysis of variance and covariance. In: Hartman S, editor. Using multivariate statistics. Boston: Allyn & Bacon; 2007. pp. 243–310. [Google Scholar]
- Tharpe AM, Bess FH, Sladen DP, Schissel H, Couch S, Schery T. Auditory characteristics of children with autism. Ear Hear. 2006;27:430–441. doi: 10.1097/01.aud.0000224981.60575.d8. [DOI] [PubMed] [Google Scholar]
- Wible B, Nicol T, Kraus N. Atypical brainstem representation of onset and formant structure of speech sounds in children with language-based learning problems. Biol Psychol. 2004;37:299–317. doi: 10.1016/j.biopsycho.2004.02.002. [DOI] [PubMed] [Google Scholar]
- Wickelgren I. Neurology. Autistic brains out of synch? Science. 2005;308:1856–1858. doi: 10.1126/science.308.5730.1856. [DOI] [PubMed] [Google Scholar]
- Woerner C, Overstreet K. Wechsler abbreviated scale of intelligence (WASI) San Antonio, TX: The Psychological Corporation; 1999. [Google Scholar]
- Wong P, Skoe E, Russo N, Dees T, Kraus N. Musical experience shapes human brainstem encoding of linguistic pitch patterns. Nat Neurosci. 2007;10:420. doi: 10.1038/nn1872. [DOI] [PMC free article] [PubMed] [Google Scholar]
- Xu Y, Krishnan A, Gandour J. Specificity of experience-dependent pitch representation in the brainstem. Neuroreport. 2006;17:1601–1605. doi: 10.1097/01.wnr.0000236865.31705.3a. [DOI] [PubMed] [Google Scholar]
- Yan W, Suga N. Corticofugal modulation of time-domain processing of biosonar information in bats. Science. 1996;273:1100–1103. doi: 10.1126/science.273.5278.1100. [DOI] [PubMed] [Google Scholar]
- Yu X, Sanes DH, Aristizabal O, Wadghiri YZ, Turnbull DH. Large-scale reorganization of the tonotopic map in mouse auditory midbrain revealed by MRI. Proc Natl Acad Sci U S A. 2007;104:12193–12198. doi: 10.1073/pnas.0700960104. [DOI] [PMC free article] [PubMed] [Google Scholar]