Abstract
To gain insight into the pathogenesis of hepatic fibrosis related to insulin resistance, we have examined the effects of euglycemic hyperinsulinemia on three matrix metalloproteinases (MMP-2, MMP-9, and MT1-MMP) and on two major tissue inhibitors of MMPs (TIMP-1 and TIMP-2) in liver of insulin-sensitive and insulin-resistant rats. Four hours of insulin infusion (4.8 mU·kg−1·min−1) without or with lipid-heparin infusion (to produce insulin resistance) decreased hepatic MMP-2 mRNA (by RT-PCR), pro-MMP-2, MMP-2, MMP-9, and MT1-MMP (all by Western blots) and the gelatinolytic activity of MMP-2 (by gelatin zymography) by ∼60–80%. Hyperinsulinemia (∼1.6 mmol/l) increased TIMP-1 and TIMP-2 concentrations (by ELISA) in insulin-sensitive and insulin-resistant rats. Phosphoinositide 3-kinase was activated by insulin in insulin-sensitive rats and inhibited in insulin-resistant rats. Extracellular signal-regulated kinases 1/2 (ERK1/2) were activated by insulin in insulin-sensitive rats and partially inhibited in insulin-resistant rats; c-jun NH2-terminal kinase-1 (JNK1), JNK2/3, or p38 MAPK were only activated by lipid but not by insulin. We conclude that hyperinsulinemia, whether or not associated with insulin resistance, shifts the MMP/TIMP balance toward reduction of extracellular matrix degradation and thus may promote the development of hepatic fibrosis.
Keywords: insulin resistance, lipid infusion, fibrosis, phosphoinositide 3-kinase, extracellular signal-regulated kinases 1/2, matrix metalloproteinases, tissue inhibitors of matrix metalloproteinases
matrix metalloproteinases (MMPs) belong to a family of enzymes with proteolytic activity against extracellular (EC) matrix proteins, including collagens, proteoglycans and elastin (24). The activity of these enzymes is tightly controlled by tissue inhibitors of MMPs (TIMPs) (24). EC matrix constantly undergoes synthesis and degradation. Changes in the MMP/TIMP activity ratio, therefore, may lead to changes in EC matrix and may have health consequences. In fact, there is evidence that changes in MMP activities play key roles in the development of unstable coronary artery disease (10) and are involved in the development of vascular aneurysms (17) and hepatic fibrosis (11, 14). Insulin resistance is frequently associated with these disorders (19), and hyperinsulinemia, a predictable consequence of insulin resistance, is also a likely effector of some of its adverse consequences. This led us to hypothesize that hyperinsulinemia may promote hepatic fibrosis by changing the MMP/TIMP balance. To test this hypothesis, we have investigated effects of elevated plasma insulin levels on three MMPs (MMP-2, MMP-9, MT1-MMP) and on their two major tissue inhibitors (TIMP-1 and TIMP-2) in livers of insulin-sensitive rats and rats made insulin resistant with intravenous infusion of lipid plus heparin.
RESEARCH DESIGN AND METHODS
We studied adult male Sprague-Dawley rats (300–350 g), purchased from Charles River Laboratories (Wilmington, MA). The preoperative treatment and the surgical placement of polyurethane catheters, into the right atrium via the right internal jugular vein and into the aortic arch via the left carotid artery, has been described (4). All studies were performed in accordance with the guidelines for the use and care of laboratory animals of the Temple University Institutional Animal Care and Use Committee.
The rats were allowed 1 wk to recover from the effects of surgery. At that time, they were within 3% of their preoperative weight. Euglycemic hyperinsulinemic clamps were conducted in the morning after a 14-h overnight fast. Throughout the studies, the animals were allowed to move freely in their cages. All infusates were administered into the venous catheter, and blood samples were obtained from the arterial catheter. After the clamps, the rats were killed by an overdose of isoflurane, and the liver was freeze-clamped, excised, and frozen at −80°C until assayed. The following studies were performed.
Euglycemic hyperinsulinemic clamps.
These clamps were performed with awake and unrestrained rats as described (4). Insulin (4.8 mU·kg−1·min−1) was infused through the jugular vein catheter from 0 to 240 min. Glucose concentrations were clamped at euglycemic levels by a variable-rate infusion of 25% glucose. Glycerol (143 μmol/h) was infused to match the glycerol content of Liposyn II (see below). Blood glucose levels were monitored with an Elite Glucometer (Bayer, Elkhart, IN), and glucose infusion rates (GIRs) were adjusted every 5–10 min as needed.
Euglycemic hyperinsulinemic clamps with lipid-heparin infusion.
To produce acute insulin resistance, Liposyn II, a 20% triglyceride emulsion (Abbott Laboratories, Chicago, IL) was infused at 0.618 ml/h with heparin (20 U/h). Insulin was infused at 4.8 mU·kg−1·min−1, and glucose was clamped at ∼5.5 mmol/l.
In control experiments, saline-glycerol was infused without insulin, and glucose was maintained at 5.5 mmol/l. Somatostatin was not infused in any of the studies.
During all studies, blood samples (∼200 μl) were obtained from the carotid artery at −30, 0, 60, 120, 180, 210, and 240 min. Blood was centrifuged immediately, and the red cells were reinfused into the animals.
Analytic procedures.
Insulin was measured in plasma by radioimmunoassay using rat insulin as standard (Millipore, St. Charles, MO).
Rat TIMP-1 was determined with an ELISA kit (from R&D Systems, Minneapolis, MN) and rat TIMP-2 with an ELISA kit (from EMD Biosciences, Gibbstown, NJ) following instructions provided by the manufacturers. Absorbance at 450 nm was measured with a microplate reader (Labsystems, Franklin, MA).
Immunoprecipitation.
Rabbit anti-IRS-1 or anti-IRS-2 sera (from Upstate, Lake Placid, NY) and protein A-agarose beads were used to immunoprecipitate IRS-1- or IRS-2-associated PI3K from liver extracts (100 μg).
Western blots.
Liver tissues were extracted and protein content was measured using the Bio-Rad protein assay (Bio-Rad, Richmond, CA). Sample preparation and performance of Western blots were as described (4). The primary antibodies used were as follows: mouse antibodies from EMD Biosciences against the 72-kDa latent (pro) and the 66-kDa active forms of MMP-2; the 68-kDa active form of MMP-9 and the 60-kDa active form of MT1-MMP; a rabbit antiserum (Upstate) that recognizes the N-SH2 region of PI3K and the regulatory p85 subunit of PI3K; a rabbit antiserum that recognizes rat IRS-1 and another rabbit antiserum that recognizes rat IRS-2 (both from Upstate); a rabbit antibody from Cell Signaling (Danvers, MA) that recognizes the active, dually phosphorylated (at Thr202 and Tyr204) forms of ERK1/2 (44 and 42 kDa, respectively) and a rabbit antiserum that detects unphosphorylated ERK1/2; a rabbit antibody (from Cell Signaling) that detects the human and rat phosphorylated (at Thr180 and Tyr182) forms of p38α, -β, and -γ MAPK (43 kDa); and a rabbit antiserum that recognizes total unphosphorylated p38 MAPK and a rabbit antibody (from Cell Signaling) that detects endogenous levels of p46 (JNK1) and p54 (JNK2 and -3) dually phosphorylated at Thr183 and Tyr185 and a rabbit antiserum that detects total unphosphorylated JNK protein. Membranes were washed in TBS containing 0.1% Tween 20 and incubated with secondary antibodies for 1 h. Bands were visualized with an enhanced chemiluminescence detection kit from Amersham Life Sciences (Arlington Height, IL).
Gelatin zymography.
MMP-2 activities were measured by gelatin zymography. Liver tissue extracts were loaded onto SDS-PAGE gels containing 1 mg/ml gelatin under nonreducing conditions and were run at 100 V for 45 min together with molecular weight standards (Bio-Rad, Hercules, CA). Gels were then washed twice in 2.5% Triton X-100 and incubated overnight in zymogram development buffer (Bio-Rad). Gels were then stained with Coomassie blue R-250 followed by destaining with 55% methanol and 7% acetic acid.
Total RNA isolation and real-time RT-PCR.
Total RNAs were isolated from frozen rat liver tissues by use of an RNeasy kit (Qiagen, Valencia, CA). Real-time RT-PCR was performed with a SYBR Green One-Step qRT-PCR kit (Invitrogen, Carlsbad, CA) and a LightCycler (Roche, Indianapolis, IN). Cycling conditions for MMP-2 and 18S rRNA were adapted from Peinnequin et al. (18). Primer sequences from MMP-2 were sense GCTGTGTTCTTCGCAGGGA and antisense AGGTTATCAGGGATGGCA. Standard curves of cycle threshold vs. concentration were obtained using serial dilutions of a control rat liver total RNA.
Statistical analysis.
Statistical differences between preinfusion controls (pre-) and post-saline or post-insulin results were determined with an unpaired t-test and, if not normally distributed, with the Mann-Whitney rank sum test. Between-group comparisons were made with a one-way ANOVA and, if not normally distributed, with the Kruskal-Wallis ANOVA on ranks. Post hoc testing was done with the Student-Newman-Keuls test. Statistical significance was defined as P < 0.05. All results are presented as means ± SE.
RESULTS
Hyperinsulinemic clamps without and with lipid infusions.
Plasma glucose concentrations were clamped at 5.4 ± 0.1 mmol/l in all studies (saline, insulin, and insulin plus lipid infusions).
Serum insulin rose from ∼160 before to ∼1,600 pmol/l during the hyperinsulinemic clamps and did not change during the saline infusions (168 ± 92 vs. 237 ± 35 pmol/l, NS).
Plasma FFA decreased from ∼700 to ∼200 μmol/l (P < 0.001) during insulin, rose from ∼700 to ∼2,000 μmol/l (P < 0.001) during insulin plus lipid, and did not change during the saline infusions.
GIR (the rate of glucose infusion needed to maintain euglycemia during insulin infusions), which is a measure of insulin-stimulated glucose uptake, rose from 0 to ∼200 μmol·kg−1·min−1, during insulin infusion. Insulin plus lipid infusion reduced GIR by ∼35% (from 220 ± 11 to 144 ± 10 μmol·kg−1·min−1, P < 0.001), indicating development of insulin resistance. GIR did not change during saline infusions.
Effect of hyperinsulinemia on MMP-2.
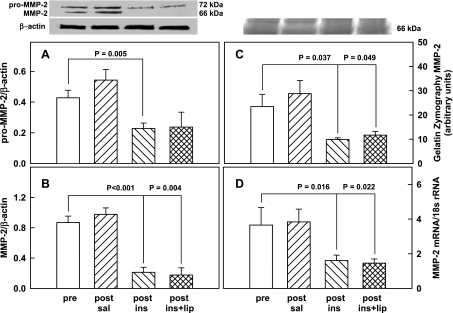
The 72-kDa rat liver pro MMP-2/β-actin ratio did not change in response to saline (0.43 ± 0.05 vs. 0.54 ± 0.07, NS) but decreased similarly in response to insulin (from 0.43 ± 0.05 to 0.23 ± 0.04) and to insulin plus lipid infusions (from 0.43 ± 0.05 to 0.24 ± 0.10) (Fig. 1A).
Fig. 1.
Protein abundance (by Western blot) of pro-MMP-2/β-actin ratios (A, n = 8) and MMP-2/β-actin ratios (B, n = 8) in livers of male Sprague-Dawley rats and representative Western blots of pro-MMP-2, MMP-2, and β-actin before (pre-) and after 4 h of saline infusion (post-saline), or euglycemic hyperinsulinemic clamping without (post-ins) or with lipid-heparin (post-ins+lip). MMP, matrix metalloproeinase. Shown are means ± SE. C: a representative gelatin zymogram and the mean ± SE of 4 zymograms of MMP-2 in rat liver pre- and 4 h post-saline or euglycemic hyperinsulinemic clamping without and with lipid-heparin. D: mean ± SE of 18S rRNA-normalized MMP-2 mRNA measurements in rat liver (n = 4).
Similarly, the 66-kDa active MMP-2/β-actin ratio did not change after saline infusion (0.87 ± 0.09 vs. 0.98 ± 0.09, NS) but declined in response to insulin and to insulin plus lipid (from 0.87 ± 0.09 to 0.21 ± 0.07 and to 0.18 ± 0.1, respectively) (Fig. 1B).
Also, there was no change in gelatinolytic activity of MMP-2 in response to saline (23.5 ± 5.1 vs. 28.8 ± 5.4 arbitrary units, NS) but significant declines occurred in response to insulin and to insulin plus lipid (from 23.5 to 9.9 ± 0.7 and to 11.7 ± 1.5 arbitrary units, respectively) (Fig. 1C).
The MMP-2 mRNA/18s rRNA ratio remained unchanged after saline (3.7 ± 1.0 vs. 3.8 ± 0.7, NS) but decreased significantly during insulin and insulin plus lipid (from 3.7 ± 1.0 to 1.6 ± 0.3 and to 1.5 ± 0.2, respectively) (Fig. 1D).
Effect of hyperinsulinemia on MMP-9 and MT1-MMP.
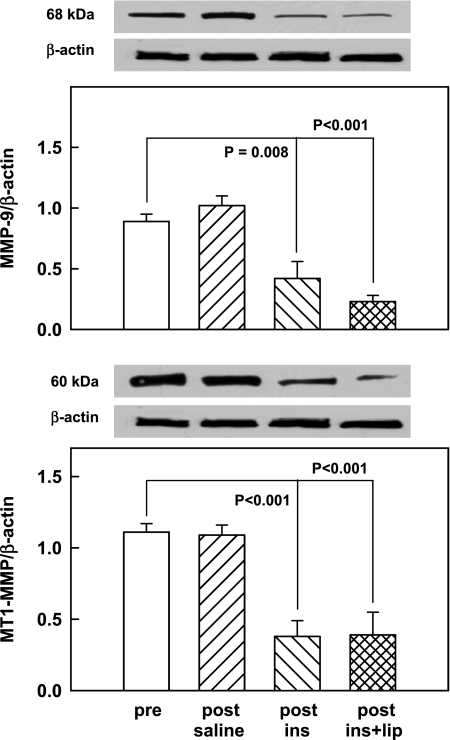
Saline-glycerol infusions had no effect on either the MMP-9/β-actin ratio (0.89 ± 0.06 vs. 1.02 ± 0.08, NS) nor on the MT1-MMP/β-actin ratio (1.1 ± 0.06 vs. 1.09 ± 0.07, NS), but both ratios decreased significantly in response to insulin infusions (from 0.89 ± 0.06 to 0.42 ± 0.14 and from 1.1 ± 0.06 to 0.38 ± 0.11, respectively) and to a similar extent during insulin plus lipid infusions (to 0.23 ± 0.05 and 0.39 ± 0.16, respectively) (Fig. 2).
Fig. 2.
Protein abundance (by Western blots) of MMP-9/β-actin ratios (top, n = 8) and MT1-MMP/β-actin ratios (bottom, n = 8) in male rat livers pre- and 4 h post-saline or euglycemic hyperinsulinemic clamping without (post-ins) and with lipid-heparin (post-ins+lip). Shown are means ± SE. Also shown is a representative Western blot of the 68-kDa MMP-9 and the 60-kDa MT1-MMP and β-actin.
Effect of hyperinsulinemia on TIMP-1/2.
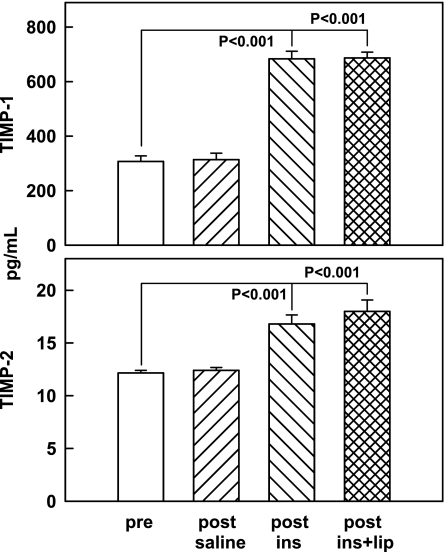
Neither TIMP-1 nor TIMP-2 concentrations changed in response to saline, but both increased in response to insulin infusions (from 307 ± 20 to 683 ± 28 pg/ml and from 12.2 ± 0.3 to 16.8 ± 0.9 pg/ml, respectively) and to insulin plus lipid (to 687 ± 22 and 18.0 ± 1.1 pg/ml, respectively) (Fig. 3).
Fig. 3.
Tissue inhibitors of MMPs (TIMP-1 and TIMP-2; both by ELISA) in rat liver pre- and 4 h post-saline or euglycemic hyperinsulinemic clamping without (post-ins) or with lipid-heparin (post-ins+lip). Shown are means ± SE; n = 6.
Effect of hyperinsulinemia on insulin signaling.
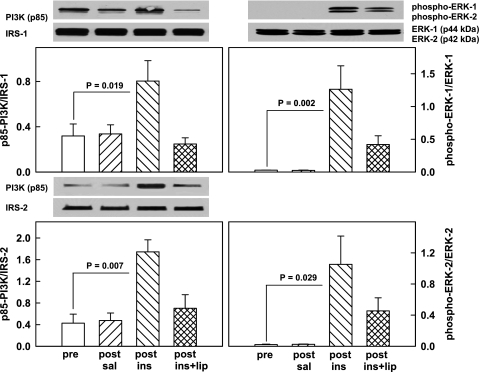
To assess signaling pathways possibly involved in the observed insulin- and insulin-plus-lipid-induced changes in MMPs and TIMPs, we examined their effects on key components of the IRS/PI3K/Akt cascade and four MAPK pathways. As seen in Fig. 4, the IRS-1 and IRS-2 association with the p85 regulatory unit of PI3K increased 2.5- and 3.0-fold, respectively, and ERK1 and ERK2 phosphorylation (indicating activation of the enzymes) increased 45- and 48-fold, respectively, during insulin infusions but remained unchanged in response to saline infusions. Infusing lipid together with insulin completely abolished the rise in IRS-1- and IRS-2-associated PI3K but only partially abolished the insulin-induced increase in ERK1 (from 1.26 ± 0.36 to 0.42 ± 0.13) and in ERK2 (from 1.05 ± 0.36 to 0.45 ± 0.17).
Fig. 4.
Left: representative Western blots of the IRS-associated p85 kDa regulatory subunit of phosphoinositide 3-kinase (PI3K; determined after immunoprecipitation with IRS-1 or IRS-2 antibodies). Bar graphs show means ± SE of IRS-1- or IRS-2-associated PI3K (p85; n = 6) pre- and 4 h post-saline or euglycemic hyperinsulinemic clamping without (post-ins) and with lipid-heparin (post-ins+lip). Right: representative Western blots of phospho-ERK1 and phospho-ERK2 and unphosphorylated ERK1 (p44) and ERK2 (p42). Bar graphs show means ± SE (n = 4) of phospho-ERK1/ERK1 ratios (top) and phospho-ERK2/ERK2 (bottom).
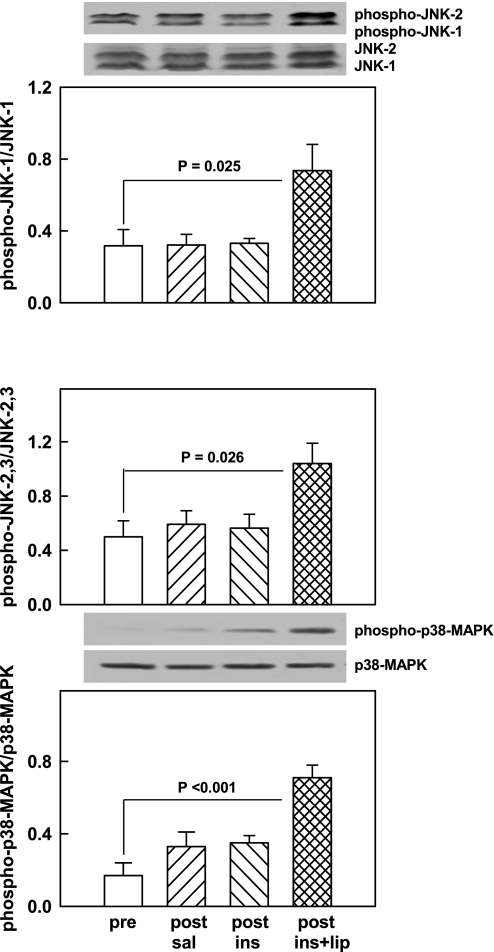
Neither saline nor insulin infusions affected the phospho-JNK1/JNK1 ratio (0.32 vs. 0.32), the phospho-JNK2/3-to-JNK2/3 ratio (0.50 vs. 0.56, NS), or the phospho-p38 MAPK/p38 MAPK ratio (0.17 vs. 0.35, NS). However, insulin plus lipid activated JNK1 (from 0.32 ± 0.09 to 0.74 ± 0.15), JNK2/3 (from 0.50 ± 0.12 to 1.04 ± 0.15), and p38 MAPK (from 0.17 ± 0.07 to 0.71 ± 0.07) (Fig. 5).
Fig. 5.
Representative Western blots of phospho-JNK1/2 and total JNK1/2 and phospho-p38 MAPK and total MAPK. Bar graphs show means ± SE of phospho-JNK1/total JNK1 (top), phospho-JNK2/3/total JNK2/3 (middle) and phospho-p38 MAPK/total p38 MAPK (all n = 6) pre- and 4 h post-saline or euglycemic hyperinsulinemic clamping without (post-ins) and with lipid-heparin (post-ins+lip).
DISCUSSION
The goal of this study was to examine in vivo the effects of hyperinsulinemia on MMPs and their major inhibitors (TIMPs) in the livers of insulin-sensitive and insulin-resistant rats. Insulin resistance (systemic and hepatic) was produced by insulin plus lipid-heparin infusion, a model which has been extensively validated in humans and rats (3, 4, 26). Hyperinsulinemia was studied because it is a predictable consequence of insulin resistance and a likely effector of some of its adverse consequences. MMPs and TIMPs, were studied because their balance determines EC matrix degradation.
A main finding was that as little as 4 h of in vivo hyperinsulinemia decreased the bioactive (phosphorylated) isoforms of MMP-2, MMP-9, and MT1-MMP by between 60 and 80% in both insulin-sensitive and -resistant rats. Moreover, the insulin-induced inhibition of the gelatinolytic activity of MMP-2 was directly demonstrated by gelatin zymography.
All MMPs are secreted as latent (pro) enzymes and are activated by proteolytic cleavage of their propeptide domains (24). MMP gene expression is regulated mainly at the transcriptional level, but recently, posttranscriptional mechanisms have also been recognized (25). The finding that hyperinsulinemia inhibited the formation of MMP-2 mRNA as well as pro-MMP-2 protein abundance suggested that insulin had reduced MMP-2 mRNA transcription and/or stability.
Another finding was that hyperinsulinemia increased TIMP-1 and TIMP-2 in insulin-sensitive and insulin-resistant rats (Fig. 3). Thus, sharply decreased MMP activities, together with an increase of their specific inhibitors, pointed to a strong shift of the MMP/TIMP balance toward inhibition of EC matrix degradation. This was likely to increase EC matrix formation.
We are not aware of previous reports on in vivo effects of hyperinsulinemia on MMPs or TIMPs in liver tissue. Dandona et al. (8) have reported that 4 h of a small increase in plasma insulin (from 78 to 144 pmol/l) lowered plasma MMP-9 by 18% in obese ND individuals. In contrast, several studies have shown insulin-mediated increases in MMPs. For instance, we (4) have recently reported that hyperinsulinemia in vivo increased MMP-2, MMP-9, and MT1-MMP activities in rat aortic tissue without affecting TIMP-1 and TIMP-2, and several studies have shown that hyperinsulinemia in vitro increased MMP-9 and/or MMP-2 activities in human monocytes (9) in cultured rat glomerular mesangial cells (16), and MT1-MMP in human trophoblasts (12). Presently available evidence, therefore, suggests that insulin affects MMPs differently in different organs. The molecular basis for these organ-specific actions of insulin on MMPs and TIMPs remains to be elucidated.
The finding in insulin-resistant rats of inhibition of insulin-stimulated glucose uptake (ISGU) but intact insulin actions on MMPs and TIMPs is an example of “selective insulin resistance” (7, 15). To investigate mechanisms through which this may have occurred, we examined key terminal targets of several insulin-signaling cascades. Previous reports have implicated insulin signaling through the IRS/PI3K cascade as being responsible for stimulation of MMP activity (16, 20). In the liver, this pathway controls primarily the metabolic actions of insulin such as fatty acid synthesis, glycogen formation, and protein synthesis (21). Other reports have implicated MAPK pathways in the insulin stimulation of MMPs (6, 12, 20). MAPKs transmit effects of extracellular stimuli (growth factors including insulin, stress, and bacteria) from the cell membrane to the nucleus and mainly control cell growth and proliferation, inflammation, and apoptosis (22). The observed inhibition of IRS/PI3K in the insulin-resistant rats can explain their impaired ISGU. It should be noted, however, that the inhibition of IRS/PI3K was complete, whereas ISGU was inhibited by only ∼35%. This suggests that IRS/PI3K signaling was not solely responsible for ISGU, supporting a recent report (13).
In insulin-sensitive rats, insulin activated IRS and ERK but not JNK or p38 MAPK. In insulin-resistant rats, insulin activated JNK and p38 MAPK and to some extent ERK, but not IRS. Thus, whereas insulin suppressed MMPs and stimulated TIMPs similarly in insulin-sensitive and -resistant rats, the signaling may have been different. Further studies using transgenic animals and/or specific inhibitors will be needed to explore this issue.
Clinical Relevance
In this study, we have shown that hyperinsulinemia, in the presence or absence of insulin resistance, resulted in a marked decrease in the activities of three hepatic MMPs, MMP-2, MMP-9, and MT1-MMP, that have been implicated in hepatic fibrosis (11) and at the same time increased the tissue concentration of their major inhibitors, TIMP-1 and TIMP-2. In the insulin-resistant rats, insulin signaling through IRS/PI3K was completely inhibited, but signaling through several MAPK pathways remained either partially or fully intact (selective insulin resistance) (7, 15) and thus could have driven the fully maintained insulin actions on MMPs and TIMPs. Assuming that our results obtained with this rat model are applicable to humans, we believe that the hyperinsulinemia-induced shift of the MMP/TIMP balance toward a decrease in the degradation of EC matrix could promote the development of hepatic fibrosis, a condition that is known to be increased in obese insulin-resistant and hyperinsulinemic patients with type 2 diabetes (1).
GRANTS
This work was supported by National Institutes of Health Grants HL-0733267 and R01-DK-066003 and a grant from the Groff Foundation (all to G. Boden).
Acknowledgments
We thank Constance Harris Crews for typing the manuscript.
The costs of publication of this article were defrayed in part by the payment of page charges. The article must therefore be hereby marked “advertisement” in accordance with 18 U.S.C. Section 1734 solely to indicate this fact.
REFERENCES
- 1.Angulo P Nonalcoholic fatty liver disease. N Engl J Med 346: 1221–1231, 2002. [DOI] [PubMed] [Google Scholar]
- 2.Bamba V, Rader DJ. Obesity and atherogenic dyslipidemia. Gastroenterology 132: 2181–2190, 2007. [DOI] [PubMed] [Google Scholar]
- 3.Boden G, She P, Mozzoli M, Cheung P, Gumireddy K, Reddy P, Xiang X, Luo Z, Ruderman N. Free fatty acids produce insulin resistance and activate the proinflammatory nuclear factor-κB pathway in rat liver. Diabetes 54: 3458–3465, 2005. [DOI] [PubMed] [Google Scholar]
- 4.Boden G, Song W, Pashko L, Kresge K. In vivo effects of insulin and free fatty acids on matrix metalloproteinases in rat aorta. Diabetes 57: 476–483, 2008. [DOI] [PubMed] [Google Scholar]
- 5.Brew K, Dinakarpandian D, Nagase H. Tissue inhibitors of metalloproteinases: evolution, structure and function. Biochim Biophys Acta 1477: 267–283, 2000. [DOI] [PubMed] [Google Scholar]
- 6.Cho A, Graves J, Reidy MA. Mitogen-activated protein kinases mediate matrix metalloproteinases-9 expression in vascular smooth muscle cells. Arterioscler Thromb Vasc Biol 20: 2527–2532, 2000. [DOI] [PubMed] [Google Scholar]
- 7.Cusi K, Maezono K, Osman A, Pendergrass M, Patti ME, Pratipanawatr T, DeFronzo RA, Kahn CR, Mandarino LJ. Insulin resistance differentially affects the PI 3-kinase and MAP kinase-mediated signaling in human muscle. J Clin Invest 105: 11–20, 2000. [DOI] [PMC free article] [PubMed] [Google Scholar]
- 8.Dandona P, Aljada A, Mohanty P, Ghanim H, Bandyopadhyay A, Chaudhuri A. Insulin suppresses plasma concentration of vascular endothelial growth factor and matrix metalloproteinase-9. Diabetes Care 26: 3310–3314, 2003. [DOI] [PubMed] [Google Scholar]
- 9.Fischoeder A, Meyborg H, Stibenz D, Fleck E, Graf K, Stawowy P. Insulin augments matrix metalloproteinase-9 expression in monocytes. Cardiovasc Res 73: 841–848, 2007. [DOI] [PubMed] [Google Scholar]
- 10.Galis ZA, Sukhova GK, Lark MW, Libby P. Increased expression of matrix metalloproteinases and matrix degrading activity in vulnerable regions of human atherosclerotic plaques. J Clin Invest 94: 2493–2503, 1994. [DOI] [PMC free article] [PubMed] [Google Scholar]
- 11.Hemmann S, Graf J, Roderfeld M, Roeb E. Expression of MMPs and TIMPs in liver fibrosis—a systematic review with special emphasis on anti-fibrotic strategies. J Hepatol 46: 955–975, 2007. [DOI] [PubMed] [Google Scholar]
- 12.Hiden U, Glitzner E, Ivanisevic M, Djelmis J, Wadsack C, Lang U, Desoye G. MT1-MMP expression in first-trimester placental tissue is upregulated in type 2 diabetes as a result of elevated insulin and tumor necrosis factor-α levels. Diabetes 57: 150–157, 2008. [DOI] [PubMed] [Google Scholar]
- 13.Hoehn KL, Hohnen-Behrens C, Cederberg A, Wu LE, Turner N, Yuasa T, Ebina Y, James DE. IRS1-independent defects define major nodes of insulin resistance. Cell Metab 7: 421–433, 2008. [DOI] [PMC free article] [PubMed] [Google Scholar]
- 14.Iredale JP Tissue inhibitors of metalloproteinases in liver fibrosis. Int J Biochem Cell Biol 29: 43–54, 1997. [DOI] [PubMed] [Google Scholar]
- 15.Jiang ZY, Lin YW, Clemont A, Feener EP, Hein DK, Igarashi M, Yamauchi T, White MF, King GL. Characterization of selective resistance to insulin signaling in the vasculature of obese Zucker (fa/fa) rats. J Clin Invest 104: 447–457, 1999. [DOI] [PMC free article] [PubMed] [Google Scholar]
- 16.Lee MPS, Sweeney G. Insulin increases gelatinase activity in rat glomerular mesangial cells via ERK- and PI-3 kinase-dependent signaling. Diabetes Obes Metab 8: 281–288, 2005. [DOI] [PubMed] [Google Scholar]
- 17.Longo GM, Xiong W, Greiner TC, Zhao Y, Fiotti N, Baxter BT. Matrix metalloproteinases 2 and 9 work in concert to produce aortic aneurysms. J Clin Invest 110: 625–632, 2002. [DOI] [PMC free article] [PubMed] [Google Scholar]
- 18.Peinnequin A, Mouret C, Birot O, Alonso A, Mathieu J, Clarencon D, Agay D, Chancerelle Y, Multon E. Rat proinflammatory cytokine and cytokine related mRNA quantitation by real-time polymerase chain reaction using SYBR Green. BMC Immunol 5: 3–12, 2004. [DOI] [PMC free article] [PubMed] [Google Scholar]
- 19.Reaven GM The role of insulin resistance in human disease. Diabetes 37: 1595–1607, 1988. [DOI] [PubMed] [Google Scholar]
- 20.Risinger GM, Hunt TS, Updike DL, Bullen EC, Howard EW. Matrix metalloproteinases-2 expression by vascular smooth muscle cells is mediated by both stimulatory and inhibitory signals in response to growth factors. J Biol Chem 281: 25915–25925, 2006. [DOI] [PubMed] [Google Scholar]
- 21.Saltiel RA, Kahn CR. Insulin signaling and the regulation of glucose and lipid metabolism. Nature 414: 799–806, 2001. [DOI] [PubMed] [Google Scholar]
- 22.Seger R, Krebs EG. The MAPK signaling cascade. FASEB J 9: 726–735, 1995. [PubMed] [Google Scholar]
- 23.Tataranni PA, Ortega E. A burning question: does an adipokine-induced activation of the immune system mediate the effect of overnutrition on type 2 diabetes? Diabetes 54: 917–927, 2005. [DOI] [PubMed] [Google Scholar]
- 24.Visse R, Nagase H. Matrix metalloproteinases and tissue inhibitors of metallo-proteinases. Structure, function, and biochemistry Circ Res 92: 827–839, 2003. [DOI] [PubMed] [Google Scholar]
- 25.Yan C, Boyd DD. Regulation of matrix metalloproteinase gene expression. J Cell Physiol 211: 19–26, 2007. [DOI] [PubMed] [Google Scholar]
- 26.Boden G Role of fatty acids in the pathogenesis of insulin resistance and NIDDM. Diabetes 46: 3–10, 1997. [PubMed] [Google Scholar]


