Abstract
Ribosomes from the gram-negative α-proteobacterium Caulobacter crescentus were isolated using standard methods. Proteins were separated using a two-dimensional liquid chromatographic system that allowed the analysis of whole proteins by direct coupling to an ESI-QTOF mass spectrometer and of proteolytic digests by a number of mass spectrometric methods. The masses of 53 of 54 ribosomal proteins were directly measured. Protein identifications and proposed post-translational modifications were supported by proteolysis with trypsin, endoprotease Glu-C and exoproteases carboxypeptidases Y and P. Tryptic peptide mass maps show an average sequence coverage of 62%, and carboxypeptidase C-terminal sequence tagging provided unambiguous identification of the small, highly basic proteins of the large subunit. C. crescentus presents some post-translational modifications that are similar to those of E. coli (e. g. N-terminal acetylation of S9 and S18) along with some unique variations, such as a near absence of L7 and extensive modification of L11. The comprehensive description of this organism’s ribosomal proteome provides a foundation for the study of ribosome structure, dependence of post-translational modifications on growth conditions, and the evolution of subcellular organelles.
Introduction
Ribosomes are enormous macromolecular complexes composed of ribonucleic acids (rRNAs) and proteins. In bacteria, their components include 3 rRNAs and some 54 proteins depending on the bacterial species. The average eubacterial ribosome has a molecular weight of 2.3. MDa, split unevenly between small (30S, 0.85 MDa) and large (50S, 1.45 MDa) subunits.1 Because of their abundance, straightforward isolation, and variety (both in terms of sequence and size), ribosomal proteins are a commonly used model for the development of high capacity separations of biological samples.2–10 The publication of crystal structures of the large and small subunits from archea and eubacteria and of whole ribosomes from eubacteria has sparked a renaissance in ribosome research.11–16 Ribosomal proteins stabilize rRNA structure, enhance its inherent catalytic function, and provide sites for the interaction of the ribosome with other intracellular complexes to integrate translation with other cellular processes.17,18 The evolution of proteins to enhance the stability, accuracy and efficiency of an originally RNA-based translation system marks the emergence of definite ancestral lines, leading to modern cellular life.19,20 Ribosomal proteins are studied in an attempt to understand the apparatus that evolved to integrate a crucial remnant of the pre-biotic RNA World into modern protein-based metabolism.
Prokaryotic ribosomes are one of the most productively exploited targets for antibiotics, and new classes of ribosomal antibiotics continue to be developed.21–23 The inescapable linkage between the application of new antibiotics and the development of transferable resistance to those drugs justifies the development of techniques for inventory and characterization of the translational machinery from organisms other than just a few standard laboratory strains.24
We have used a combination of top-down and bottom-up approaches to characterize the ribosomal proteins of Caulobacter crescentus, a bacterium that is the subject of on-going study in our laboratory.25–27 This gram negative α-proteobacterium’s ribosomal proteins were selected to validate the effectiveness of a serial multistep two dimensional liquid chromatography (2DLC) apparatus (described in a companion publication by Karty28) rather than the exhaustively studied γ-proteobacterium E. coli, because it is a member of a phylogenetic group containing the intracellular parasite Rickettsia prowazekii and the ancestor of the eukaryotic mitochondrion.29 Identifications based on whole protein mass measurements were confirmed by mass spectrometric analysis of tryptic peptides (MS and MS/MS) and a mass spectrometry-based C-terminal sequencing approach using carboxypeptidases Y and P (CPY and CPP).30–34
Materials and Methods
Chemicals and Solvents
Acetonitrile, glacial acetic acid and urea were purchased from EMD Chemicals (Gibbstown, NJ). Water was purified using a Barnstead/Thermolyne E-Pure system (Barnstead/Thermolyne, Dubuqe, IA). Type II Bovine trypsin (T-8802), Sequencing Grade alkylated Porcine trypsin (T-6567), magnesium acetate tetrahydrate, and Trizma base were obtained from the Sigma Chemical Company (St. Louis, MO). Ammonium chloride, 2-mercaptoethanol, and 40% aqueous methylamine were supplied by Aldrich (Aldrich Chemical, Milwaukee, WI). Endoproteinase Glu-C (New England Biolabs, Beverly, MA), Carboxypeptidase Y (CPY) (Worthington Biochemicals, Lakewood, NJ), and Carboxypeptidase P (CPP) (Takara Mirus Bio, Madison, WI) were used for sequencing experiments.
Bacterial Strains and Growth Conditions
Starter cultures of Caulobacter crescentus CB15N were produced by overnight growth of cells from a single colony. The resulting culture was aliquoted into 5 mL starters with 10% by volume DMSO as a cryopreservative and frozen at −80 °C until required. Cultures grown for the preparation of ribosomes were started by the inoculation of one starter culture into 500 ml of 2% peptone/1% yeast extract broth (PYE) (Difco/BD Biosciences, San Jose, CA) and grown for 12–14 hours at 30 °C, shaking at 150 rpm for aeration.
Protein Sequence Data
The most recently updated version of the Caulobacter crescentus proteome was obtained from The Institute for Genome Research (www.tigr.org, Genebank Accession Number AE005673.1).35 Theoretical molecular weights were calculated from this database using an in-house computer program, PRODIGIES.25 Additional information on C. crescentus ribosomal protein sequences was obtained from the SwissProt database at ExPASY (www.expasy.org).36 When entries from SwissProt were used e.g. for homology comparisons, accession numbers for the sequences are given. Homologies were assessed using the blast2p version of BLAST from the National Center for Biotechnology Information. (www.ncbi.nih.gov).37
Ribosome Preparation
Ribosomes were prepared using Reilly and Arnold’s modification of the method of Spedding.5,38 The Buffers A, B, and E are those described by Spedding. Briefly, C. crescentus CB15N cells grown as described above were harvested by centrifugation at 6000 × g for 20 minutes, washed once with 250 mL of Buffer A per pellet and then resuspended in a minimal volume of Buffer A plus miniComplete EDTA-free Protease Inhibitor Cocktail (1 tablet/10 mL of buffer, Roche Applied Science, Indianapolis, IN). Cells were lysed by 5 passes through a French press (Thermo Electron, Needham Heights, MA) at 16,000 psi, and the resulting lysate was cleared of cell debris by centrifugation at 30,000 × g for 45 minutes. Ribosomes were salt washed twice at 100,000 × g for 16 hours with an equal volume of 1.1 M sucrose in Buffer B. The final pellet was resuspended in Buffer E, dialyzed for 16 hours against two 3000-fold volume excesses of that buffer to remove residual sucrose, and aliquoted into 100 μL portions for storage at −80 °C. A typical preparation produced ~4 mL of ribosome suspension with a protein concentration of 8 mg/mL by Bradford assay using bovine serum albumin as the standard.39 When acid extracted, the supernatant showed a protein concentration of 2.5 mg/mL, indicating minimal loss of protein from the sample.40
Coupled 2DLC-ESI-MS
The 60 column chromatography device used in these experiments has been described in more detail elsewhere.28 It consists of a strong cation exchange column feeding an array of sixty C4 reversed phase “trap” columns, followed by two C4 reversed phase “analysis columns”. Because of the limited complexity of this protein mixture, only twenty of the traps were used in the experiments described below. Fluid handling and method control are supplied by two Waters Alliance chromatographs (Waters, Milford, MA). Gradient methods provide the initial contact closure impulses that initiate control of the valve system by LabView version 6.1 (National Instruments, Austin, TX). All of the results reported below were obtained by injecting 50 μL of an acetic acid/MgCl2 extract containing 125 μg of total protein, or 145 pmole of each protein.
Dimension 1: Ion Exchange Chromatography
Ion exchange separations were performed using a Waters Alliance 2695 Separations Module for solvent delivery and method control. A Toso-Haas SP-NPR column (4.6 mm × 35 mm, Tosoh Bioscience, Montgomeryville, PA), was developed using the mobile phases and gradient shown in Supplemental Table 1. Following a 10 minute load time (during which any non-retained proteins were directed through Trap 1) and a 10 minute wash (during which time IEC column effluent was directed through Trap 2), traps were switched every 5 minutes up to 100 minutes, at which time Trap 20 collected any tailing proteins.
Dimension 2: Reversed Phase Chromatography
Proteins eluting from the ion exchange dimension were trapped by ThermoHypersil Keystone Javelin guard columns (1.0 mm × 20 mm), packed with BioBasic C4 stationary phase. Analytical columns were ThermoHypersil Keystone Pioneer columns (1.0 mm × 100 mm), packed with the same material. Following development of the IEC dimension, trapping columns were washed for 2 minutes at 50 μL/min with RPLC Buffer A (95% water, 5% acetonitrile, 0.1% formic acid by volume). Buffer B and the gradient used are listed in Supplemental Table 2. A longer, flatter gradient with the alternate mobile phases, shown in Supplemental Table 3, was also used for some experiments.
Dimension 3: Whole Protein Mass Spectrometry
Whole protein mass spectra were acquired using a MicroMass Q-Tof Micro quadrupole time-of-flight mass spectrometer outfitted with an ESI ionization source. Reverse phase column effluent was split from a flow rate of 50 μL/min to 7 μL/min and directed to the ionization source.
Whole protein masses were determined by the manual selection of peaks in TICs from the reversed phase chromatograms or with AutoME 1.1, a program that automates the spectral extraction and deconvolution process. When analyzing data manually, spectra corresponding to a given chromatographic peak were summed together producing a sample spectrum that contained signals from all the charge states of the proteins present. Whole protein masses were extracted from these spectra by deconvolution using MaxEnt 1.
Identification and Characterization of Ribosomal Proteins
Few of the measured masses exactly matched calculated masses, and the discrepancies were accounted for by proposing various post-translational modifications. Enzymatic digestion methods were applied to confirm protein identities and modifications, and sometimes allowed the site of modification to be determined.
Whole Protein C-Terminal Sequence Analysis with Carboxypeptidases Y and P
Protein fractions collected from the 2DLC system were dried in a SpeedVac vacuum centrifuge (Jouan/Thermo Electron) and stored at −20°C until needed. Prior to carboxypeptidase treatment, these fractions were resuspended in 30μL of 100 mM pyridine acetate buffer (pH 5.5), mixed with 50μL of saturated urea solution (~12M) and incubated at 37 °C for 15 minutes to denature the proteins. 20μL of a solution containing 0.60 μg of CPY and CPP or 1.20 μg of CPY and CPP enzymes in pyridine acetate were then added to the denatured proteins. Digestions were performed at room temperature or at 37°C. Aliquots were removed at several time points and acidified with 2% formic acid solution to quench the reaction. LC-MS analyses of the carboxypeptidase digests were performed using a Waters Alliance 2795 separations module coupled to a Q-Tof Micro mass spectrometer. Chromatographic separations were conducted on a BioBasic Pioneer C4 column (1 mm i. d. × 50 mm length) using conditions in Supplemental Table 4. The 50 μL/min flow rate through the column was split to 10μL/min and directed to the electrospray ionization source.
Larger quantities of ribosomal proteins L11 and S21 were isolated for CPY/CPP digest analysis on an analytical-sized reverse phase column (Jupiter C4, 4.6 mm i.d. × 250 mm length, 5 μm particle size, Phenomenex, Torrance, CA). For these separations, conditions shown in Supplemental Table 5 were used. A Waters 484 uv/vis detector was used in-line between the column and fraction collector to detect eluting proteins by their absorbance at 215 nm.
Tryptic Digestion of Trapping Column Fractions
Fractions collected from the analytical columns were taken to dryness to remove formic acid and resuspended in 10 mM ammonium bicarbonate buffer, after which 0.2 μg of sequencing grade trypsin and 0.1 μg of Type II Bovine trypsin in 10 mM ammonium bicarbonate were added, giving a final volume of ~20 μL. Samples were incubated for 12–16 hours at 37 °C.
Glu-C Digestion
Peptide mass mapping using Glu-C digestion was employed to confirm the identity of ribosomal protein S21. The protein isolated by reversed phase LC fractionation was dried and stored at −20°C. Prior to digestion, the protein was resuspended in 100 mM ammonium bicarbonate buffer. 30 μL of this solution was digested with 0.09 μg of Glu-C by incubating at 37 °C for 14 hours. The reaction was terminated by drying the sample. Glu-C digests were analyzed by MALDI MS.
Capillary LC-ESI-MS/MS
Peptide analysis by capillary LC-MS was performed using a ThermoElectron LCQ Deca XP Plus ion trap mass spectrometer and Surveyor chromatography system. Peptides (~30 pmole total) were separated on 10 cm × 254 μm i. d. capillary LC columns containing ThermoHypersil Keystone BioBasic C18. The 100 μL/min flow from the HPLC pump was split 1:20 prior to the sample loop to give a flow rate of 5 μl/min through the column. The separation gradient using 0.1% formic acid in water as Buffer A and 0.1% formic acid in acetonitrile as Buffer B is shown in Supplemental Table 6.
Combined MS and MS/MS spectra were searched against the most recent version of the Caulobacter crescentus CB15 proteome using TurboSEQUEST.40,41 Because the expected set of proteins was small, TurboSEQUEST search results were all examined directly, with no filtering. Identifications that featured fewer than 3 matches, low quality MS/MS spectra (i. e. high noise levels, low intensities of fragment ions, short series of b- or y-ions), Xcorr values less than 2.0 (regardless of proposed charge state), or that belonged to a protein that had not been identified in the trap during whole protein experiments were ignored.
MALDI MS
Tryptic digests were quenched and split for preparation of unguanidinated MALDI spectra or guanidination following the procedure of Beardsley and Reilly.42 Both the guanidinated and unguanidinated samples were concentrated by the use of home-made C18-loaded pipette tips and eluted with a matrix solution of 10 mg/ml α-cyano-4-hydroxycinnamic acid in 50% water, 50% acetonitrile, 0.5% TFA. A 1 μl portion of this eluate was spotted for analysis with an ABI 4700 Proteome Analyzer (Applied Biosystems, Foster City, CA). Spectra were calibrated using external standard mixtures.
Mass spectra from pairs of spots representing unguanidinated and guanidinated aliquots of peptides from the same tryptic digest reaction were used to produce pairs of peak lists for analysis using the two-file comparison function of PRODIGIES.25 Searches were performed against the latest version of the complete C. crescentus proteome. MASCOT searches were performed as “MS + MS-MS Combined” searches against the most recent version of the C. crescentus proteome database. 43 As with the capillary LC-MS data, the candidate list was small enough that the spectra supporting a particular identification could be examined directly. Identifications supported by MOWSE scores less than twice the threshold value (49 for the C. crescentus whole proteome), few MS/MS spectra or low intensity MS/MS spectra were rejected.
Results
Based on earlier research in our laboratory with E. coli, we expected that the Caulobacter crescentus ribosomal protein preparation would contain all ribosomal proteins except S1 and contain a limited number of post-translational modifications.38,45 The most common modification is removal of the N-terminal methionyl residue by N-terminal methionine aminopeptidase, a metalloendopeptidase that specifically removes methionine residues succeeded by amino acids with small side chains (G, A, S, T, P and V).46,47 After this modification, acetylation or methylation of amino groups occur most frequently. A few more exotic modifications were also anticipated, e. g. the β-thiomethylation of an aspartyl residue in E. coli S12.48 Each of these modifications results in a predictable change to the theoretical mass of a protein allowing a list of possible whole protein masses to be generated from the proteome. Provisional identifications for each component in the acid extract of a ribosome sample are then obtained by matching experimental whole protein masses to these calculated values. Variations on this straightforward strategy have been contemporaneously developed and applied to the characterization of the ribosomal proteomes of the α-proteobacterium Rhodopseudomonas palustris and a strain of Thermus thermophilus for which no genome sequence exists.9,10
The masses obtained for C. crescentus ribosomal proteins are listed in Table 1, along with theoretical masses calculated from the proteome and data on the elution position and sequence coverage for each protein. Of the 53 unique polypeptides in C. crescentus ribosomes, one quarter were identified by direct matches with the theoretical masses. A further half of the ribosomal proteins were identified by subtracting the residue mass of methionine from the theoretical mass. The remaining one quarter of the ribosomal proteins were identified by applying combinations of methionine removal (-131.2 Da, “-Met”), acetylation (+42.04 Da, “+CH3CO”), methylation (+14.03 Da, “+CH2”), and in one case, oxidation (+16 Da, “+O”). This procedure produced matches for all but four ribosomal proteins: L3, L21, S1, and S21. L3, L21 and S21, were assumed to be the subjects of more exotic posttranslational modifications. S1 is a component of actively translating polyribosomes but is often lost from tight-coupled ribosome preparations such as ours when cells are slowly cooled in the absence of puromycin, or by co-precipitation with rRNA during acid extaction.5, 49–51
Table 1.
Whole protein and digest data for ribosomal proteins from Caulobacter crescentus.
| Ribosomal large subunit proteins | |||||||
|---|---|---|---|---|---|---|---|
| Protein | Theo. Massa | Avg. mass | Modifications | Whole Proteins Locationb | CapLC/ESI-MS % sequence | MALDI % sequence | Net Coverage %sequence |
| L1 | 23735.3 | 23618.8 | -Met, +CH2 | Trap 7 | 63 | 72 | 79 |
| L2 | 30156.8 | 30028.7 | -Met; | Trap 18 | 43 | 53 | 56 |
| L3 | 28079.9 | 26666.7 | Removal of residues 1–13 | Trap 11 | 51 | 43 | 57 |
| L4 | 22792.4 | 22794.9 | Trap 16 | 31 | 52 | 60 | |
| L5 | 20965.5 | 20836.2 | -Met | Trap 8 | 53 | 50 | 64 |
| L6 | 18885.1 | 18756.1 | -Met | Trap 13 | 44 | 41 | 51 |
| L7/L12 | 13289.2 | 13172.9 | -Met, +CH2 | Trap 4 | 43 | 51 | 56 |
| L9 | 20909.3 | 20910.2 | Trap 6 | 32 | 47 | 47 | |
| L10 | 18039.0 | 18040.4 | Trap 7 | 48 | 63 | 63 | |
| L11 | 15387.0 | 15509.5 | -Met, 6 +42 Da modifications | Trap 7 | 41 | 50 | 59 |
| L13 | 17741.5 | 17743.5 | Trap 11 | 45 | 40 | 54 | |
| L14 | 13369.8 | 13371.2 | Trap 10 | 49 | 57 | 62 | |
| L15 | 16924.7 | 16795.8 | -Met | Trap 12 | 67 | 50 | 73 |
| L16 | 15851.6 | 15883.8 | +CH2, +O | Trap 16 | 43 | 39 | 50 |
| L17 | 15325.7 | 15327.6 | Trap 18 | 70 | 70 | 75 | |
| L18 | 12443.2 | 12327.4 | -Met, +CH2 | Trap 11 | 58 | 48 | 63 |
| L19 | 14521.7 | 14391.9 | -Met | Trap 10 | 37 | 58 | 58 |
| L20 | 13152.4 | 13023.0 | -Met | Trap 19 | 33 | 53 | 58 |
| L21 | 17857.6 | 17858.5 | Trap 14 | 28 | 23 | 32 | |
| L22 | 14239.5 | 14109.8 | -Met | Trap 12 | 49 | 41 | 65 |
| L23 | 10715.5 | 10585.1 | -Met | Trap 9 | 49 | 74 | 75 |
| L24 | 10994.8 | 10864.8 | -Met | Trap 9 | 57 | 65 | 74 |
| L25 | 21232.3 | 21102.2 | -Met | Trap 7 | 80 | 52 | 87 |
| L27 | 9370.7 | 9111.2 | -Met, -C-terminal glutamate. | Trap 12 | 32 | 41 | 43 |
| L28 | 10630.4 | 10499.4 | -Met | Trap 10 | 43 | 60 | 66 |
| L29 | 7134.4 | 7135.0 | Trap 7 | 59 | 59 | 59 | |
| L30 | 6811.9 | 6681.3 | -Met | Trap 7 | 51 | 75 | 77 |
| L31 | 8374.4 | 8375.1 | Trap 7 | 51 | 76 | 86 | |
| L32 | 6910.9 | 6794.7 | -Met, +CH2 | Trap 14 | 48 | 60 | 63 |
| L33 | 6413.6 | 6297.5 | -Met, +CH2 | Trap 11 | 55 | 67 | 69 |
| L34 | 5194.2 | 5195.0 | Trap 19 | ||||
| L35 | 7353.8 | 7223.0 | -Met | Trap 19 | 20 | 52 | 52 |
| L36 | 4830.9 | 4830.1 | Trap 17 | 34 | 31 | 34 | |
| S2 | 28701.8 | 28571.3 | -Met | Trap 9 | 28 | 39 | 40 |
| S3 | 28139.4 | 28011.9 | -Met | Trap 14 | 49 | 60 | 66 |
| S4 | 23287.6 | 23157.1 | -Met | Trap 18 | 54 | 72 | 75 |
| S5 | 21611.7 | 21496.6 | -Met, +CH2 | Trap 13 | 55 | 60 | 63 |
| S6 | 14564.6 | 14434.9 | -Met | Trap 8 | 68 | 72 | 84 |
| S7 | 18001.6 | 17872.8 | -Met | Trap 14 | 70 | 70 | 76 |
| S8 | 14487.8 | 14357.3 | -Met | Trap 8 | 60 | 71 | 78 |
| S9 | 17186.7 | 17099.6 | -Met, N-terminal acetylated | Trap 13 | 45 | 56 | 77 |
| S10 | 11704.6 | 11705.3 | Trap 10 | 34 | 60 | 61 | |
| S11 | 13774.7 | 13660.7 | -Met, +CH2 | Trap 11 | 33 | 43 | 45 |
| S12 | 13825.4 | 13694.1 | -Met | Trap 18 | 31 | 57 | 70 |
| S13 | 13866.1 | 13733.0 | -Met | Trap 16 | 66 | 68 | 84 |
| S14 | 11433.5 | 11303.1 | -Met | Trap 15 | 36 | 45 | 52 |
| S15 | 10140.7 | 10011.0 | -Met | Trap 14 | 48 | 58 | 59 |
| S16 | 17604.7 | 17606.5 | Trap 11 | 46 | 31 | 46 | |
| S17 | 8831.5 | 8701.5 | -Met | Trap 11 | 65 | 48 | 81 |
| S18 | 10113.9 | 10025.8 | -Met, N-terminal acetylated | Trap 12 | 19 | 50 | 58 |
| S19 | 10256.0 | 10125.6 | -Met | Trap 12 | 77 | 65 | 88 |
| S20 | 9928.6 | 9798.3 | -Met | Trap 16 | 39 | 29 | 39 |
| S21 | 10174.0 | 9062.4 | Removal of residues 1–10 | Trap 18 | 22 | 44 | 45 |
“Theo(retical) Mass” was calculated from the most recently deposited translated version of the Caulobacter crescentus genome available from The Institute for Genome Research using the in-house program PRODIGIES.25
“Location” corresponds to the trap where the protein has its highest intensity in deconvoluted whole protein spectra.
In order to confirm the proposed identities and post-translational modifications, several series of experiments based on enzymatic digestion experiments were performed. These experiments confirmed the identifications of all but the smallest proteins from the large ribosomal subunit (see below). Analysis of tryptic peptide samples also identified whole protein masses for L3, L21 and S21. Complications associated with the identification of these proteins are discussed below.
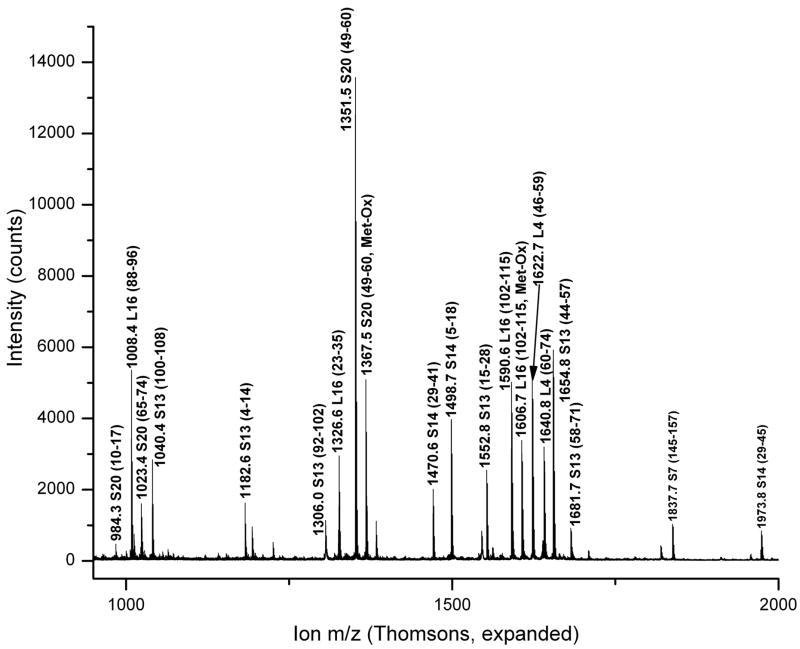
The identification of ribosomal protein L16 illustrates the results obtained from the procedures described above. Figure 1 shows one example of a spectrum obtained by summing together 100 scans from a total ion chromatogram (TIC), along with the deconvoluted version of these data. A small contribution from ribosomal protein S20 also appears in the spectrum. A MALDI spectrum of the tryptic digest of a fraction from Trap 16 is shown in Figure 2. This fraction contains peptides from other Trap 16 proteins (L4, S13 and S20) as well as proteins S7 and S14. Peptide assignments in Figure 2 are based on both peptide mass matches and fragmentation spectra. A representative example of an MS/MS spectrum collected is shown in Figure 3. Although the sequence coverage of L16 is 43%, no peptides containing the proposed modifications are observed.
Figure 1.
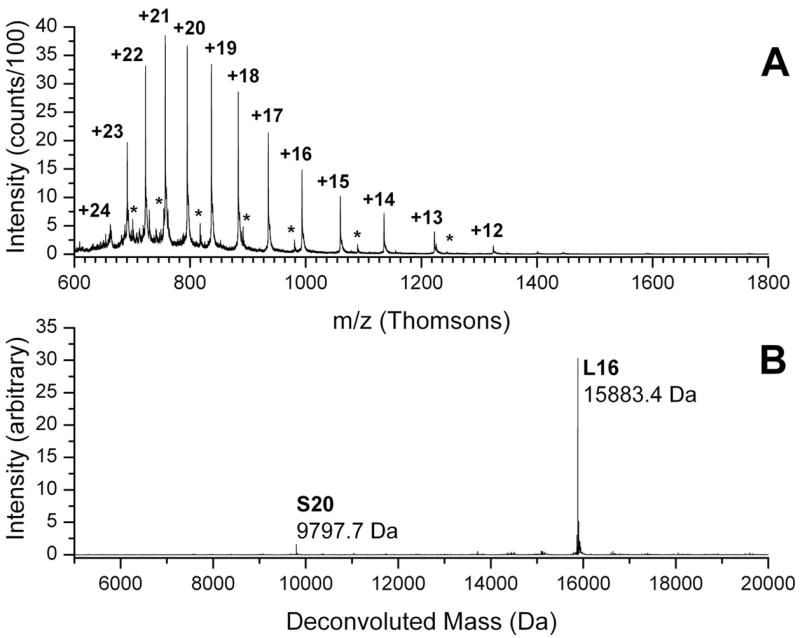
Whole protein mass spectra of Ribosomal Protein L16. (A) Raw spectrum with charge states for Ribosomal Protein L16 as indicated. Asterisks show the less intense +14 to +8 charge states of Ribosomal Protein S20. (B) Deconvoluted spectrum.
Figure 2.
MALDI spectrum of the tryptic digest of a fraction collected from Trap 16. Peptides from proteins observed to elute in Trap 16 during whole protein experiments are assigned on the basis of mass and MS-MS fragmentation patterns. The mass scale of this figure has been truncated somewhat to improve the visibility of the assigned peptides; a peak at m/z = 2125.9 (L16 residues 68–87) is not shown.
Figure 3.
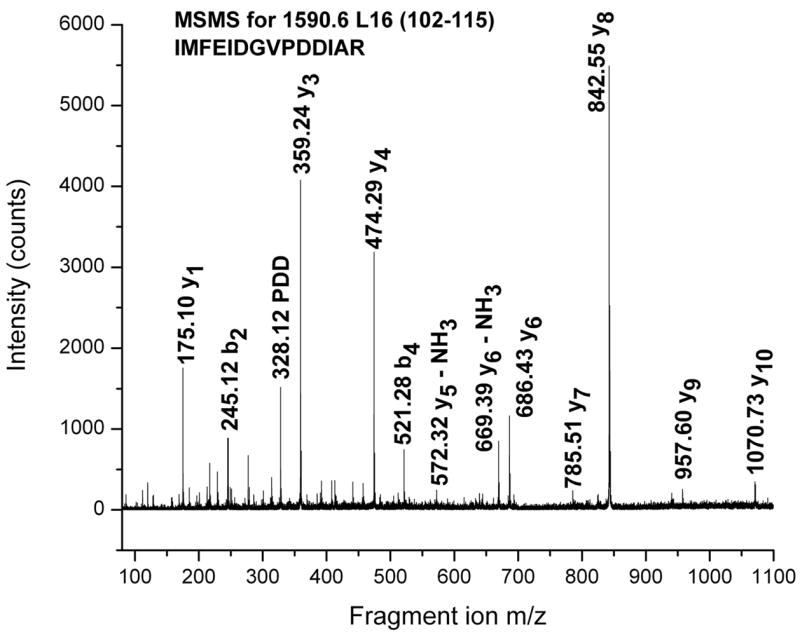
TOF-TOF spectrum of an m/z = 1590.6 peptide ion containing residues 102–115 of Ribosomal Protein L16 seen in Figure 2.
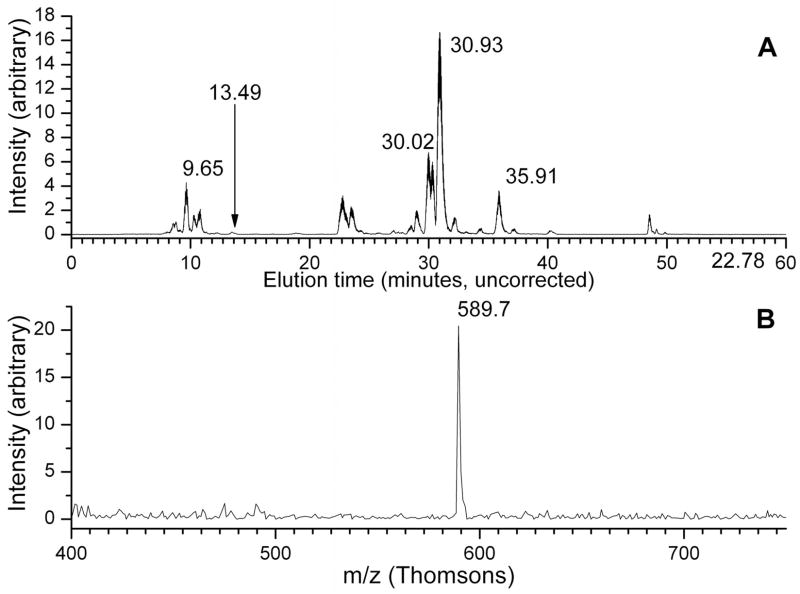
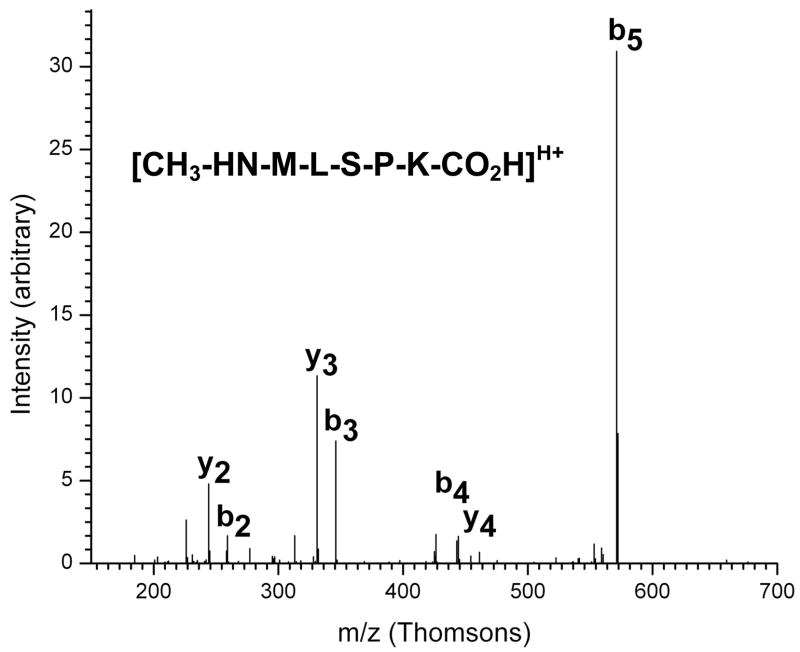
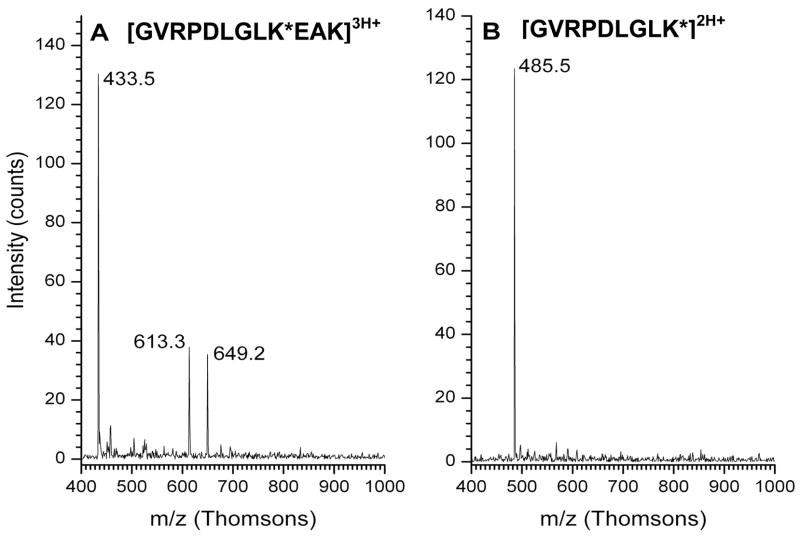
Tryptic digest fractions from Trap 16 were also analyzed using capillary LC-MS/MS. In the case of ribosomal protein L16, coverage was slightly lower than MALDI experiments, with peptides from essentially the same regions of the protein being observed. However, in these experiments a singly charged pentapeptide with m/z of 589.6 Da was also observed to elute in a small peak at 13.5 minutes, as shown in Figure 4. This peptide’s mass corresponds to the N-terminal tryptic pentapeptide from L16 (MLSPK, 575.7 Da as a singly protonated peptide) with a mass increase of 14 Da. This would be consistent with the N-terminal methylation as performed by E. coli.52 This peptide’s identification is supported by an MS-MS spectrum (Figure 5) containing a distinct series of y- and b-ions that are assignable assuming methylation. Tryptic peptide analysis experiments have provided no evidence for the identity or location of the second modification of L16.
Figure 4.
(A) Total ion chromatogram of a peptide digest from Trap 15, Fraction 2. (B) Mass spectrum extracted from the TIC at the point indicated by an arrow (13.49 minutes), showing a peptide containing the methylated N-terminus of ribosomal protein L16.
Figure 5.
The ESI-Ion Trap MS-MS spectrum for a peptide containing the modified amino terminus of ribosomal protein L16. With N-terminal methylation, the b4 and y4 ion mass-to-charge ratios differ by only 1 unit, and so the labels overlap.
Post-translational Modifications
In several cases, we have directly observed the site of modification of C. crescentus’s ribosomal proteins. Ribosomal proteins L4, L13, L14, L29, L31 and S10, are proposed to be unmodified at their N-termini and we have observed peptides containing unmodified N-termini. Methionine-truncated N-terminal peptides have been observed for ribosomal proteins L2, L5, L15, L19, L25, L30, S2, S6, S8 and S12.
Ribosomal proteins S9 and S18 are proposed to occur in their N-terminally acetylated forms. MALDI spectra contain masses attributed to both modified and unmodified N-terminal peptides. Deconvoluted whole protein spectra also show signals corresponding to unacetylated S9 (~10% of the intensity of the acetylated protein) and S18 (~5% of the intensity of the acetylated protein). A possible explanation for the presence of unmodified proteins is hydrolytic degradation of the N-terminal acetyl group during storage of the samples. It is also possible that this post-translational modification is not stoichiometric, or that the modification accumulates as a function of the age of the culture or its growth conditions. Table 1 summarizes other proposed modifications of Caulobacter ribosomal proteins. One notable absence is the β-thiomethylation of residue D89 in C. crescentus S12. This modification was first identified in E. coli S12, and has been observed in T. thermophilus S12.10,48 This modification was undetected in whole protein data collected from R. palustris, although modified peptides were detected in tryptic digests.9 No evidence of this modification has been detected in our tryptic digest experiments with C. crescentus ribosomal proteins, and it remains uncertain whether C. crescentus lacks the ability to perform this modification, or simply does not modifiy its S12 homolog under the growth conditions we have studied..
Special Cases and Notable Proteins
Ribosomal Protein L3
The calculated mass for L3 is 28079.9 Da, or 27948.7 without the N-terminal methionine. Neither of these masses was observed in the whole protein experiments. Nevertheless LC-ESI-MS experiments identified peptides from protein L3 in fractions collected from traps containing an intense, unidentified protein mass of 26666.7 Da. Removal of residues 1–13 from the translated sequence results in a calculated mass of 26666.4 Da, in good agreement with the unknown whole protein mass. Misassignment of the start codon seems to be a likely explanation for this sequence discrepancy, as discussed below. Finally, although the E. coli homolog of L3 (ExPASY Accession Number P60438) is known to be N-methylated at position Q150, the corresponding residue C. crescentus L3 (ExPASY Accession Number Q9A8V3), Q156, does not appear to be modified.52,53
Ribosomal Protein L11
Tryptic digests of a fraction from Trap 7 that was associated with a protein mass of 15509 Da contained multiple peptides attributed to L11. This protein mass is 253 Da higher than that predicted for L11, a modification equivalent to trimethylation or acetylation at six positions. Post-translational modifications of this type are found in L11 homologs from E. coli (three positions: N-terminus, K3 and K39)54, Thermus thermophilus (four positions)55,56, and Rhodopseudomonas palustris (four positions)9. The positions of modification in the E. coli homolog are usually considered to be conserved. Tryptic digests of L11 include peptides generated by cleavage at K13, K114, K126, K133 and K138, allowing these residues to be eliminated from consideration as sites of modification. A triply charged ion of m/z 1048.2 observed during analysis of Trap 7 was attributed to a peptide of mass 3142.6 Da containing residues 45–71. This match required two 42 Da modifications, suggesting that residues K50 and K64 are sites of modification (Table 2). Other candidates for which we have no data are K9, K80, K86, K90, K111 and K112.
Table 2.
Observed peptides that confirm proposed post-translational modifications
| Sequence | Residues | Mass | ||
|---|---|---|---|---|
| N-terminal acetylation | ||||
| S9 | *TDAQGFDALASLSSNPEAAAPEPK | 2–26 | 2499.9 | |
| S18 | *TDTTAPEAGAPAAAAGGAR | 2–20 | 1697.9 | |
| Methylation of K | ||||
| L7/L12 | GVRPDLGLK*EAK | 80–91 | 1297.5 | +3 ion, m/z = 433.6 |
| L7/L12 | GVRPDLGLK* | 80–88 | 969.2 | +2 ion, m/z = 485.3 |
| N-terminal methylation | ||||
| L16 | *MLSPK | 1–5 | 589.8 | +1 ion, Xcorr = 1.47 |
| Addition of 42 to K | ||||
| L11 | TENVEK*GTPLPTVITVYQDK*SFTFITK | 46–72 | 3142.6 | +3 ion, m/z 1048.7 |
In order to confirm that mass 15509 Da should be associated with L11, pure protein was isolated using RPLC fractionation and subjected to C-terminal sequencing using carboxypeptidases Y and P. As shown in Figure 6, comparison of mass spectra from aliquots removed at different time points during digestion with a CPY/CPP mixture yielded a C-terminal sequence of (KI)VEA, consistent with the C-terminal sequence of C. crescentus ribosomal protein L11 with no modifications at position K139.
Figure 6.
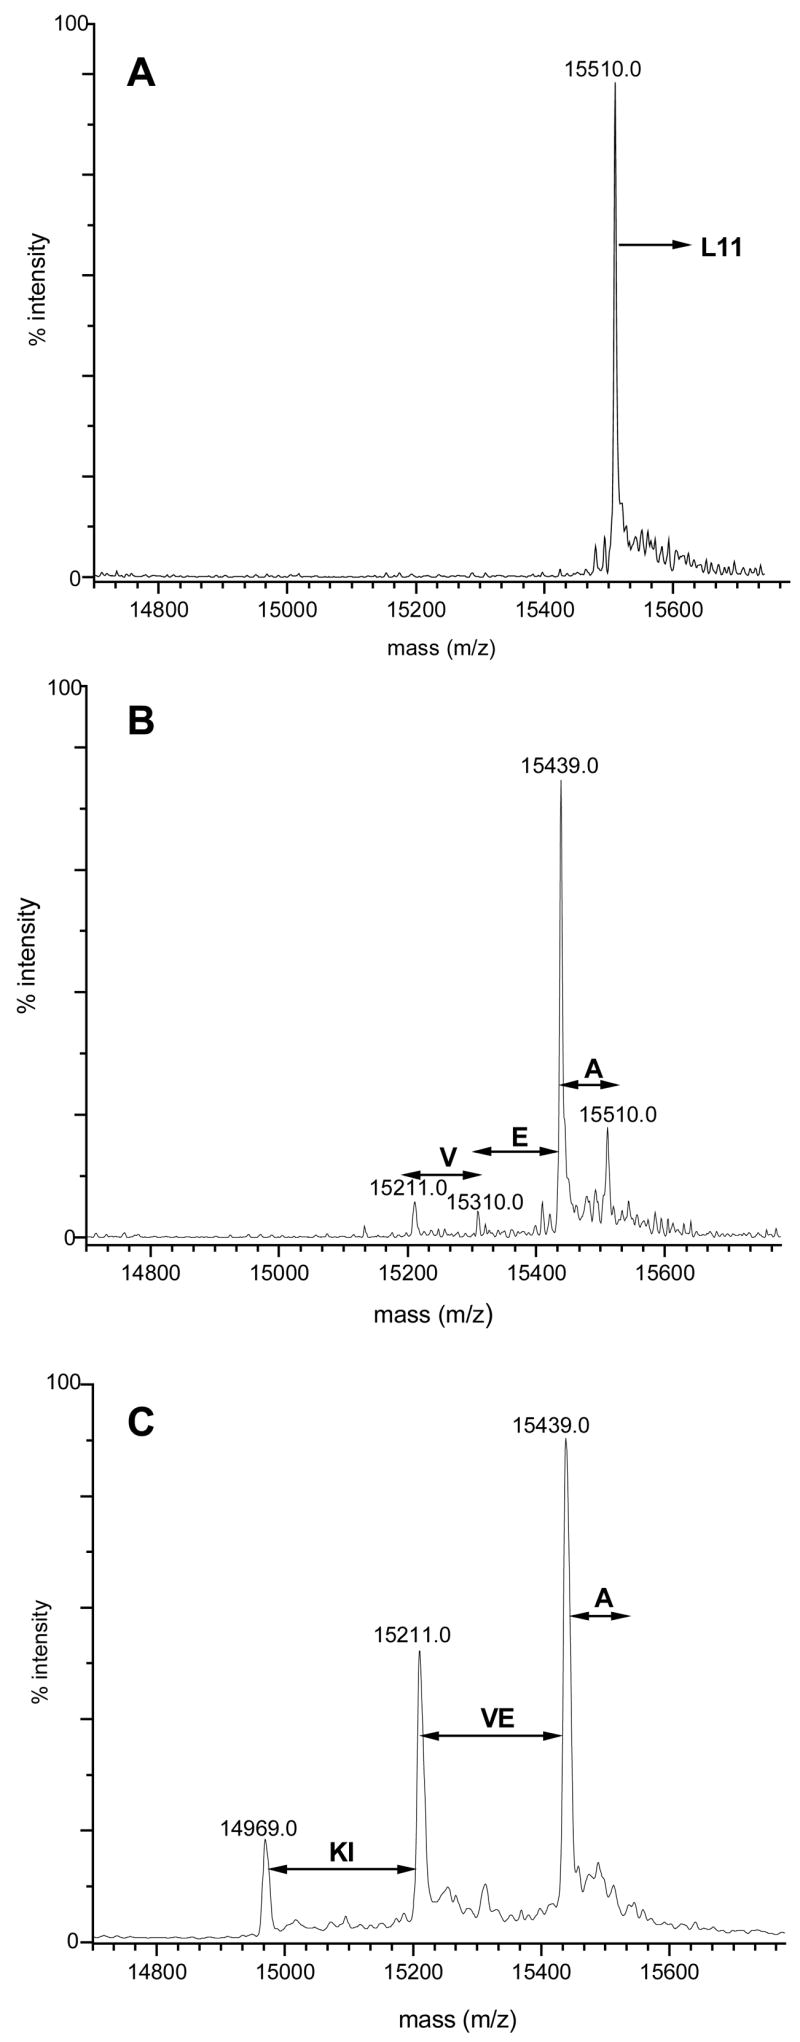
C-Terminal sequence analysis of L11 using CPY/CPP. Deconvoluted mass spectra of L11, (A) Digestion time = 0 minutes. (B) Digestion time = 0.33 minutes. (C) Digestion time = 1.5 minutes.
We have identified peptides in an endoprotease Glu-C digest containing residues 50–63 (with a mass increase of 42 at position 50), residues 111–122 (no modifications) and residues 130–142 (no modifications). These results support the assignment of residue K50 as being a site of derivatization and rule out K111 and K112 as candidates.57 Experiments are currently underway to better define the sites of modification of this protein, and to determine whether the modifications are dependant on environmental or growth conditions.58
Ribosomal Protein L7/L12
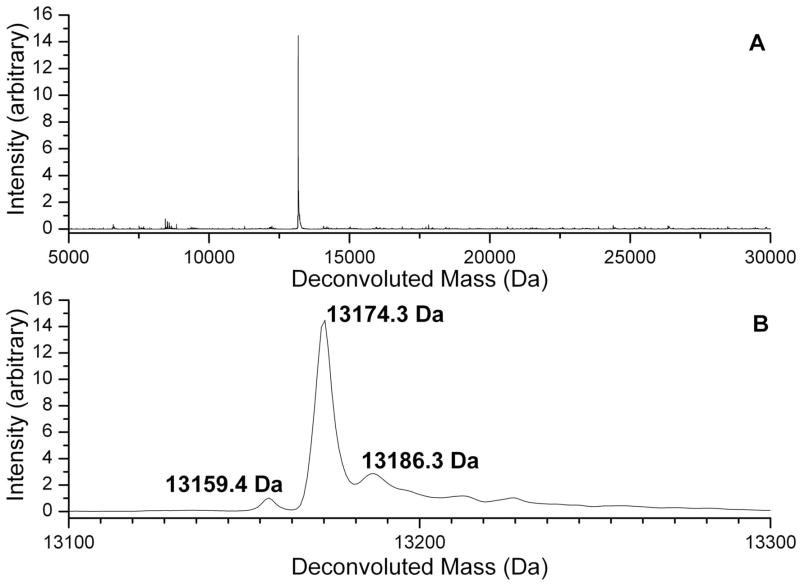
Ribosomal proteins L7 and L12 are both products of the rplL gene (ORF CC0497 in the C. crescentus proteome). The amino acid sequence of these proteins is identical, and they differ only by the presence (L7) or absence (L12) of an N-terminal acetyl group.59,60 C. crescentus does not appear to acetylate the N-terminus of its L7/L12 homolog as E. coli does under the growth conditions used for these experiments. Figure 7 shows the major form of C. crescentus L12 with a mass of 13173 Da, corresponding to removal of the N-terminal methionine and addition of a methyl group. There is also a significant amount of a form of the protein with a mass of 13186 Da, which indicates the addition of a second methyl group to the 13173 Da form. Capillary LC-MS experiments have provided direct evidence for the site of one of the two proposed methylations. Figure 8 shows MS spectra of two tryptic peptides with overlapping sequence coverage (residues 80–88 and 80–91) whose masses are both consistent with a single methylation at K88. Supplemental Figure 1 shows corresponding MS-MS spectra. The identity of the peptide containing residues 80–91 is corroborated by enhanced y7 and b10 ion formation due to the aspartyl residue at position 5 and the glutamyl residue at position 10 seen in Supplemental Figure 1A. The spectrum of the overlapping peptide containing residues 80–88 in Supplemental Figure 1B shows enhanced cleavage adjacent to the aspartyl residue. Fragments whose mass to charge ratios are consistent with the presence of the methyl substitution are indicated in the figure. A sequence alignment of the E. coli and C. crescentus proteins indicates that K88 in the C. crescentus sequence is homologous to K81 in the E. coli L7/L12 sequence, and as a result this modification is likely to be temperature dependant.61 To date we have not observed a peptide containing the proposed second site of modification of L7/L12.
Figure 7.
(A) Deconvoluted mass spectrum from Trap 4 containing L7/L12. (B) Expansion of the spectrum in A, showing the major, singly methylated form of L7/L12 (13174.4 Da), the doubly methylated form (13186.3 Da), and a small amount of unmethylated protein (13159.4 Da).
Figure 8.
ESI-Ion Trap mass spectra of modified peptides from L7/L12. (A) Triply protonated peptide ion containing residues 80–91. The 649.2 Th ion is the doubly protonated form of the peptide containing residues 80–91. The 613.3 Th ion is consistent with a doubly charged ion from which a glycine residue and a further 16 Da have been lost. (B) Doubly protonated ion containing residues 80–88.
Ribosomal Protein L27
An intense, recurring mass of 9111.2 Da was observed in fractions from Trap 12. This mass could not be associated with any ribosomal proteins by applying any of the expected post-translational modifications. The observation of tryptic peptides from L27 in fractions from this trap suggested that this unknown was a modified form of L27. The mass calculated after removal of the N-terminal methionine, 9239.5 Da, is 128 Da heavier than the observed 9111.2 Da. Because the predicted C-terminal sequence of L27 is AQPAE, the 9111.2 Da unknown protein was tentatively identified as L27 with a single C-terminal residue truncation. Twenty minute CPY/CPP digests of L27 were found to contain a whole protein species showing a clear loss of 71 Da from 9111 Da. This indicates that the C-terminal residue is alanine rather than glutamic acid, confirming the absence of the glutamate predicted by the proteomic sequence from the isolated form of the protein. Its absence may be due to exoproteolytic processing or more likely due to an error in the identification of the gene’s stop codon (see below).
Ribosomal Proteins S7 and L21
A protein with a mass of 17872.8 Da was observed to elute in Trap 15. This mass could be identified as either L21 plus a methyl group (17871.6 Da) or S7 minus its N-terminal methionine (17870.4 Da). Analysis of the tryptic digests using either LC-ESI-MS or MALDI MS showed that peptides from ribosomal protein S7 appeared in fractions collected from Traps 13 through 16, while peptides from Ribosomal Protein L21 appeared in fractions collected from Traps 13 and 14. The close match between the possible protein masses and the overlapping appearance of tryptic peptides made it difficult to conclusively identify the unknown mass.
In order to determine whether the 17872.8 Da observed mass corresponded to S7 or L21 it was necessary to apply CPY/CPP C-terminal sequence tagging methodology. The predicted C-terminal sequence of S7 is SHYRW and that of L21 is EEGEA. CPY/CPP analysis of the appropriate trap contents yielded C-terminal residues of R-W (Supplemental Figure 2). This indicated that the 17872.8 Da protein mass corresponded to S7 and not L21. The C-terminal sequence analysis together with the extensive sequence coverage (70%) obtained from tryptic peptide analysis afforded definitive identification for ribosomal protein S7. Further inspection of protein mass spectra from Trap 13 revealed a low intensity, irregularly occurring signal with a deconvoluted mass of 17858.5 Da. This was assigned to unmodified L21 (Supplemental Figure 3).
Ribosomal Protein S21
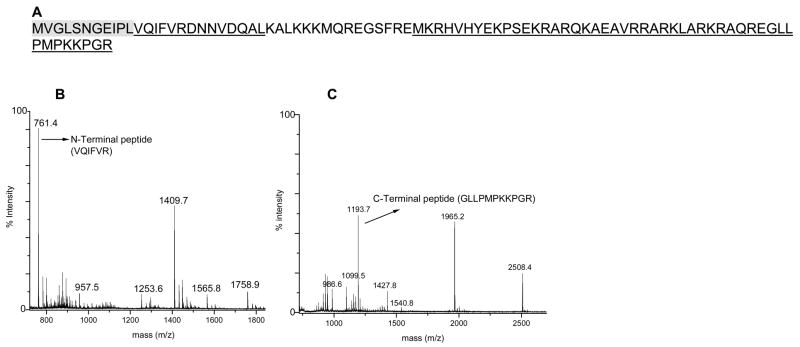
Whole protein spectra did not contain peaks matching S21’s predicted mass of 10174.0 Da. Instead, an intense, recurring whole protein mass at 9062.4 Da was observed in Trap 18 (Supplemental Figure 4). Removal of residues 1–11 (MVGLSNGEIPL) from the translated sequence of S21 gave a theoretical mass of 9062.9. Tryptic digest experiments on the fractions collected from Trap 18 indicated the presence of peptides corresponding to S21 (44% sequence coverage in MALDI experiments).
In order to confirm the identification of S21, proteins collected by Trap 18 were subjected to CPY/CPP treatment. S21 has a C-terminal sequence of PMPKKPGR. CPY/CPP digestion of the protein resulted in the truncation of the arginine residue. Unfortunately, the slow hydrolysis through glycine and proline residues present in the adjacent positions, respectively, prevented further degradation of the protein and no sequence information could be obtained.62–65 For unambiguous identification, pure S21 was isolated using 1D-RPLC fractionation of the acetic acid/MgCl2 supernatant and subjected to trypsin and Glu-C digestion. The peptides were analyzed by MALDI-TOF MS. The combined data from the two mass mapping experiments allowed us to identify the protein as S21 with matched peptides providing 82% sequence coverage (Figure 11A). As expected, there were no peptides corresponding to the first 11 amino acid residues, MVGLSNGEIPL (shaded in gray in Figure 11). Furthermore, the appearance of a peptide at mass 761.4 Da, matching an N-terminal sequence of VQIFVR (residues 12–17 of the predicted sequence) and a peptide at mass 1193.7 Da, matching the predicted C-terminal peptide (GLLPMPKKPGR) supported our hypothesis that the residues were absent from the N-terminus of the protein. The correlation of the data from whole protein analysis, peptide mass mapping, and C-terminal sequencing experiments unequivocally confirms that the 9062.6 Da mass occurring in trap 18 represents the N-terminally truncated product of S21. Possible explanations for the truncation of residues from the N-terminus are, as with L3, either proteolytic cleavage or an error in the reported genome sequence.
Small Proteins from the Large Subunit
The small proteins from the 50S subunit, L30 through L36, were expected to present a challenge for identification because of the high fraction of K and R residues in their sequences (14% K+R in L32, up to 41% in L34 – the average K+R percentage in proteins is 11%).66 The use of C-terminal sequencing with CPY/CPP was invaluable in the identification of these proteins, especially ribosomal protein L34. The C-terminal sequence of L34 is VARRRAKRKRLTA. As shown in Figure 12, digestion with CPY/CPP mixture resulted in sequential loss of up to 14 amino acid residues. The data obtained by CPY/CPP digestion were consistent with the translated sequence. This amounts to 32% sequence coverage by CPY/CPP analysis, and an unambiguous confirmation. Our identifications of ribosomal proteins L31, L32, L33 and L35 were also were also confirmed by determining their C-terminal sequences (Table 3).
Table 3.
C-Terminal Sequence Analysis of Ribosomal Proteins from CPY/CPP digest experiments
| Protein | C-Terminal Sequencea |
|---|---|
| L11 | (KI)VEA |
| L27 | A |
| L31 | RVS(RF)(NA)(KF)(AG)(FTG)KKA |
| L32 | KQI(LTPK)ED |
| L33 | E(FRE)(GK)IK |
| L34 | VARRRA(KG)RKRLTA |
| L35 | A(KI)IRT(YLP)YGL |
| S7 | RW |
| S21 | R |
The residues in parentheses indicate that the sequence order of the enclosed amino acids could not be determined.
Discussion
Whole Protein Masses
The strategy for protein identification presented here is a pragmatic hybrid of “top down” and “bottom up” proteomic approaches.7,8,67 Identifications based simply on protein masses are tentative, but because the ribosomal proteins comprise a distinct subcellular fraction of highly conserved proteins with a limited number of post-translational modifications, these tentative identifications provide a solid foundation to complete the characterization of the proteome using bottom up tactics involving peptide analysis. With this strategy, all but one of the ribosomal proteins of C. crescentus were identified. Several other studies in which protein identifications based on whole protein mass measurements corroborated by sequence-based data have appeared recently. The ribosomal proteome of the α-proteobacterium Rhodopseudomonas palustris has been characterized using parallel LC-ESI-FTICR MS of whole proteins and LC-ESI- IT MS-MS of tryptic digests.9 The two-dimensional fractionation of the whole proteins prior to protein or peptide analysis allows the tryptic digest peptides obtained from a trap or trap fractions to be directly associated with a protein mass, increasing the confidence of an assignment. The collocation of proteins with peptides also allows smaller sets of LC-MS-MS data to be searched by SEQUEST or MASCOT for peptides containing post-translational modifications. The use of sequence homologies between T. thermophilus HB27 and HB8, and T. thermophilus IB-21 for which no genome sequence exists, to identify proteins observed in MALDI MS spectra presents an alternative strategy to corroborate top-down measurements.10 Confirming assigned identities by sequence homology between strains of the same species fulfills the same role as bottom-up identifications techniques, and streamlines the process of identification..
Special Cases and Notable Proteins
The three most dramatic discrepancies between the translated ribosomal proteome of Caulobacter crescentus and our observed protein masses are the absence of 13 and 11 residues at the N-termini of ribosomal proteins L3 and S21, and the truncation of the C-terminus of L27 by a single glutamate residue. Although proteolytic cleavage of ribosomal proteins has been observed in E. coli, the lack of extensive random proteolysis in our samples argues against damage during purification.38,68 In each of these cases, the simplest explanation of the difference between the predicted and observed protein masses is an error in the interpretation of genome sequencing data. The first codon of L3’s gene (ORF CC1248) is the non-standard start codon TTG. Thirty-six nucleotides downstream is an ATG codon. If the latter position were the correct translational start site, the predicted protein sequence would be twelve amino acids short, and N-terminal methionine aminopeptidase action would result in a protein with a mass (26666.4 Da) within experimental error of the observed mass of L3 (26666.7 Da). Examination of S21’s gene (ORF CC3297) shows a CTG codon thirty nucleotides downstream of the proposed TTG start codon. Assuming that the C residue at position 31 is in error and that it should be an A, the predicted protein sequence would be ten amino acids shorter than the currently predicted sequence. Methionine removal from the resulting protein would generate a protein with a predicted mass of 9062.9 Da, nearly identical to the observed value of 9062.9 Da. Only two of C. crescentus’s ribosomal proteins use TTG as a start codon: L3 is one of these proteins and S21 is the other. TTG is the initiator codon for 3% of E. coli’s genes (and only one ribosomal protein gene, S20). Although there are no corresponding statistics for C. crescentus, these observations support the proposed errors in the interpretation of the genome sequencing data.69,70 Ribosomal protein L27’s gene (ORF CC0318) is terminated by the sequence GCC GAG TAA, coding for A-E-(Stop). Although TAA is the stop codon most frequently used by bacteria, assuming that the G in the first position of penultimate codon is in error, and that this codon should be UAG results in a predicted sequence terminated by an alanine and a predicted mass of 9110.4 Da, comparable to the 9111.2 Da we have observed.71
Chromatography
An alternative means of summarizing data from a twenty trap experiment is presented in Supplemental Figure 5. Band broadening, especially in the ion exchange dimension (horizontal) is a commonly observed phenomenon in chromatographic separations of ribosomal proteins. Despite the strongly denaturing conditions used in the ion-exchange dimension, some ribosomal proteins have enough ordered structure to interact heterogeneously with the chromatographic stationary phase or to interact reversibly with each other.72–74 The most notable example of this behavior is seen with ribosomal protein L7/L12, which presents a broad horizontal smear, starting in Trap 4 with a secondary peak associated with the elution of ribosomal protein L10 in Trap 10. Similar interactions and co-elution of proteins from E. coli ribosomes was observed by Diederich in a similar ion exchange chromatography system.73
Band broadening in whole protein chromatography due to heterogeneous protein binding is a well-recognized problem, and there are three commonly applied tactics to minimize the effects: increasing flow rates, increasing temperature, and the addition of organic solvents to the mobile phase.75–78 The modular nature of our system would allow the addition of a thermocouple controlled heater to the ion exchange column. Inclusion of organic solvent in the ion exchange mobile phase also holds out the possibility of a modest increase in the capacity in this dimension and increased recovery of protein from the column.79 These strategies will be explored in future work.
Comparison of Different Peptide Mapping Procedures
On the average, the LC-MS and MALDI tryptic peptide experiments each yield about 50% sequence coverage; the capillary chromatography derived results have a broader range (80% to 19%, average 47%) than the MALDI experiments (76% to 23%, average 54%) but the results are more rapidly obtained and experiments require less sample handling, no derivatization and no sample clean up. The portions of each protein’s sequence covered by each technique do not overlap exactly. Taken together, there is an average of 62% sequence coverage for each protein. The MALDI experiments, specifically those analyzed using PRODIGIES two-file comparisons, provide less ambiguous results.26
Summary and Conclusions
A combined top down/bottom up approach allows fast identification of proteins in a mixture. A key step in this strategy is the separation of whole proteins on a two-dimensional LC system using strong cation exchange chromatography as the first dimension and reversed phase chromatography as the second dimension.28,80 The second dimension of chromatography is developed from “trap” columns that retain proteins eluted from the ion exchange dimension, concentrating them and allowing solvent exchange without the losses inherent in fraction collection and off-line sample handling. All of the commonly observed proteins of a eubacterial ribosomal proteome have been observed in samples obtained from Caulobacter crescentus. The extensive methylation (or acetylation) of L11 and the absence of β-thiomethylation of S12 are intriguing exceptions to the growing body of knowledge on ribosomal protein post-translational modifications. We are currently exploring both changes in the complement of post-translational modifications of C. crescentus ribosomal proteins as a function of growth conditions and the distribution of modifications to ribosomal proteins across a number of bacterial phyla.
Supplementary Material
Figure 9.
(A) Sequence coverage map of N-terminally truncated S21. Underlined residues indicate the peptide masses observed. The shaded sequence is the absent N-terminal undecapeptide (see text for discussion). (B) MALDI spectrum of ribosomal protein S21 tryptic digest. (C) MALDI spectrum of ribosomal protein S21 Glu-C digest.
Figure 10.
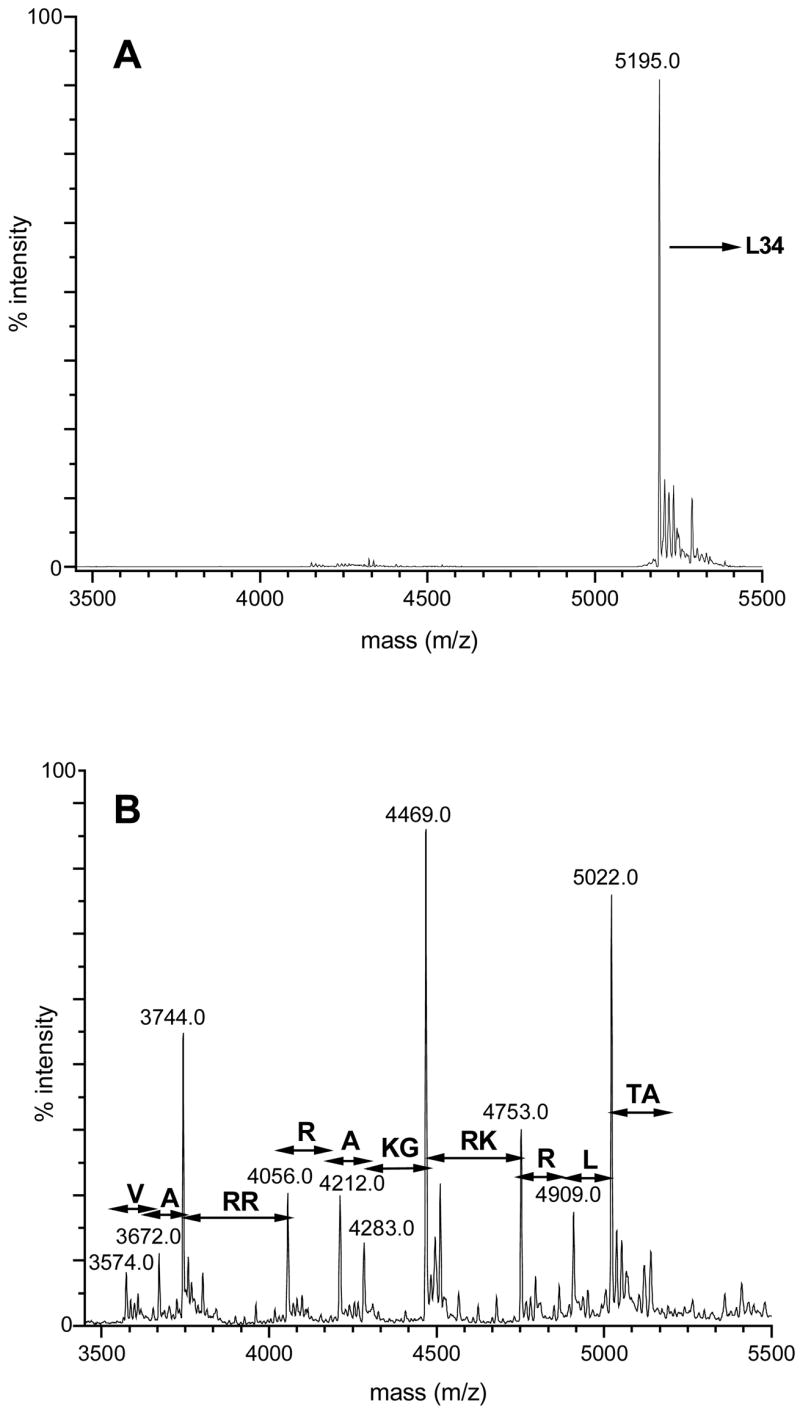
Deconvoluted mass spectra of ribosomal protein L34. (A) Before CPY/CPP digestion. (B) Following 10 seconds of CPY/CPP digestion.
Acknowledgments
We would like to thank Professor Yves Brun and Ellen Quardokus for the gift of Caulobacter crescentus CB15N cultures and information on this organism’s growth and Dr. Ignatius J. Kass of Waters Corporation for AutoME 1.1. This research was supported by NIH Grant RR018942-01A2 and the Indiana Metacyte Initiative
References
- 1.Wittman AG. Ann Rev Biochem. 1982;51:155–183. doi: 10.1146/annurev.bi.51.070182.001103. [DOI] [PubMed] [Google Scholar]
- 2.Bremer H, Dennis PB. In: Escherichia coli and Salmonella: Cellular and Molecular Biology. 2. Neidhardt FC, et al., editors. American Society for Microbiology; Washington, DC: 1996. pp. 1553–1564. [Google Scholar]
- 3.Keener J, Nomura M. In: Escherichia coli and Salmonella typhimurium: Cellular and Molecular Biology. 2. Neidhardt FC, et al., editors. American Society for Microbiology; Washington, DC: 1996. pp. 1417–1431. [Google Scholar]
- 4.Neidhardt FC, Ingraham JL, Schaecter M. Physiology of the Bacterial Cell: A Molecular Approach. Sinauer Associates, Inc; Sunderland, MA: 1990. [Google Scholar]
- 5.Spedding G. In: Ribosomes and Protein Synthesis: A Practical Approach. Rickwood D, Hames BD, editors. Oxford Press; New York: 1990. pp. 1–29. [Google Scholar]
- 6.O’Farrell PH. J Biol Chem. 1975;250(10):4007–4021. [PMC free article] [PubMed] [Google Scholar]
- 7.Link AJ, Eng J, Schietz DM, Carmack E, Mize GJ, Morris DR, Garvick BM, Yates JR., III Nature Biotechnol. 1999;17:676–682. doi: 10.1038/10890. [DOI] [PubMed] [Google Scholar]
- 8.Washburn MP, Wolters D, Yates JR., III Nature Biotechnol. 2001;19(3):242–247. doi: 10.1038/85686. [DOI] [PubMed] [Google Scholar]
- 9.Strader MB, VerBerkmoes NC, Tabb DL, Connelly HM, Barton JW, Bruce BD, Pelletier DA, Davison BH, Hettich RL, Larimer FW, Hurst GB. J Proteome Res. 2004;3:965–978. doi: 10.1021/pr049940z. [DOI] [PubMed] [Google Scholar]
- 10.Suh MJ, Hamburg DM, Gregory ST, Dahlberg AE, Limbach PA. Proteomics. 2005;5:4818–4831. doi: 10.1002/pmic.200402111. [DOI] [PMC free article] [PubMed] [Google Scholar]
- 11.Moore PB, Steitz TA. Annu Rev Biochem. 2003;73:813–850. doi: 10.1146/annurev.biochem.72.110601.135450. [DOI] [PubMed] [Google Scholar]
- 12.Harms J, Schleunzen F, Zarovach R, Bashan A, Gat S, Agmon I, Bartels H, Fransechi F, Yonath A. Cell. 2001;107:679–688. doi: 10.1016/s0092-8674(01)00546-3. [DOI] [PubMed] [Google Scholar]
- 13.Wimberly BT, Brodessen DE, Clemmons WM, Jr, Morgan-Warren RJ, Carter AP, Vonrhein C, Hartsch T, Ramakrishnan V. Nature. 2000;407:327–339. doi: 10.1038/35030006. [DOI] [PubMed] [Google Scholar]
- 14.Schleunzen F, Tocily A, Zaravach R, Harms J, Gluehmann M, Janell D, Bashan A, Bartels H, Agmon I, Fransechi F, Yonath A. Cell. 2000;102:615–623. doi: 10.1016/s0092-8674(00)00084-2. [DOI] [PubMed] [Google Scholar]
- 15.Yusupov MM, Yusupova GZ, Baucom A, Lieberman K, Earnest TN, Cate JHD, Noller HF. Science. 2001;292:883–896. doi: 10.1126/science.1060089. [DOI] [PubMed] [Google Scholar]
- 16.Schuwerth BS, Borovinskaya MA, Hau CW, Zhang W, Vila-Sanjuzo A, Holton JM, Cate JHD. Science. 2005;310:827–834. doi: 10.1126/science.1117230. [DOI] [PubMed] [Google Scholar]
- 17.Brodersen DE, Nissen P. FEBS Journal. 2005;272:2098–2108. doi: 10.1111/j.1742-4658.2005.04651.x. [DOI] [PubMed] [Google Scholar]
- 18.Wilson DN, Nierhaus KH. Crit Rev Biochem Mol Biol. 2005;40:243–267. doi: 10.1080/10409230500256523. [DOI] [PubMed] [Google Scholar]
- 19.Woese C. Proc Natl Acad Sci USA. 1998;95:6854–6859. doi: 10.1073/pnas.95.12.6854. [DOI] [PMC free article] [PubMed] [Google Scholar]
- 20.Woese C. Proc Natl Acad Sci USA. 2002;99:8742–8747. doi: 10.1073/pnas.132266999. [DOI] [PMC free article] [PubMed] [Google Scholar]
- 21.Walsh C. Antibiotics: Actions, Origins, Resistance. ASM Press; Washington, DC: 2003. [Google Scholar]
- 22.Slee AM, Wuonola MA, McRipley RJ, Zajac I, Zawada MJ, Bartholomew PT, Gregory WA, Forbes M. Antomicrob Agents Chemother. 1987;31:1791–1797. doi: 10.1128/aac.31.11.1791. [DOI] [PMC free article] [PubMed] [Google Scholar]
- 23.Livermore DJ. Antimicrob Chemotherap. 2003;51(Suppl S2):ii9–ii16. doi: 10.1093/jac/dkg249. [DOI] [PubMed] [Google Scholar]
- 24.Abbot A. Nature. 2005;436:758. doi: 10.1038/436170a. [DOI] [PubMed] [Google Scholar]
- 25.Karty JA, Ireland MME, Brun YV, Reilly JP. J Proteome Res. 2002;1:325–335. doi: 10.1021/pr025518b. [DOI] [PubMed] [Google Scholar]
- 26.Karty JA, Ireland MME, Brun YV, Reilly JP. J Chromatogr B. 2002;782:363–383. doi: 10.1016/s1570-0232(02)00550-0. [DOI] [PubMed] [Google Scholar]
- 27.Ireland MME, Karty JA, Quardokus EM, Reilly JP, Brun YV. Mol Microbiol. 2002;45:1029–1041. doi: 10.1046/j.1365-2958.2002.03071.x. [DOI] [PubMed] [Google Scholar]
- 28.Karty JA, Reilly JP. J Chromat B. in press. [Google Scholar]
- 29.Emelyanov VV. FEBS Lett. 2001;501:11–18. doi: 10.1016/s0014-5793(01)02618-7. [DOI] [PubMed] [Google Scholar]
- 30.Thiede B, Wittmann-Liebold B, Bienert M, Krause E. FEBS Lett. 1995;357:65–69. doi: 10.1016/0014-5793(94)01323-s. [DOI] [PubMed] [Google Scholar]
- 31.Bonetto V, Bergman AC, Joernvall H, Sillard R. Anal Chem. 1997;69:1315–1319. doi: 10.1021/ac960896j. [DOI] [PubMed] [Google Scholar]
- 32.Rosnack KJ, Stroh JG. Rapid Commun Mass Spectrom. 1992;6:637–640. doi: 10.1002/rcm.1290061102. [DOI] [PubMed] [Google Scholar]
- 33.Nguyen DN, Becker GW, Riggin RM. J Chromat A. 1995;705:21–45. doi: 10.1016/0021-9673(94)01256-e. [DOI] [PubMed] [Google Scholar]
- 34.Patterson DH, Tarr GE, Regnier FE, Martin SA. Anal Chem. 1995;67:3971–3978. doi: 10.1021/ac00117a024. [DOI] [PubMed] [Google Scholar]
- 35.Nierman WC, Feldblyum TV, Laub MT, et al. Proc Natl Acad Sci USA. 2001;98:4136–4141. doi: 10.1073/pnas.061029298. [DOI] [PMC free article] [PubMed] [Google Scholar]
- 36.Boeckmann B, Bairoch A, Apweiler R, Blatter MC, Estreicher A, Gasteiger E, Martin MJ, Michoud K, O’Donovan C, Phan I, Pilbout S, Schneider M. Nucleic Acids Res. 2003;31:365–370. doi: 10.1093/nar/gkg095. [DOI] [PMC free article] [PubMed] [Google Scholar]
- 37.Tatusova TA, Madden TL. FEMS Microbiol Lett. 1999;174:247–250. doi: 10.1111/j.1574-6968.1999.tb13575.x. [DOI] [PubMed] [Google Scholar]
- 38.Arnold RJ, Reilly JP. Anal Biochem. 1999;269:105–112. doi: 10.1006/abio.1998.3077. [DOI] [PubMed] [Google Scholar]
- 39.Read SM, Northcoate DH. Anal Biochem. 1981;116:53–64. doi: 10.1016/0003-2697(81)90321-3. [DOI] [PubMed] [Google Scholar]
- 40.Hardy SJS, Kurland CG, Voynow P, More G. Biochemistry. 1969;8:2897–2905. doi: 10.1021/bi00835a031. [DOI] [PubMed] [Google Scholar]
- 41.Eng JK, McCormack AL, Yates JR., III J Am Soc Mass Spectrom. 1994;5:976–989. doi: 10.1016/1044-0305(94)80016-2. [DOI] [PubMed] [Google Scholar]
- 42.Yates JR, III, Eng JK, McCormack AL, Schieltz D. Anal Chem. 1995;67:1426–1436. doi: 10.1021/ac00104a020. [DOI] [PubMed] [Google Scholar]
- 43.Beardsley RL, Reilly JP. Anal Chem. 2002;74:1884–1890. doi: 10.1021/ac015613o. [DOI] [PubMed] [Google Scholar]
- 44.Pappen DJC, Hoyrup P, Bleasby AJ. Curr Biol. 1993;3:327–332. doi: 10.1016/0960-9822(93)90195-t. [DOI] [PubMed] [Google Scholar]
- 45.Arnold RJ, Karty JA, Ellington AD, Reilly JP. Anal Chem. 1999;71:1990–1996. doi: 10.1021/ac981196c. [DOI] [PubMed] [Google Scholar]
- 46.Hirel PH, Schmitter JM, Dessen P, Fayat G, Blanquet S. Proc Natl Acad Sci USA. 1989;86:8247–8251. doi: 10.1073/pnas.86.21.8247. [DOI] [PMC free article] [PubMed] [Google Scholar]
- 47.Dalbøge H, Bayne S, Pedersen J. FEBS Lett. 1990;266:1–3. doi: 10.1016/0014-5793(90)90001-b. [DOI] [PubMed] [Google Scholar]
- 48.Kowalak JA, Walsh KA. Protein Sci. 1996;5:1625–1632. doi: 10.1002/pro.5560050816. [DOI] [PMC free article] [PubMed] [Google Scholar]
- 49.Subramanian AR. Prog Nucleic Acids Res Mol Biol. 1983;28:101–142. doi: 10.1016/s0079-6603(08)60085-9. [DOI] [PubMed] [Google Scholar]
- 50.Kalapos MP, Paulus H, Sarkar N. Biochimie. 1997;79:493–502. doi: 10.1016/s0300-9084(97)82741-1. [DOI] [PubMed] [Google Scholar]
- 51.Deusser E, Weber HJ, Subramanian AR. J Mol Biol. 1974;84:249–256. doi: 10.1016/0022-2836(74)90583-x. [DOI] [PubMed] [Google Scholar]
- 52.Alix JH. Adv Exper Biol Med. 1988;231:371–385. doi: 10.1007/978-1-4684-9042-8_30. [DOI] [PubMed] [Google Scholar]
- 53.Muranova TA, Muranov AV, Markova LF, Ovchinnikov YA. FEBS Lett. 1978;96:301–305. doi: 10.1016/0014-5793(78)80423-2. [DOI] [PubMed] [Google Scholar]
- 54.Dognin MJ, Wittman-Liebold B. Eur J Biochem. 1980;112:131–151. doi: 10.1111/j.1432-1033.1980.tb04995.x. [DOI] [PubMed] [Google Scholar]
- 55.Triantafillidou D, Simitsopoulou M, Franceschi F, Choli-Papadopoulou T. J Protein Chem. 1999;18:215–223. doi: 10.1023/a:1020684224200. [DOI] [PubMed] [Google Scholar]
- 56.Cameron DM, Gregory ST, Thompson J, Suh MJ, Limbach PA, Dahlberg AE. J Bacteriol. 2004;186:5819–5825. doi: 10.1128/JB.186.17.5819-5825.2004. [DOI] [PMC free article] [PubMed] [Google Scholar]
- 57.Beardsley RL, Reilly JP. J Proteome Res. in press. [Google Scholar]
- 58.Running WE, Reilly JP. Poster Abstract TP32-585. Proceedings of the 54th ASMS Conference on Mass Spectrometry and Allied Topics; Seattle WA. May 28-June 1, 2006. [Google Scholar]
- 59.Wahl MC, Moller W. Curr Protein Peptide Sci. 2002;3:93–106. doi: 10.2174/1389203023380756. [DOI] [PubMed] [Google Scholar]
- 60.Deusser E. Mol Gen Genet. 1972;119:249–258. doi: 10.1007/BF00333862. [DOI] [PubMed] [Google Scholar]
- 61.Chang FN. J Bacteriol. 1978;135:1165–1166. doi: 10.1128/jb.135.3.1165-1166.1978. [DOI] [PMC free article] [PubMed] [Google Scholar]
- 62.Lu SH, Klein ML, Lai PH. J Chromat. 1988;447:351–364. [PubMed] [Google Scholar]
- 63.Yokoyama S, Oobayashi A, Tanabe O, Ichishima E. Biochim Biophys Acta. 1975;397:443–448. doi: 10.1016/0005-2744(75)90134-5. [DOI] [PubMed] [Google Scholar]
- 64.Hayashi R, Bai Y, Tadao H. J Biochem. 1975;77:69–79. [PubMed] [Google Scholar]
- 65.Hayashi R. Methods Enzymol. 1976;45:568–587. doi: 10.1016/s0076-6879(76)45051-6. [DOI] [PubMed] [Google Scholar]
- 66.Creighton TE. Proteins: Structures and Molecular Properties. 2. W. H. Freeman; New York: 1993. [Google Scholar]
- 67.Kelleher NL, Lin HY, Valaskovic GA, Aaserud DJ, Fridriksson EK, McLafferty FW. J Am Chem Soc. 1999;121:806–812. [Google Scholar]
- 68.Wada A. Genes Cells. 1998;3:203–208. doi: 10.1046/j.1365-2443.1998.00187.x. [DOI] [PubMed] [Google Scholar]
- 69.Blattner FR, Plunkett G, III, Bloch CA, et al. Science. 1997;277:1453–1462. doi: 10.1126/science.277.5331.1453. [DOI] [PubMed] [Google Scholar]
- 70.Stenstrom CM, Holmgren E, Isaksson LA. Gene. 2001;273:259–265. doi: 10.1016/s0378-1119(01)00584-4. [DOI] [PubMed] [Google Scholar]
- 71.Sharp PM, Bulmer P. Gene. 1988;63:141–145. doi: 10.1016/0378-1119(88)90553-7. [DOI] [PubMed] [Google Scholar]
- 72.Kamp RM, Bosserhoff A, Kamp D, Wittman-Liebold B. J Chromatogr. 1984;317:181–192. doi: 10.1016/s0021-9673(01)91658-9. [DOI] [PubMed] [Google Scholar]
- 73.Diedrich G, Burkhardt N, Nierhaus KH. Protein Exp Purif. 1997;10:42–50. doi: 10.1006/prep.1996.0702. [DOI] [PubMed] [Google Scholar]
- 74.Dijk J, Littlechild J. Methods Enzymol. 1979;59:481–502. doi: 10.1016/0076-6879(79)59109-5. [DOI] [PubMed] [Google Scholar]
- 75.Parente ES, Wetlaufer DB. J Chromatogr. 1984;314:337–347. doi: 10.1016/s0021-9673(01)97747-7. [DOI] [PubMed] [Google Scholar]
- 76.Liu H, Berger SJ, Chakraborty AB, Plumb RS, Cohen SA. J Chromatogr B. 2002;782:267–289. doi: 10.1016/s1570-0232(02)00554-8. [DOI] [PubMed] [Google Scholar]
- 77.Cohen SA, Benedek K, Tapuhi Y, Ford JC, Karger BL. Anal Biochem. 1985;144:275–284. doi: 10.1016/0003-2697(85)90117-4. [DOI] [PubMed] [Google Scholar]
- 78.Fang F, Aguilar MI, Hearn MTW. J Chromatogr A. 1996;729:67–79. doi: 10.1016/0021-9673(96)00008-8. [DOI] [PubMed] [Google Scholar]
- 79.Pantazak A, Baron MH, Revault M, Vidal-Medjar C. J Colloid Interface Sci. 1998;207:324–331. doi: 10.1006/jcis.1998.5782. [DOI] [PubMed] [Google Scholar]
- 80.Chong BE, Yan F, Lubman DM, Miller FR. Rapid Commun Mass Spectrom. 2001;15:291–296. doi: 10.1002/rcm.227. [DOI] [PubMed] [Google Scholar]
Associated Data
This section collects any data citations, data availability statements, or supplementary materials included in this article.


