Abstract
The alveolated structure of the pulmonary acinus plays a vital role in gas exchange function. Three-dimensional (3D) analysis of the parenchymal region is fundamental to understanding this structure-function relationship, but only a limited number of attempts have been conducted in the past because of technical limitations. In this study, we developed a new image processing methodology based on finite element (FE) analysis for accurate 3D structural reconstruction of the gas exchange regions of the lung. Stereologically well characterized rat lung samples (Pediatr Res 53: 72–80, 2003) were imaged using high-resolution synchrotron radiation-based X-ray tomographic microscopy. A stack of 1,024 images (each slice: 1024 × 1024 pixels) with resolution of 1.4 μm3 per voxel were generated. For the development of FE algorithm, regions of interest (ROI), containing ∼7.5 million voxels, were further extracted as a working subunit. 3D FEs were created overlaying the voxel map using a grid-based hexahedral algorithm. A proper threshold value for appropriate segmentation was iteratively determined to match the calculated volume density of tissue to the stereologically determined value (Pediatr Res 53: 72–80, 2003). The resulting 3D FEs are ready to be used for 3D structural analysis as well as for subsequent FE computational analyses like fluid dynamics and skeletonization.
Keywords: alveolated duct, model, structure, morphometry, morphology
the mammalian interthoracic respiratory tract can be divided into two areas: conducting airways and pulmonary parenchyma (i.e., the gas exchange region of the lung). The conducting airways are a bifurcating network of relatively well-defined conduits carrying the ambient air to the parenchyma. Airways within the parenchyma—customarily called acinar/alveolar ducts—on the other hand, are not pipelike; they are formed by entrance rings of alveoli opening into a common passageway. Currently, enormous efforts (e.g., 1, 9–11, 13, 15, 31, 33, 47, 54, 61, 64) are devoted to reconstructing the conducting airway network in three dimensions (3D), facilitated by rapid advancement of imaging technologies [e.g., micro-computed tomography (μCT), hyperpolarized-gas magnetic resonance imaging (HHe-3 MRI), etc.], as well as a rapid increases in computing power.
In contrast to conducting airways, lung parenchyma is harder to access; the structures are physically small and located distally in the respiratory tract. Basic structures of lung parenchyma are highly complex; this complexity can be easily envisioned by the fact that the enormously large surface area of lung parenchyma, as large as that of a tennis court in the case of human lungs (17, 66), for example, has to be folded in within the lung cavity. At the same time, the image resolution required to obtain reasonable details of this complexity is on the order of a few micrometers [considering, for instance, the thickness of alveolar septa (inter-air space septa) of roughly 10 μm (17; P. Gehr, personal communication)]. This required resolution is much finer than the resolution of commonly available MRI or even μCT mentioned above, but can be obtained with synchrotron radiation-based X-ray tomographic microscopy (SRXTM).
Despite these difficulties, the motivations for reconstructing the 3D geometry of the respiratory region of the lung are numerous. Two-dimensional (2D) sections of lung parenchyma are insufficient for many purposes and can produce erroneous models of lung structure (12). For instance, 3D structural rendering is crucial to the study of micromechanics in 3D acinar microarchitecture, particularly given the likelihood of heterogeneous behavior with ventilation. Only by using a realistic 3D structure (for example, of alveolar shape and orientation of the alveolar opening with respect to the central thoroughfare acinar channel) can the qualitative and quantitative effects of 3D acinar geometry on gas and aerosol transport be determined. Despite the necessity of accurate 3D structural renderings of the gas exchange regions of the lung, there have been only a handful of attempts in the past (e.g., 5, 12, 25, 34, 37, 38, 43, 57, 65), mainly because formidable effort was required using traditional specimen preparation and imaging techniques.
Here we present our new effort at 3D reconstruction of the acinar air space in fixed lung tissue using the novel technology of SRXTM and subsequent 3D modeling of the obtained images. Because of the large specimen volume that can be imaged at high resolution using this method, we anticipate that it will ultimately allow 3D reconstruction of the entire air space of one acinus. Such a detailed rendering and consequent 3D quantitative analysis of structural measures of acinar morphology will prove invaluable to many studies, including performing the computational fluid dynamics of aerosol deposition in the gas exchanging areas of the lung. In this paper, we demonstrate the ability of SRXTM to render greater volumes (109 μm3) of lung tissue than is possible by confocal microscopy and to achieve greater resolution (voxel size = 1.4 μm3) than possible by traditional μCT. We describe state-of-the-art finite element (FE) technology for 3D reconstruction of both tissue and air spaces in the acinus in detail; the outcome would be ready for subsequent FE computational analyses like fluid dynamics and skeletonization.
MATERIALS AND METHODS
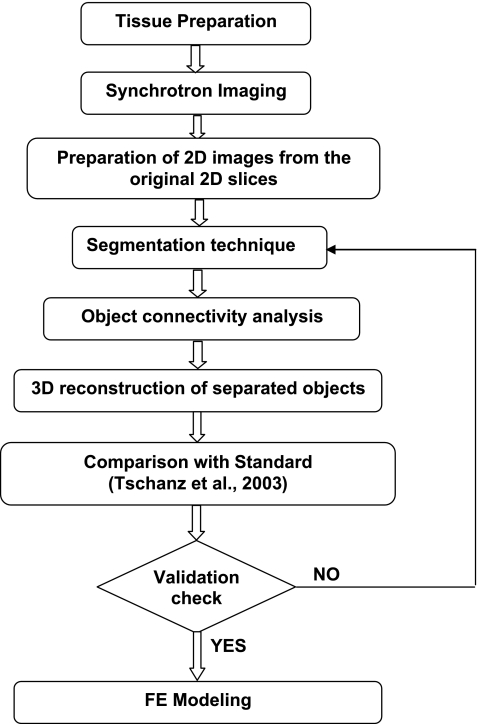
The experimental protocol for high-resolution 3D reconstruction of the rat acinus may be categorized into the following three components: tissue preparation, SRXTM, and image processing (Fig. 1). The first two components have been previously described in detail elsewhere (49, 50, 59, 62), and thus are only recapitulated briefly here. The emphasis of the present work is on the third component; the experimental methods are described in detail below.
Fig. 1.
Workflow diagram outlining protocol for high-resolution 3-dimensional (3D) reconstruction of the acinus.
Animal Handling and Tissue Preparation
Because our main aim in this study is development of new image processing methodology to reconstruct rat acinar structure in 3D, we used existing glutaraldehyde-fixed lung tissue samples of 60-day-old Sprague-Dawley rats (Zurich strain) (62). The individual lung lobes were separated and their volumes were determined by fluid displacement (48). Tschanz et al. (62) provide a comprehensive morphometric characterization of these fixed lungs; we use these data as a “gold standard.”
The left lung lobes were cut into 2 × 2 × 2 mm pieces, postfixed with 1% osmium tetroxide (OsO4) in 0.1 M sodium cacodylate (pH 7.4, 340 mosmol/kgH2O), stained en bloc with 0.5% uranyl acetate (C4H6O6U) in 0.05 M maleate buffer, dehydrated in a graded series of ethanol, and embedded in Epon 812. Note that fixation, dehydration, and embedding of the tissue likely contributed some shrinkage artifact. As in electron microscopy, osmium tetroxide and uranyl acetate were used for heavy metal staining of the tissue. Osmium tetroxide and uranyl acetate have a higher absorption than the unstained lung tissue. The higher contrast facilitates the imaging of the samples at TOMCAT1 and subsequent image processing.
Handling of the animals before and during the experiments, as well as the experiments themselves, were approved and supervised by the Swiss Agency for the Environment, Forests and Landscape and the Veterinary Service of the Canton of Bern.
SRXTM
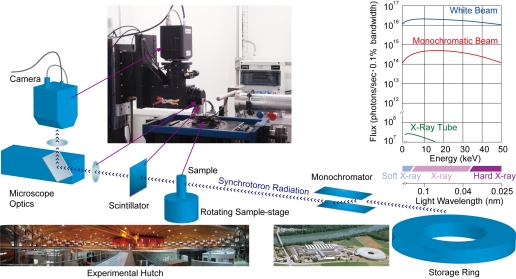
The Epon embedded samples were shaped down into rods of a diameter of 1.2 mm using a watchmaker's lathe. They were glued on a rodlike sample holder of a diameter of 3.0 mm using two-component epoxy resin-based glue (Araldite Rapid, Novartis, Basel, Switzerland). Special care was taken to ensure that the samples were mounted perpendicularly to the surface of the sample holder to fit exactly into the window of the camera (see Fig. 2 for imaging setup).
Fig. 2.
Imaging setup. The X-rays are coupled out of the storage ring via a wiggler. The monochromator is then used to select a desired wavelength of the incident X-rays. The sample is placed on a rotating sample holder inside the beam. While the X-rays penetrate the sample, the stage is rotated, and in total 1,500 projections over 180 degrees are recorded. Plot shows spectrum of TOMCAT (red and blue) compared with conventional X-ray tube (green).
Image acquisition.
The samples were scanned at an X-ray wavelength of 1 Å (corresponding to an energy of 12.398 keV2 ) at the beamline TOMCAT at the Swiss Light Source (SLS) of the Paul Scherrer Institut (Villigen, Switzerland) (58, 59). After penetration of the heavy metal stained sample, X-rays were converted into visible light by a thin Ce-doped YAG scintillator screen (Crismatec Saint-Gobain, Nemours, France). Projection images were further magnified by diffraction limited microscope optics and finally digitized by a high-resolution 2,048 × 2,048 pixel CCD camera. The ×10 lens was used, exposure time set to 200 ms, and 2 × 2 binning3 was selected to improve the signal-to-noise ratio, resulting in isotropic voxels of 1.4 μm3 for the reconstructed images.
To achieve a tomographic image for each sample, 1,500 projections were obtained over a sample rotation of 180°. The projections were then reconstructed on a 16-node server farm (Pentium 4, 2.8 GHz processor, 512 MB RAM) using an optimized filtered back projection algorithm. This reconstruction results in an image stack of 1,024 image slices in tif-format (a total size of 2 GB). This image stack is later on referred to as the “raw images.”
Image manipulation.
To facilitate detailed analysis for the development of 3D acinar reconstruction image processing, a cubic subregion of varying size was selected from the full dataset using the software Imaris (Bitplane, Zürich, Switzerland) installed on an Athlon 64 3500 based personal computer. Different subregions were chosen, typically representing a particular tissue structure, such as a cluster of alveoli without any large airways/branches, as well as a region without prominent ring artifacts. Ring artifacts represent an intrinsic problem of tomographic images and in our case are caused by very small particles trapped on the scintillator. They are usually limited to only some sections of the stack of images and are more prominent in the center of the sample. Before proceeding with the next step, we reduced the noise in some of the original 2D images and softened the image edges by using a Gaussian filter and/or a median filter with a 1 × 3 × 3 kernel.
Segmentation: thresholding and binarization.
To render our samples in three dimensions, we first segmented the raw data. Segmentation is the process of classifying the voxels of an image. Each voxel must represent either air space or tissue, thus, all the different gray values of the individual voxels are binarized into either 0 (air space) or 1 (lung tissue). Guided by the histogram of the gray scale values of the raw image (not shown), we selected an initial, tentative threshold value. Because the final selection of the threshold level is one of the most crucial steps in segmentation, special care has been taken to determine a correct threshold.
As indicated in Fig. 1, we determined the appropriate threshold level iteratively: 1) we set an initial threshold level and performed segmentation; 2) we sequentially performed the object-connectivity analysis and 3D reconstruction of objects (described below); 3) we calculated and compared morphological parameters, such as volume density of tissue and surface area density of air space to those given by Tschanz et al. (62); and 4) we readjusted/reset the threshold level based on the results of step 3 if necessary.
We performed this iterative process until the calculated morphological parameters closely matched the values of the gold standard (62).
Object connectivity analysis.
Depending on the threshold level selected, erroneous holes and isolated small areas/objects may appear in the segmented images. To avoid these artifacts and to maintain object connectivity, we needed to preprocess the segmented voxels. We first determined the number of isolated objects and their sizes in the ROI and then eliminated the objects below a reasonable size (∼5 pixels) by reclassifying voxel values (from “airway” to “tissue”, or vice versa). This object connectivity analysis (OCA) was performed by implementing label adjacent pixel analysis in 3D (2, 14, 18). For the sake of simplicity and clarity, we will explain this algorithm in 2D as follows.
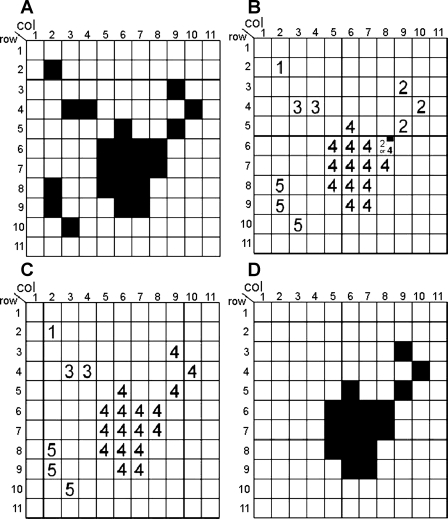
Let us assume that “black” and “white” pixels (voxels in a 3D case) are distributed as in the example shown in Fig. 3A. Scanning pixels from top to bottom and from left to right, we will examine the connectivity of each black pixel, by checking the colors (black or white) of its four adjacent pixels [a pixel on its left and three pixels on its top (top left, top middle, top right)]. We will assign a tentative object label number (OLN; consecutively, 1, 2, 3, 4…) to each black pixel and examine connections between identified objects. Four simple logical algorithms are involved.
) If all four adjacent pixels are white, assign a new OLN to the current black pixel. [For instance, we assign OLN = 1 to the pixel at (column 2; row 2); OLN = 2 to the pixel at (9, 3), etc. (Fig. 3B).]
) If only one of the adjacent pixels has already been assigned an OLN, assign the same OLN to the current black pixel. [For instance, we assign the OLN = 3 to the pixel at (4;4) because the adjacent pixel on the left of it (at 3;4) has already been assigned with OLN = 3 (Fig. 3B).]
) If more than one adjacent pixels have already been assigned an OLN and if those adjacent pixels have the same OLN, assign the same OLN to the current pixel. [For instance, we assign OLN = 4 to the pixel at (6;6) because the adjacent pixels at (5;6) and at (6;5) have already been assigned with an OLN = 4 (Fig. 3B).]
) If more than one adjacent pixel has already been assigned an OLN but if those adjacent pixels have different OLNs, assign one of the adjacent pixel's OLN and put a special marker (flag) on that pixel. The pixel with this flag will be re-examined in the next step. [For instance, we assign either OLN = 2 or 4 to the pixel at (8;6) because the adjacent pixels at (9;5) and at (7;6) have already been assigned with OLN = 2 and 4, respectively. Thus, the pixel is marked with a flag (Fig. 3B).]
Fig. 3.
Object connectivity analysis (OCA) shown in a 2-dimensional (2D) example. A: a binary distribution of “black” vs. “white” pixels at certain threshold level; B: object label number (OLN) is assigned for each black pixel on the basis of the color (black or white) of 4 adjacent pixels; C: on the basis of a “flag” pixel, connectivity is identified between OLN = 2 and OLN = 4; D: small objects less than cutoff (<4 pixels in this example) are removed.
After assigning OLNs to all the black pixels, we then re-examine the flagged pixels, which indicate that two or more “appeared-to-be separated” objects are indeed connected. We reassign the same OLN to all of the connected pixels leaving from the flagged pixel. For instance, we assigned OLN = 4 to the pixel at (8;6). This means that the pixels (9; 3), (10; 4) and (9; 5) are also assigned with the OLN = 4 (Fig. 3C). Finally, we remove small objects that are physically unreasonable in size (<5 pixels; Fig. 3D), suppressing noise and artifacts from the image acquisition.
3D reconstruction of separated objects.
Much of the currently available medical imaging software for 3D reconstruction treats objects (i.e., lung tissues in our case) as surfaces, and this is most often done by a triangulation of the voxel surface. However, to perform a complete 3D reconstruction, we use a different approach here; we reconstruct not only the surface of the boundary between the tissue and the air space, but also the volumes of tissues and air space by fitting FE to the raw voxel data and hence inside the full volume. For this, we use a grid-base hexahedral algorithm (GBHA) (52), which is explained as follows.
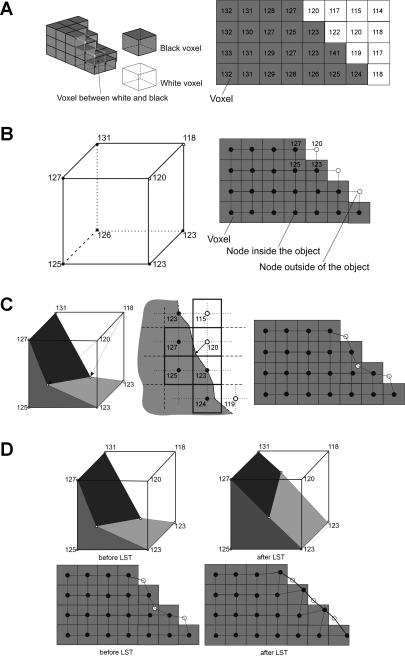
Let us consider an example in which we want to apply a threshold of 123 for the segmentation of our images. In Fig. 4A, at left the thresholded voxels in a 3D representation is shown and, for the sake of discussion and clarity, a 2D representation is shown at right.
Fig. 4.
Grid-based hexahedral algorithm A: 3D thresholded voxels (left) and 2D representation of thresholded voxels (right). The grayscale values are kept in the map of voxel. B: step 1: generation of uniform finite element (FE) mesh over the voxel map. For simplicity, FE nodes are positioned at the center of voxel. 3D FE meshing (left) and 2D FE meshing (right) are shown. Each node is assigned with the grayscale value from the corresponding voxel. C: step 2: moving nodes on the surface due to trilinear interpolation in 3D case (left) and bilinear interpolation in 2D case (right). The location of surface boundary is shown in the middle image for 2D case. A fast sub FE-voxel level algorithm is implemented to locate a surface boundary. White nodes are moving toward this surface boundary. D: step 3: Laplacian smoothing technique (LST). 3D and 2D before LST (left), 3D and 2D after LST (right).
1) MESH GENERATION.
A FE mesh (Fig. 4B), initially uniform, is isotropically generated over all pixels. We position the nodes of the FE mesh at the centers of the existing voxels (Fig. 4B, right). This means that each FE overlaps 2 × 2 voxels in the 2D case (Fig. 4B, right) or 2 × 2 × 2 voxels in the 3D case (Fig. 4B, left). The black circles represent nodes generated inside the object and the white circles denote nodes outside of the object. The nodes inside the object have a pixel or voxel value higher than the chosen threshold and the nodes outside the object have a value lower than the chosen threshold. Each FE node is assigned the grayscale value of the corresponding voxel. Note that the boundary between the black and white nodes is not smooth at this stage.
2) SURFACE SMOOTHING I.
Because the FE mesh is located on the surface boundary, some of its nodes (shown as the white circles) are on the outside of the object. Additionally, the grayscale pixel values of those white nodes are lower than the chosen threshold value. By using a simple linear interpolation, we move these white nodes in the direction of the surface boundary toward the locations where the grayscale pixel value would exactly match the threshold value. There are multiple methods available to move the nodes by linear interpolation. We adapted the method developed by Schneiders (52) for our 3D case. It is important to note that in some cases, this linear interpolation might even move the node inside the object (see Fig. 4C for examples).
3) SURFACE SMOOTHING II.
The translation of the nodes as described in step 2 may in some cases lead to a distorted (concave) FE surface. The distortion of the FE nodes can be evaluated with their Jacobian value. The Jacobian value is a matrix of the derivation of global to local FE interpolation function and the quality of any mesh can be directly evaluated by its Jacobian value (3). Distorted FEs, which are not suitable for subsequent numerical calculations, show a negative Jacobian. To optimize the Jacobian, we implemented the standard Laplacian smoothing technique (LST; 16). The LST usually takes a few loops (repetitions of step 2) over all FEs to achieve positive Jacobian values for all FEs. The results of applying the LST for 3D and 2D cases are shown, respectively, in Fig. 4D, right (“After LST”).
Validation of Segmentation and Image Processing
Once 3D reconstruction was performed with a certain tentative threshold value, the resulting 3D structure was evaluated against the gold standard, i.e., well-characterized morphometric data provided by Tschanz et al. (62). We calculated the volume density of tissue (VVS) and surface area density of air space (SVS [cm2/cm3]) to determine if there was unacceptable discrepancy. If so, we readjusted the threshold level and repeated the segmentation process, mesh generation, and subsequent image analysis until our calculated morphological parameters were within <5% difference of the gold standard (Fig. 1).
Visualization of the 3D Reconstruction
Once the calculated morphological parameters met the gold standard, the resulting 3D reconstruction was transformed in a standard VRML format for visualization as well as DAT format for subsequent FE analysis.
RESULTS
The Epon embedded lung tissue samples of a 60-day-old rat were selected from the “lung tissue library” of Peter Burri's lab (University of Bern). All morphological parameters of this particular rat, against which our data were compared, are available and published in Tschanz et al. (62).
A Raw Image Stack and a Cubic Subregion
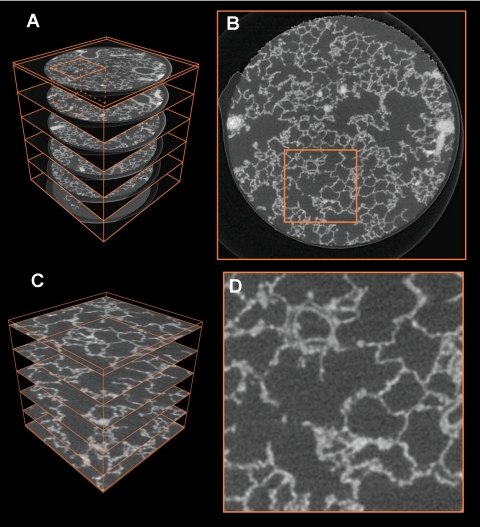
The samples were scanned with SRXTM and a stack of 1,024 raw images was reconstructed in tiff format (Fig. 5A : stack of images, 5B: one slice of the raw data). The resolution of the image was 1.4 μm/pixel, thus the edge length of the cubic stack was 1,433.6 μm, containing approximately one billion isotropic voxels.
Fig. 5.
Overview of workflow for the selection of a region of interest (ROI). A: full perspective view of the sample R108C60C-07e with 6 selected orthogonal slices and bounding box of the full sample in orange. The ROI selected for subfigures C and D is visible in the top left. B: close-up of one slice of the full dataset with selected ROI (sidelength of 256 pixels). C: ROI cut out of the full sample, 6 selected orthogonal slices are shown. D: close-up of the ROI in subfigure (B).
To facilitate further processing of the image, different subregions of interest (ROI) were extracted from the original raw data (one exemplary ROI is the orange small cube in Fig. 5A), which is shown enlarged in Fig. 5C). This ROI has a size of 196 × 196 × 196 pixels (i.e., an edge length of ∼275 μm) and contains ∼7.5 million voxels. This is a reasonable size of data that can easily be handled by a standard PC (Duo Core 2 Pentium 2.33 GHz, 2 GB RAM) for visualization and volume rendering. The aforementioned size is an intermediate ROI; depending on the need for visualization/volume rendering other sizes have been chosen. To validate the segmentation (see below), we split a big ROI inside the sample in the full dataset vertically into five subregions leading to a ROI size of 200 × 200 × 180 pixels.
Segmentation
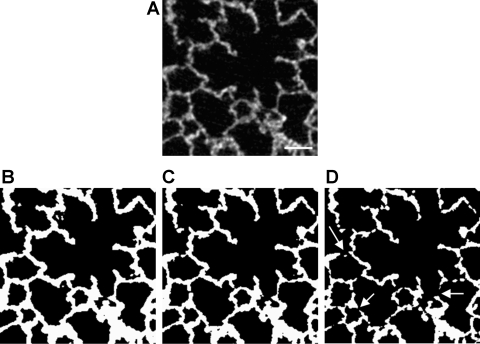
As mentioned, the selection of a threshold level has significant affects on segmentation. To demonstrate this, we have segmented a small crop of the original data (Fig. 6A) with three different threshold values. With a low threshold level, for instance 130, the image would possess too many black voxels and the septa in the lung appear to be too thick (Fig. 6B). On the other hand, with a higher threshold level, for instance 148, the image would possess too many white voxels and the lung tissue appears to be very thin, with multiple erroneous holes in the septal walls (Fig. 6D). With an intermediate threshold, for instance 139, the lung structure appears to be reasonable, with a minor amount of holes (Fig. 6C). The optimal value of the threshold level was iteratively determined by performing a “readjustment-recalculation” process to match some of the key morphological parameters in the resulting 3D reconstruction to the gold standard. This is explained below in detail.
Fig. 6.
A: original slice from raw data; bar = 50 μm. B: thresholded with a value of 130, meaning that all pixels below 130 are set to black, all pixels with a value of 130 or greater are set to white. Resulting alveolar walls are too thick. C: thresholded with a value of 139. Image looks correct. At this threshold the observed thickness of the septa was smaller than 10 μm. In the same animals (45) the thickness of the septa was determined as they appeared on electron microscopical images. They measured a mean of 8 μm. D: thresholded with a value of 148. Alveolar walls are too thin, and multiple erroneous holes (arrows) appear in the tissue.
FE 3D reconstruction
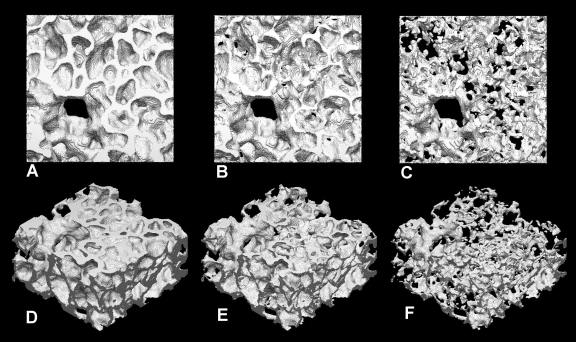
Prior to the 3D reconstruction, the OCA was performed to screen small objects with unreasonable size; voxels of those unreasonably small objects were reclassified to match the surrounding voxels. After successful preprocessing, 3D reconstruction was performed using GBHA. The examples with three different values of threshold level (130, 139, 148), corresponding to those in Fig. 6, are shown in Fig. 7. As is expected, the 3D reconstructed object appears to have thick tissue walls with the lower threshold value of 130, while it appears to be too thin, with many holes with the higher threshold value of 148. With the intermediate threshold value of 139, the structure appears to be reasonable. This will be tested quantitatively next.
Fig. 7.
3D reconstruction of tissue. A and D: threshold 130. B and E: threshold 139. C and F: threshold 148.
Validation of Segmentation and Image Processing
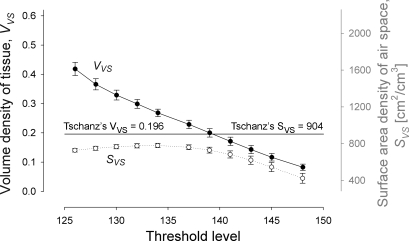
To perform a statistical analysis for the selection of the threshold value, five pieces of parenchymal sample (200 × 200 × 180 pixels) were selected. We calculated the VVS of each ROI after the 3D reconstruction, and the average value with standard error (SE) was plotted as a function of threshold level (Fig. 8). Our calculated value of VVS nearly linearly decreased with increasing threshold level and our VVS matches the gold standard value of 0.196 at a threshold value of 139. In addition, the values of calculated SE were generally very small, indicating that each sample, although small in size, represented typical parenchymal structure. We determined to use a threshold value of 139 for this tissue sample.
Fig. 8.
Average volume density of tissue (VVS) and surface area density of air space (SVS) of ROIs, plotted as a function of threshold level. Error bars represent standard error. Our VVS matches the gold standard value of 0.196 at a threshold value of 139. Bars include the standard error, n = 5.
The surface area density of air space (SVs [cm2/cm3]) of each ROI sample was also calculated and plotted (Fig. 8). As we expected, however, SVS shows poor match with the reported value of 904 ± 84 (SE) over almost the entire range of threshold levels tested and especially at the threshold value of 139. The cause of this discrepancy will be discussed in detail in the discussion.
FE 3D Reconstruction of Air Space
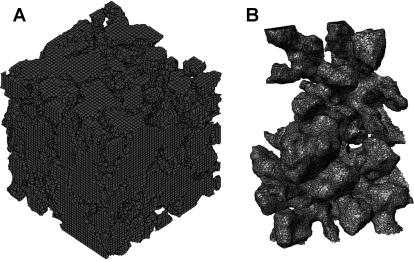
3D air spaces, separated by tissues, in the ROI were also constructed (Fig. 9). To demonstrate air space configuration more clearly, a small alveolated air section was isolated from the center of ROI and was enlarged in an inset of Fig. 9. These 3D air objects packed with several million 3D 8-node FEs (a mixture of structured and unstructured cubic elements) can be readily used for FE calculations, including airflow computational fluid dynamics (CFD), in the future.
Fig. 9.
A: reconstruction of 3D air spaces separated by tissues from ROI. B: enlargement of a small alveolated air section isolated from the center of ROI.
DISCUSSION
We described our custom-made FE methodology to reconstruct the acinar air space as well as septal tissue of rat lung in three dimensions. Approximately 3 mm3 (=3 × 109 μm3) of fixed lung tissue was scanned with high resolution SRXTM (voxel size = 1.4 μm3) and a stack of 1,024 image slices (1,024 × 1,024 pixels) was prepared for 3D rendering. After preprocessing the raw voxel data with a tentative threshold level, 3D FEs were created overlaying the voxel map using a GBHA. A proper threshold value for adequate segmentation was iteratively determined to match the calculated volume density of tissue (VVS) to the stereological determined value (62). With the optimized algorithms (a combination of OCA and GBHA algorithms), CPU time for one iteration for ∼8 million voxels was ∼90 min by a standard PC.
Historical Perspective
Acinar structure was traditionally studied using lung cast models (7, 19, 53) or serial histological sections (e.g., 5, 21, 22, 41, 43). With the former approach, some types of measures are not possible: only the polymer-filled air spaces are available for measurement as the tissue is digested away, and internal data are lost as scanning electron microscopy is limited to the exposed surfaces of the cast. 3D rendering of alveolar geometries from histological sections requires careful, time-consuming alignment and registration of serial 2D sections (37, 38, 57), which generally limits reconstruction to just a few alveoli (37). An additional drawback is sample destruction and deformation from physical sectioning.
Optical sectioning permits faster, less invasive, more thorough digital analysis and 3D rendering than is possible with physical sectioning. Large upper airways can be analyzed with modern techniques such as magnetic resonance microscopy (24, 60) or optical coherence tomography (20); functional imaging of the lung by CT and MRI has recently been summarized by van Beek and Hoffman (63). Laser scanning confocal microscopy provides sufficient resolution to image fine-scale acinar detail, but there have been very few 3D acinar reconstruction studies using this method. Cookson et al. (12) used serial optical sections acquired by confocal microscopy to produce 3D volume renderings of human alveolar ducts. This approach is restricted in that imaging depth below the tissue surface is limited by light penetration and the working distance of the objective lens (6). Cookson et al. (12) warned that caution was necessary in interpreting confocal 3D renderings because the relative contributions of the various factors (refractive index changes, tissue density changes, resorption) causing depth-dependent loss of resolution and/or intensity were difficult to measure and correct. Multiphoton microscopy improves imaging depth, but the imaging depth is still restricted to ∼100 μm into the lung (42). For comparison, human alveolar ducts range from 270 to 600 μm in diameter (67). Thus sample size constraints limit confocal analysis to just a small portion of the acinus, restricting its usefulness in studies of flow and aerosol particle deposition. In the early 1990s, new imaging techniques, such as CT (8, 36), permitted measurement and reconstruction of the 3D structure of the bronchial tree and small airways (1, 23, 40, 44, 46, 54, 68, 69). Successful visualization of the acinar region, though, was limited by the spatial resolution of standard μCT. In the past few years, however, μCT-based 3D reconstruction and morphometric analysis of the alveolar region has become possible (32, 34, 65), facilitated by the advent of synchrotron radiation computed tomography (SRCT). SRCT is to be distinguished from SRXTM (51, 58, 59). While during SRCT the X-rays are directly recorded after transmitting the sample, during SRXTM the transmitted images are first recorded on a scintillator and magnified 5–20 times by a light microscope before recording.
SRXTM
Synchrotron radiation (SR) is an electromagnetic wave emitted from electrons traveling near the speed of light when their path is bent by a magnetic field (27). A synchrotron facility is an excellent source of the most useful electromagnetic waves to explore materials and biological systems: X-ray ultraviolet and infrared light. Here we limit our discussion particularly to the application of SR for X-ray tomographic microscopy (Fig. 2) highlighting the following superb features.
High power and high brilliance.
SR is extremely powerful but even more important is that this radiation is emitted by a small source area and that this emission occurs within a narrow angular cone. Bending magnets or sophisticated insertion devices (called undulators or wigglers) produces therefore a high brilliant radiation that is several orders of magnitude more bright than conventional X-ray tubes (Fig. 2). This makes the usage of monochromators4 particularly interesting since an extremely intense photon flux at a selected energy (or wavelength) can easily be extracted from the white beam emitted by the source (Fig. 2). The X-ray energy can be adjusted “ad hoc” to the sample, according to its absorption properties. The monochromaticity of the beam is an important feature of SR application, critical for tomography applications since it automatically eliminates beam hardening artifacts from the tomographic reconstruction.
The high collimation of the SR produces “de facto” a parallel beam at the sample location: the resulting negligible geometrical blur makes it possible to obtain images with high spatial resolution and a high signal-to-noise ratio (SNR). Since, for a given SNR and a given contrast, the necessary photon flux scales with the fourth power of the spatial resolution (6) it is obvious that SR-based tomography is perfectly suited for investigations with spatial resolution in the micrometer or even submicrometer range. Nowadays, X-ray tomographic microscopy endstations installed at third generation synchrotron facilities like TOMCAT (59) routinely reach resolution ∼1 μm within scan times of a few minutes.
Synchrotron radiation-based CT overcomes the critical technical issue (resolution) that has prevented fine-scale structural analysis of the acinus by tabletop X-ray μCT. The brilliant, highly collimated beam provides a nearly ideal X-ray source for μCT (30), producing greater spatial resolution. This allows high-resolution imaging of unprocessed lung tissue (4, 29, 39, 55, 56) and ultra high resolution (from <1 to 15 μm, with tissue thicknesses of ≥1,500 μm) visualization and 3D reconstruction of small airways and alveoli in processed tissue (28, 51).
Segmentation/Threshold
Careful determination of the proper threshold level is essential for accurate 3D rendering and for the first step of FE-mesh generation. If the level is too low, the fraction of air would become unrealistically small relative to tissue resulting in thicker septa. If the level is too high, on the other hand, the fraction of air becomes unrealistically large relative to tissue; thinner tissue would result in artificial holes in the septal walls or even too many unconnected tissue pieces in the sample. This would have a direct impact on the skeletonization process (which is not dealt with in this paper), as well as the subsequent FE analyses, such as airflow simulations. Our OCA is designed to minimize this problem.
A unique aspect of our work is that segmentation was done iteratively by searching for the optimal threshold value (Fig. 1). In every iteration, the key morphological parameter (discussed below in detail) was calculated and compared with the gold standard; the iteration was continued until the calculated value matched the gold standard. This gold standard was previously determined in the tissue sample from exactly the same animal (62). Because our main aim in this work was to develop FE methodology, this selection of tissue sample, whose morphology has been thoroughly analyzed, is very well suited for this project.
The key morphological parameter we tried to match was the volume density of tissue (VVS). The VVS is an easy to calculate parameter (i.e., the sum of FE volume belonging to tissue divided by the sum of all FE volume) and is relatively insensitive to the resolution of the measurement technique. The calculated VVS decreases almost linearly with an increase in the threshold level (i.e., a fraction of air volume relative to tissue volume) around the gold standard value (VVS = 0.196 in our case, see Fig. 8). At the threshold value of 139, the calculated VVS was within 2% difference of the gold standard.
We also calculated surface area density of air space (SVS [cm2/cm3]) and compared it with the value reported by Tschanz et al. (62). However, our calculated values were always lower than the reported value (SVS = 904 [cm2/cm3]). This is because although the volume is relatively insensitive to the resolution of the measurement technique, the air-tissue boundary (surface area) is highly sensitive to how it is measured. SVS reported in Tschanz et al. (62) was measured at a ×10 secondary magnification after recording the electron microscopical images at a primary magnification of ×1,200 on a 35 mm film (theoretical resolution of ∼70 nm), while the resolution of our 3D reconstruction is 1.4 μm. The extent of surface complexity is recognized differently, depending on the resolution of the measuring instrument; the finer the resolution of the sample and the instrument, the more surface detail can be detected. This is similar to the problem when one measures the length of the British coastline with different yardsticks (35).
2D vs. 3D
Morphological analyses in 3D are qualitatively different from stereology, which is an analysis made in 2D sections to infer 3D structure and morphometry. Apart from the most common measures of geometric/topological properties, such as the volume density, the area density, and the length density, stereological analysis is generally limited. For example, number density cannot be estimated stereologically using single sections without a significant number of a priori assumptions about the shape of the objects, including the question of whether the objects are convex and whether they are simply connected. These significant restrictions in the stereological analysis are due to the fact that it is based on the following two fundamental assumptions: 1) the structure is homogeneously distributed (i.e., spatially invariant) and 2) isotropically distributed (i.e., rotation invariant) in the tissue sample (J. P. Butler, personal communication). The 3D analysis relaxes these restrictions either by going to full unrestricted 3D (μCT, MRI, SRXTM, etc.) or using two consecutive sections (disector) for the counting of numbers (26).
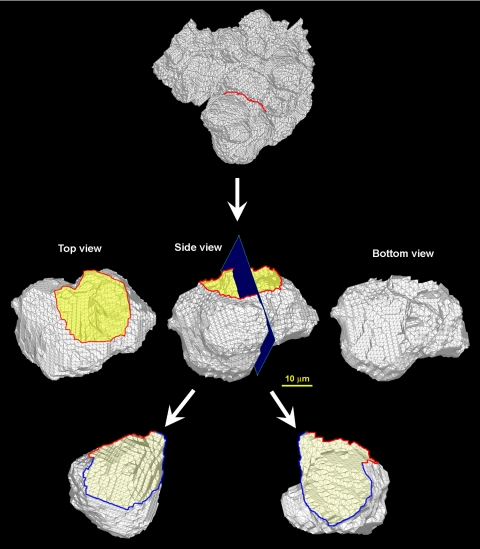
In addition to these fundamental differences, 3D analyses have numerous advantages over traditional stereology. The most obvious advantage is the flexibility of the analysis. It is often difficult to properly select a ROI because the exact location of the target region cannot be identified beforehand and in the traditional approach, one has only one opportunity to section the tissue sample. In the case of 3D reconstruction analysis, on the other hand, the selection of the ROI can be repeated as many times as required and the selection can be iteratively improved until the target ROI is obtained. Once the ROI is selected in 3D (Fig. 10, top), the target region (e.g., an alveolus) can be viewed from any arbitrary angle (see Fig. 10, middle), including from behind the object (Fig. 10, middle right), something not easily achievable otherwise. The 3D object can be cut into half (Fig. 10, bottom) and also be sliced to make 2D sections in any orientation with any slab thickness (data not shown) and there is no limitation in repeating the sectioning process. Furthermore, since the ROI can be viewed in any chosen angle and an internal view is possible, it is possible to fly through the structure to gain an internal view of the conduit once the 3D reconstructed structure is electronically available.
Fig. 10.
3D FE shell model of acinus viewed from different angles. Top: ROI. Middle: top view (left); side view (middle); bottom view (right). Bottom: alveolar inside views (left and right).
FE 3D Rendering
It is important to make a clear distinction between our FE 3D rendering approach and the traditional surface triangulation approach that is most common in medical imaging software. The triangulation approach is mainly used for surface visualization; this uses a variety of filtering methods and surface smoothing techniques, but does not involve real volume like with our FE 3D rendering method. If the volume compartment of either air or tissue is needed for subsequent analysis, such as for a calculation of fluid flow in acinar air space, a traditional surface triangulation approach does not provide a readily usable 3D structure; a volume bounded by the visualized surface needs to be further elementalized. Since we are in possession of a closed workflow for the further processing of the meshed surfaces (i.e., there is a single process from mesh generation through to visualization), intermediate conversions of the dataset into other formats are not required. This eliminates overhead and speeds the overall process. The FE mesh of the data makes it possible to use it for volume rendering, further processing (with the use of quasi-standard STL file format5 ), and direct import into the software used for CFD calculations and evaluation of morphological factors. Since we also obtain a mesh inside the structure, we lay the groundwork for the skeletonization (extraction of the mean middle line) of the terminal airways and the determination of the entrance ring of a single alveolus.
The main aim of this project is a direct elementalization of air (or tissue) space using FE technique. By isolating air (or tissue) from the rest (tissue or air, respectively), the interface of these two volume components, i.e., an air-tissue barrier, is automatically identified. For this isolation, we adapted the GBHA proposed by Schneiders (52). First, an FE mesh was overlaid on the voxel map. Basically, a relation of one FE to one voxel could be used, but one practical problem may arise. That is, if the number of voxels in the original data is too large (i.e., in an order of billion in the case of our raw data) for a common PC to handle easily, we may need to reduce the number ratio between FE and voxel. The important points to achieve are, generally, 1) to reduce the number of FEs to a reasonable number but 2) to still produce a smooth surface boundary. We use hexahedral FE for this. An air-tissue interface was smoothed by adjusting the locations of FE nodal points near the interface based on their original grayscale pixel intensity values. The distortions of FE elements, if this happened as a result of the initial nodal relocation, were corrected and refined (see methods for details). The resulting 3D FE mesh (e.g., Figs. 9, 10) demonstrates reasonable acinar volume rendering.
Finally, for the type of image analysis discussed in this paper, the need for massive computation for 3D rendering as well as subsequent FE computational analyses is unavoidable. In this regard, improving our computational capability, particularly by using parallel and grid computing algorithms, would be required in the near future.
Acknowledgments
We thank F. Marone and C. Hintermüller (Swiss Light Source, Paul Scherrer Institute) for expert help at the Beamline; B. de Breuyin, K. Sala-Szymanska, and B. Haenni for the embedding and preparation of the samples; C. Lehmann for the tricky shaping of the samples on the lathe; and D. Petrovic for preparing Fig. 10. We also thank J. P. Butler and S. Tschanz for useful discussion on the subject of stereology.
This work was supported by National Heart, Lung, and Blood Institute Grants HL-054885, HL-070542, and HL-074022, Serbian Ministry of Science, OI144028, TR12007, and Swiss National Science Foundation Grant 3100A0–109874/1.
The costs of publication of this article were defrayed in part by the payment of page charges. The article must therefore be hereby marked “advertisement” in accordance with 18 U.S.C. Section 1734 solely to indicate this fact.
Footnotes
TOMCAT is a beamline for TOmographic Microscopy and Coherent RAdiology experimenTs, which started regular user operation on June 2006. Located at the X02DA port of the SLS, the beamline gets photons from a 2.9-T superbend. A double crystal multilayer monochromator (DCMM) covers an energy range between 6 and 45 keV with a bandwidth of a few percent down to 10−4 (59).
This particular energy enables us to achieve a high contrast between the tissue and the background of the sample.
Binning is the process of grouping together a certain number of input-pixels to one output-pixel while recording the image; this is done to suppress the noise of the resulting image through averaging of four pixels to one (in the present case) and to reduce the file size.
A monochromator is a device in X-ray optics that is used to select a defined wavelength of the radiation for further use in a dedicated instrument or beamline.
An STL file describes a raw unstructured triangulated surface by the unit normal and vertices of the triangles using a 3D Cartesian coordinate system.
REFERENCES
- 1.Aykac D, Hoffman EA, McLennan G, Reinhardt JM. Segmentation and analysis of the human airway tree from three-dimensional X-ray CT images. IEEE Trans Med Imaging 22: 940–950, 2003. [DOI] [PubMed] [Google Scholar]
- 2.Ballard D., Brown C. Computer Vision. Englewood Cliffs, NJ: Prentice-Hall, 1982.
- 3.Bathe KJ Finite Element Procedures. Englewood Cliffs, NJ: Prentice-Hall, 1995.
- 4.Bayat S, Porra L, Suhonen H, Nemoz C, Suortti P, Sovijarvi AR. Differences in the time course of proximal and distal airway response to inhaled histamine studied by synchrotron radiation CT. J Appl Physiol 100: 1964–1973, 2006. [DOI] [PubMed] [Google Scholar]
- 5.Berend N, Rynell AC, Ward HE. Structure of a human pulmonary acinus. Thorax 46: 117–121, 1991. [DOI] [PMC free article] [PubMed] [Google Scholar]
- 6.Bonse U, Busch F. X-ray computed microtomography (microCT) using synchrotron radiation (SR). Progr Biophys Mol Biol 65: 133–169, 1996. [DOI] [PubMed] [Google Scholar]
- 7.Boyden EA The structure of the pulmonary acinus in a child of six years and eight months. Am J Anat 132: 275–299, 1971. [DOI] [PubMed] [Google Scholar]
- 8.Brown RH, Herold CJ, Hirshman CA, Zerhouni EA, Mitzner W. In vivo measurements of airway reactivity using high-resolution computed tomography. Am Rev Respir Dis 144: 208–212, 1991. [DOI] [PubMed] [Google Scholar]
- 9.Chaturvedi A, Lee Z. Three-dimensional segmentation and skeletonization to build an airway tree data structure for small animals. Phys Med Biol 50: 1405–1419, 2005. [DOI] [PubMed] [Google Scholar]
- 10.Cheng I, Nilufar S, Flores-Mir C, Basu A. Airway segmentation and measurement in CT images. Conf Proc IEEE Eng Med Biol Soc 2007: 795–799, 2007. [DOI] [PubMed] [Google Scholar]
- 11.Chooi WK, Morcos SK. High resolution volume imaging of airways and lung parenchyma with multislice CT. Br J Radiol Spec 1: S98–105, 2004. [DOI] [PubMed] [Google Scholar]
- 12.Cookson MJ, Davies CJ, Entwistle A, Whimster WF. The microanatomy of the alveolar duct of the human lung imaged by confocal microscopy and visualised with computer-based 3D reconstruction. Comput Med Imaging Graph 17: 201–210, 1993. [DOI] [PubMed] [Google Scholar]
- 13.Dame Carroll JR, Chandra A, Jones AS, Berend N, Magnussen JS, King GG. Airway dimensions measured from micro-computed tomography and high-resolution computed tomography. Eur Respir J 28: 712–720, 2006. [DOI] [PubMed] [Google Scholar]
- 14.Davies E Machine Vision: Theory, Algorithms and Practicalities, New York: Academic, 1990.
- 15.Driehuys B, Walker J, Pollaro J, Cofer GP, Mistry N, Schwartz D, Johnson GA. 3He MRI in mouse models of asthma. Magn Reson Med 58: 893–900, 2007. [DOI] [PMC free article] [PubMed] [Google Scholar]
- 16.Freitag L, Plassmann P. Local optimization based simplicial mesh untangling and improvement. Intl J Num Method Engr 49: 109–125, 2000. [Google Scholar]
- 17.Gehr P, Bachofen ER, Weibel M. The normal human lung—ultrastructure and morphometric estimation of diffusion capacity. Respir Physiol 32: 121–140, 1978. [DOI] [PubMed] [Google Scholar]
- 18.Gonzalez Woods RR Digital Image Processing. Indianapolis, IN: Addison-Wesley Publishing, 1992.
- 19.Haefeli-Bleuer B, Weibel ER. Morphometry of the human pulmonary acinus. Anat Record 220: 401–414, 1988. [DOI] [PubMed] [Google Scholar]
- 20.Hanna N, Saltzman D, Mukai D, Chen Z, Sasse S, Milliken J, Guo S, Jung W, Colt H, Brenner M. Two-dimensional and 3-dimensional optical coherence tomographic imaging of the airway, lung, and pleura. J Thorac Cardiovasc Surg 129: 615–622, 2005. [DOI] [PubMed] [Google Scholar]
- 21.Hansen JE, Ampaya EP. Human air space shapes, sizes, areas, and volumes. J Appl Physiol 38: 990–995, 1975. [DOI] [PubMed] [Google Scholar]
- 22.Hansen JE, Ampaya EP, Bryant GH, Navin JJ. Branching pattern of airways and air spaces of a single human terminal bronchiole. J Appl Physiol 38: 983–989, 1975. [DOI] [PubMed] [Google Scholar]
- 23.Higgins WE, Ramaswamy K, Swift RD, McLennan G, Hoffman EA. Virtual bronchoscopy for three-dimensional pulmonary image assessment: state of the art and future needs. Radiographics 18: 761–778, 1998. [DOI] [PubMed] [Google Scholar]
- 24.Hoffman EA, Gefter W. Multimodality Imaging of the Upper Airway: MRI, MR Spectroscopy, and Ultrafast X-ray CT. In: Sleep and Respiration, edited by Issa FG, Suratt PM, Remmers JE. New York: Wiley-Liss, 1991, p. 291–301. [PubMed]
- 25.Honda T, Ota H, Arai K, Hayama M, Fujimoto K, Yamazaki Y, Haniuda M. Three-dimensional analysis of alveolar structure in usual interstitial pneumonia. Virchows Arch 441: 47–52, 2002. [DOI] [PubMed] [Google Scholar]
- 26.Hyde DM, Tyler NK, Plopper CG. Morphometry of the respiratory tract: avoiding the sampling, size, orientation, and reference traps. Toxicol Pathol 35: 41–48, 2007. [DOI] [PubMed] [Google Scholar]
- 27.Iida A X-ray analysis by synchrotron radiation: X-ray fluorescence analysis and XAFS. Biomed Res Trace Elements 14: 188–195, 2003. [Google Scholar]
- 28.Ikura H, Shimizu K, Ikezoe J, Nagareda T, Yagi N. In vitro evaluation of normal and abnormal lungs with ultra-high-resolution CT. J Thorac Imaging 19: 8–15, 2004. [DOI] [PubMed] [Google Scholar]
- 29.Jheon S, Youn HS, Kim HT, Choi GH, Kim JK. High-resolution X-ray refraction imaging of rat lung and histological correlations. Microsc Res Tech 69: 656–659, 2006. [DOI] [PubMed] [Google Scholar]
- 30.Jorgensen SM, Demirkaya O, Ritman EL. Three-dimensional imaging of vasculature and parenchyma in intact rodent organs with X-ray micro-CT. Am J Physiol 275: H1103–H1114, 1998. [DOI] [PubMed] [Google Scholar]
- 31.Kvistedal Y, Tawhai M, Hunter P, Nielsen PM. High resolution 3D imaging of lung tissue using structured light microscopy. Conf Proc IEEE Eng Med Biol Soc 1: 193–195, 2005. [DOI] [PubMed] [Google Scholar]
- 32.Langheinrich AC, Bohle RM, Breithecker A, Lommel D, Rau WS. Micro-computed tomography of the vasculature in parenchymal organs and lung alveoli. Fortschritte auf dem Gebiete der Rontgenstrahlen und der Nuklearmedizin 176: 1219–1225, 2004. [DOI] [PubMed] [Google Scholar]
- 33.Ley-Zaporozhan J, Ley S, Kauczor HU. Morphological and functional imaging in COPD with CT and MRI: present and future. Eur Radiol 18: 510–521, 2008. [DOI] [PubMed] [Google Scholar]
- 34.Litzlbauer HD, Neuhaeuser C, Moell A, Greschus S, Breithecker A, Franke FE, Kummer W, Rau WS. Three-dimensional imaging and morphometric analysis of alveolar tissue from microfocal X-ray-computed tomography. Am J Physiol Lung Cell Physiol 291: L535–L545, 2006. [DOI] [PubMed] [Google Scholar]
- 35.Mandelbrot BB How long is the coast of Britain? Statistical self-similarity and fractional dimension. Science 156: 636–638, 1967. [DOI] [PubMed] [Google Scholar]
- 36.McNamara AE, Muller NL, Okazawa M, Arntorp J, Wiggs BR, Pare PD. Airway narrowing in excised canine lungs measured by high-resolution computed tomography. J Appl Physiol 73: 307–316, 1992. [DOI] [PubMed] [Google Scholar]
- 37.Mercer RR, Crapo JD. Three-dimensional reconstruction of the rat acinus. J Appl Physiol 63: 785–794, 1987. [DOI] [PubMed] [Google Scholar]
- 38.Mercer RR, Laco JM, Crapo JD. Three-dimensional reconstruction of alveoli in the rat lung for pressure-volume relationships. J Appl Physiol 62: 1480–1487, 1987. [DOI] [PubMed] [Google Scholar]
- 39.Monfraix S, Bayat S, Porra L, Berruyer G, Nemoz C, Thomlinson W, Suortti P, Sovijarvi AR. Quantitative measurement of regional lung gas volume by synchrotron radiation computed tomography. Phys Med Biol 50: 1–11, 2005. [DOI] [PubMed] [Google Scholar]
- 40.Park W, Hoffman EA, Sonka M. Segmentation of intrathoracic airway trees: a fuzzy logic approach. IEEE Trans Med Imaging 17: 489–497, 1998. [DOI] [PubMed] [Google Scholar]
- 41.Parker H, Horsfield K, Cumming G. Morphology of distal airways in the human lung. J Appl Physiol 31: 386–391, 1971. [DOI] [PubMed] [Google Scholar]
- 42.Pena AM, Fabre A, Debarre D, Marchal-Somme J, Crestani B, Martin JL, Beaurepaire E, Schanne-Klein MC. Three-dimensional investigation and scoring of extracellular matrix remodeling during lung fibrosis using multiphoton microscopy. Microsc Res Tech 70: 162–170, 2007. [DOI] [PubMed] [Google Scholar]
- 43.Randell SH, Mercer RR, Young SL. Postnatal growth of pulmonary acini and alveoli in normal and oxygen-exposed rats studied by serial section reconstructions. Am J Anat 186: 55–68, 1989. [DOI] [PubMed] [Google Scholar]
- 44.Reinhardt JM, D'Souza ND, Hoffman EA. Accurate measurement of intrathoracic airways. IEEE Trans Med Imaging 16: 820–827, 1997. [DOI] [PubMed] [Google Scholar]
- 45.Roth-Kleiner M, Berger TM, Tarek MR, Burri PH, Schittny JC. Neonatal dexamethasone induces premature microvascular maturation of the alveolar capillary network. Dev Dyn 233: 1261–1271, 2005. [DOI] [PubMed] [Google Scholar]
- 46.Sauret V, Halson PM, Brown IW, Fleming JS, Bailey AG. Study of the three-dimensional geometry of the central conducting airways in man using computed tomographic (CT) images. J Anat 200: 123–134, 2002. [DOI] [PMC free article] [PubMed] [Google Scholar]
- 47.Scadeng M, Rossiter HB, Dubowitz DJ, Breen EC. High-resolution three-dimensional magnetic resonance imaging of mouse lung in situ. Invest Radiol 42: 50–57, 2007. [DOI] [PubMed] [Google Scholar]
- 48.Scherle W A simple method for volumetry of organs in quantitative stereology. Mikroskopie 26: 57–60, 1970. [PubMed] [Google Scholar]
- 49.Schittny JC, Paulsson M, Vallan C, Burri PH, Kedei N, Aeschlimann D. Protein cross-linking mediated by tissue transglutaminase correlates with the maturation of extracellular matrices during lung development. Am J Respir Cell Mol Biol 17: 334–343, 1997. [DOI] [PubMed] [Google Scholar]
- 50.Schittny JC, Djonov V, Fine A, Burri PH. Programmed cell death contributes to postnatal lung development. Am J Respir Cell Mol Biol 18: 786–793, 1998. [DOI] [PubMed] [Google Scholar]
- 51.Schittny JC, Mund SI, Stampanoni M. Evidence and structural mechanism for late lung alveolarization. Am J Physiol Lung Cell Physiol 294: L246–L254, 2008. [DOI] [PubMed] [Google Scholar]
- 52.Schneiders R A grid-based algorithm for the generation of hexahedral element meshes. Engr Comput 12: 168–177, 1996. [Google Scholar]
- 53.Schreider JP, Raabe OG. Structure of the human respiratory acinus. Am J Anat 162: 221–232, 1981. [DOI] [PubMed] [Google Scholar]
- 54.Sera T, Fujioka H, Yokota H, Makinouchi A, Himeno R, Schroter RC, Tanishita K. Three-dimensional visualization and morphometry of small airways from microfocal X-ray computed tomography. J Biomech 36: 1587–1594, 2003. [DOI] [PubMed] [Google Scholar]
- 55.Sera T, Uesugi K, Himeno R, Yagi N. Small airway changes in healthy and ovalbumin-treated mice during quasi-static lung inflation. Resp Physiol Neurobiol 156: 304–311, 2007. [DOI] [PubMed] [Google Scholar]
- 56.Sera T, Uesugi K, Yagi N. Morphometric deformations of small airways and alveoli under quasi-static inflation process. J Physiol Anthropol Appl Human Sci 24: 465–468, 2005. [DOI] [PubMed] [Google Scholar]
- 57.Stelter GP, Hansen JE, Fairchild DG. A three-dimensional reconstruction of lung parenchyma. Am Rev Respir Dis 94: 79–85, 1966. [DOI] [PubMed] [Google Scholar]
- 58.Stampanoni M, Borchert G, Wyss P, Abela R, Patterson B, Hunt S, Vermeulen D, Rüegsegger P. High resolution X-ray detector for synchrotron-based microtomography. Nucl Instr Methods Phys Res, Sect A 491: 291–301, 2002. [Google Scholar]
- 59.Stampanoni M, Groso A, Isenegger A, Mikuljan Q, Chen Q, Bertrand A, Henein S, Betemps R, Frommherz U, Böhler P, Meister D, Lange M, Abela R. Trends in synchrotron-based tomographic imaging: the SLS experience. In: Developments in X-Ray Tomography V. Proceedings of SPIE, edited by Bonse U., 2007, p. 1605–7422.
- 60.Sundaramoorthy G, Hoford JD, Hoffman EA, Higgins WE. IMPROMPTU: a system for automatic 3D medical image-analysis. Comput Med Imaging Graph 19: 131–143, 1995. [DOI] [PubMed] [Google Scholar]
- 61.Tawhai MH, Hunter P, Tschirren J, Reinhardt J, McLennan G, Hoffman EA. CT-based geometry analysis and finite element models of the human and ovine bronchial tree. J Appl Physiol 97: 2310–2321, 2004. [DOI] [PubMed] [Google Scholar]
- 62.Tschanz SA, Makanya AN, Haenni B, Burri PH. Effects of neonatal high-dose short-term glucocorticoid treatment on the lung: a morphologic and morphometric study in the rat. Pediatr Res 53: 72–80, 2003. [DOI] [PubMed] [Google Scholar]
- 63.Van Beek EJ, Hoffman EA. Functional imaging: CT and MRI. Clin Chest Med 29: 195–216, 2008. [DOI] [PMC free article] [PubMed] [Google Scholar]
- 64.Van Ertbruggen C, Hirsch C, Paiva M. Anatomically based three-dimensional model of airways to simulate flow and particle transport using computational fluid dynamics. J Appl Physiol 98: 970–980, 2005. [DOI] [PubMed] [Google Scholar]
- 65.Watz H, Breithecker A, Rau WS, Kriete A. Micro-CT of the human lung: imaging of alveoli and virtual endoscopy of an alveolar duct in a normal lung and in a lung with centrilobular emphysema—initial observations. Radiology 236: 1053–1058, 2005. [DOI] [PubMed] [Google Scholar]
- 66.Weibel ER Morphometry of the Human Lung. Berlin: Springer-Verlag, 1963.
- 67.Whimster WF The microanatomy of the alveolar duct system. Thorax 25: 141–149, 1970. [DOI] [PMC free article] [PubMed] [Google Scholar]
- 68.Wood SA, Hoford JD, Hoffman EA, Zerhouni E, Mitzner W. A method for measurement of cross sectional area, segment length, and branching angle of airway tree structures in situ. Comput Med Imaging Graph 19: 145–152, 1995. [DOI] [PubMed] [Google Scholar]
- 69.Wood SA, Zerhouni EA, Hoford JD, Hoffman EA, Mitzner W. Measurement of three-dimensional lung tree structures by using computed tomography. J Appl Physiol 79: 1687–1697, 1995. [DOI] [PubMed] [Google Scholar]


