Abstract
Rat basophilic leukemia (RBL-2H3) cells predominantly express the type II receptor for inositol 1,4,5-trisphosphate (InsP3), which operates as an InsP3-gated calcium channel. In these cells, cross-linking the high-affinity immunoglobulin E receptor (FcεR1) leads to activation of phospholipase C γ isoforms via tyrosine kinase- and phosphatidylinositol 3-kinase-dependent pathways, release of InsP3-sensitive intracellular Ca2+ stores, and a sustained phase of Ca2+ influx. These events are accompanied by a redistribution of type II InsP3 receptors within the endoplasmic reticulum and nuclear envelope, from a diffuse pattern with a few small aggregates in resting cells to large isolated clusters after antigen stimulation. Redistribution of type II InsP3 receptors is also seen after treatment of RBL-2H3 cells with ionomycin or thapsigargin. InsP3 receptor clustering occurs within 5–10 min of stimulus and persists for up to 1 h in the presence of antigen. Receptor clustering is independent of endoplasmic reticulum vesiculation, which occurs only at ionomycin concentrations >1 μM, and maximal clustering responses are dependent on the presence of extracellular calcium. InsP3 receptor aggregation may be a characteristic cellular response to Ca2+-mobilizing ligands, because similar results are seen after activation of phospholipase C-linked G-protein-coupled receptors; cholecystokinin causes type II receptor redistribution in rat pancreatoma AR4–2J cells, and carbachol causes type III receptor redistribution in muscarinic receptor-expressing hamster lung fibroblast E36M3R cells. Stimulation of these three cell types leads to a reduction in InsP3 receptor levels only in AR4–2J cells, indicating that receptor clustering does not correlate with receptor down-regulation. The calcium-dependent aggregation of InsP3 receptors may contribute to the previously observed changes in affinity for InsP3 in the presence of elevated Ca2+ and/or may establish discrete regions within refilled stores with varying capacity to release Ca2+ when a subsequent stimulus results in production of InsP3.
INTRODUCTION
Cross-linking the immunoglobulin E (IgE)-primed Fcε receptor 1 (FcεR1) of rat basophilic leukemia (RBL-2H3) cells leads to Lyn-mediated phosphorylation of immunoreceptor tyrosine activation motifs within the cytoplasmic tails of FcεR1 β and γ subunits, followed by recruitment and activation of the tyrosine kinase Syk (reviewed in Benhamou, 1997). This initial kinase activation results in stimulation of two isoforms of phospholipase C-γ, PLCγ1 and PLCγ2, and leads to elevated levels of inositol 1,4,5-trisphosphate (InsP3) that are sustained over prolonged periods (>10–15 min) of cross-linking (reviewed in Wilson et al., 1997). Previous evidence has shown that phosphatidylinositol 3-kinase supports the activation and phosphorylation of PLCγ1 and is required for maximal InsP3 synthesis (Barker et al., 1995, 1998). Under optimal cross-linking conditions, intracellular Ca2+ stores are rapidly depleted and do not refill (R.J. Lee et al., 1997). Concomitant Ca2+ influx supports a persistent elevation in cytoplasmic Ca2+. Influx occurs primarily via the capacitative Ca2+ pathway (Fasolato, et al., 1993), although there is evidence that a second Ca2+ influx pathway also participates in Ca2+ entry into antigen-stimulated RBL-2H3 cells (Lee and Oliver, 1995). Importantly, sustained elevations in cytoplasmic Ca2+ are absolutely required for secretion of histamine, serotonin, and other preformed mediators of the allergic response (Beaven et al., 1984; Stump et al., 1987).
Mobilization of intracellular calcium stores is mediated by InsP3 receptors, of which there are three closely related types (reviewed in Joseph, 1996). Although most evidence supports the endoplasmic reticulum (ER) as the principal localization site for InsP3 receptors (Mignery et al., 1989; Ross et al., 1989; Satoh et al., 1990), there are reports of InsP3 receptor isoforms residing in additional locations, including the plasma membrane (Kuno and Gardner, 1987; Fujimoto et al., 1992; Khan et al., 1992) and perhaps secretory granules (Gerasimenko et al., 1996). There is also evidence for concentrations of InsP3 receptors near the lumenal borders of polarized cells, including intestinal epithelium (Maranto, 1994), and pancreatic and salivary gland acinar cells (M.G. Lee et al., 1997; Yule et al., 1997). The molecular basis for this variability in intracellular localization is currently unresolved but is likely to be determined by undefined protein sorting motifs within the nonhomologous portions of the InsP3 receptor isoforms. Because the distribution of InsP3 receptors has profound implications for the interpretation of calcium responses in nonexcitable cells, it is important to define both the abundance and localization of specific isoforms in commonly used model systems.
Ferris et al. (1989) and Perez et al. (1997) have shown that incorporation of purified receptors into lipid vesicles is sufficient to reconstitute InsP3-mediated Ca2+ release, providing proof that InsP3 receptors act as ligand-gated Ca2+ channels. InsP3 receptors can be regulated in a number of ways. First, they contain binding sites for Ca2+ (Sienaert, et al., 1997), and elevations in free Ca2+ from nanomolar to micromolar concentrations can modify receptor properties. Thus a rise in Ca2+ from 0.1 nM to 0.7 μM converts hepatocyte InsP3 receptors from a low-affinity, high-conductance channel to a high-affinity, low-conductance channel (Pietri et al., 1990). Similar results have been reported in RBL cells (Watras, et al., 1994) but not cerebellum membranes (Worley et al., 1987) or several other cell types (see Yoneshima et al., 1997, and references therein). Recent work suggests that this variation results from the tissue-specific distribution of InsP3 receptor types; Yoneshima et al. (1997) found that micromolar Ca2+ increases the ligand-binding affinity of recombinant type III InsP3 receptors but has the opposite effect on the ligand-binding affinity of type I InsP3 receptors. Second, InsP3 receptor concentration can be modified by “down-regulation” in response to chronic activation of certain PLC-linked cell surface receptors (Wojcikiewicz, et al., 1994). When this adaptation is initiated, it leads to an 80–90% reduction in InsP3 receptor levels within 1–2 h, is dependent on the integrity of Ca 2+ stores, and is attributable to accelerated receptor proteolysis (Wojcikiewicz, et al., 1994, 1995), via either a calcium-dependent cysteine protease (Wojcikiewicz and Oberdorf, 1996) or the ubiquitin/proteosome pathway (Bokkala and Joseph, 1997).
An intriguing feature of the InsP3 receptors is their ability to release incremental fractions of Ca2+ from intracellular stores in response to repetitive, submaximal concentrations of InsP3 (Muallem, et al., 1989; Kindman and Meyer, 1993). The mechanisms underlying this unusual property, referred to as “quantal release,” are unknown but have been variously attributed to receptor desensitization or to stepwise mobilization of Ca2+ from discrete stores (see Beecroft and Taylor, 1997, and references therein). However, studies of Ca2+ transport in vesicles containing reconstituted receptors suggest that it is a fundamental property of the receptor (Ferris, et al., 1992), and Keizer and colleagues (1995, review) have proposed a model whereby repetitive increments raise the height of the bell-shaped dependence of the InsP3-gated channel for cytoplasmic Ca2+. Understanding the complex nature of Ca2+ store regulation must now take into account new evidence that the sarcoplasmic reticulum and ER may be organized into distinct compartments of Ca2+ stores (Golovina and Blaustein, 1997), possibly governed by the unequal distribution of calcium-binding proteins and transporters (Simpson et al., 1997). A recent report using the RBL-2H3 model system suggests that depletion of Ca2+ stores in the presence of extracellular Ca2+ leads to restricted diffusion of an ER lumenal marker (Subramanian and Meyer, 1997).
Here, we show that FcεR1 cross-linking and other calcium-mobilizing treatments cause a rapid and progressive aggregation of type II InsP3 receptors within the ER of RBL-2H3 cells and that maximal aggregation requires Ca2+ influx to sustain elevations in intracellular Ca2+. We also show that Ca2+ mobilization mediated by G-protein-coupled receptors induces clustering of type II receptors in AR4–2J rat pancreatoma cells and of type III receptors in E36M3R Chinese hamster lung cells. We speculate that calcium-induced aggregation of InsP3 receptors may underlie some of the previously observed Ca2+-induced changes in receptor properties. Furthermore, redistribution of receptors could contribute to the organization of refilled stores into InsP3-sensitive and -insensitive compartments.
MATERIALS AND METHODS
Materials
FITC- and cyanin 3 (Cy3)-conjugated secondary antibodies were from Jackson ImmunoResearch (West Grove, PA). Dinitrophenol-conjugated bovine serum albumin (DNP-BSA) was purchased from Molecular Probes (Eugene, OR); ionomycin was from Calbiochem (San Diego, CA); and thapsigargin, carbachol, cholecystokinin (CCK), and phorbol 12-myristate 13-acetate (PMA) were from Sigma (St. Louis, MO). DNP-specific IgE was purified from mouse ascites containing the H1-DNAP-ε-26-82 hybridoma (Liu et al., 1980). Culture reagents for RBL-2H3 cells were from HyClone (Logan, UT), and those for AR4–2J and E36M3R cells were from Life Technologies, Inc. (Grand Island, NY). Affinity-purified rabbit CT1 and CT2 antibodies, which recognize types I and II InsP3 receptors respectively, were prepared as previously described (Wojcikiewicz, 1995). Mouse monoclonal antibody to the type III InsP3 receptor (TLIII) was purchased from Transduction Laboratories (Lexington, KY).
Cell Culture and Activation
RBL-2H3 cells were cultured on tissue culture flasks in MEM supplemented with 15% fetal calf serum, penicillin-streptomycin, and l-glutamine. In most experiments, IgE receptors were primed by the addition of anti-DNP-IgE (1 μg/ml) for 12–20 h. Cells were then washed to remove excess IgE and activated by the addition of 1 μg/ml polyvalent antigen DNP-BSA at 37°C. Alternatively, cells were activated for 10 min with the Ca2+-mobilizing agents ionomycin (1 or 5 μM) and thapsigargin (250 nM). Assays were performed in Hank’s BSA buffer (125 mM NaCl, 5 mM KCl, 0.7 mM Na2HP04, 0.7 mM NaH2PO4, 15 mM NaHCO3, 5.5 mM glucose, 0.75 mM MgCl2, 1.8 mM CaCl2, and 0.05% BSA).
ARJ-2J rat pancreatoma cells were cultured as described (Wojcikiewicz, 1995). E36M3R cells were derived from E36 Chinese hamster lung cells (Kulka et al., 1988) by transfection with human m3-muscarinic receptor cDNA in a pcDNA3 vector. Transfected cells were selected in 1 mg/ml Geneticin, and m3 receptor expression was confirmed by measuring the ability of carbachol to induce increases in intracellular Ca2+ concentration. These cells were cultured in DMEM supplemented with 10% fetal calf serum, antibiotics, nonessential amino acids, and 0.5 mg/ml Geneticin.
Western Blotting
Suspension cultures of IgE-primed RBL-2H3 cells were harvested, resuspended in warm Hank’s BSA buffer (1 × 10⁷ cells/ml), and incubated at 37°C for indicated times plus or minus stimulus with DNP-BSA. Tubes containing the cell suspensions were transferred to a tray of ice and washed immediately with ice-cold PBS by low-speed centrifugation, and tubes containing cell pellets were rapidly frozen by immersion in liquid nitrogen. Monolayers of E36M3R cells were incubated with or without carbachol and were harvested with 155 mM NaCl, 10 mM HEPES, and 1 mM EDTA (pH 7.4). Cells were then homogenized in ice-cold hypotonic buffer [10 mM Tris, 1 mM EGTA, 0.2 mM PMSF, 1 mM dithiothreitol, 10 μM leupeptin, 10 μM pepstatin, and 0.2 μM soybean trypsin inhibitor (pH. 7.4)]. Membranes were collected by centrifugation (16,000 × g at 4°C for 10 min) and resuspended in hypotonic buffer for protein determination. Samples were immunoblotted as described (Wojcikiewicz, 1995).
Sucrose Density Gradients
Suspension cultures of IgE-primed RBL-2H3 cells were harvested (60 × 106 cells), resuspended in warm Hank’s BSA buffer, and incubated at 37°C for 10 min with or without 1 μg/ml DNP-BSA. Cell pellets were lysed in 200 μl of 50 mM Tris buffer (pH 8.3) containing 1 mM EDTA, 1% CHAPS, and 1 mM PMSF. Insoluble material was collected by microcentrifugation at 4°C and the supernatants were loaded on 5–20% sucrose gradients prepared in 50 mM Tris (pH 8.3), 1 mM EDTA, and 0.5% CHAPS. Tubes were centrifuged at 160,000 × g at 4°C for 4 h in Beckman (Fullerton, CA) Optima TL ultracentrifuge using a TLS 55 rotor. Thirteen fractions of 150 μl each were collected into clean tubes; 20 μl of 8× Laemmli sample buffer were added; and the samples were boiled for 5 min. Aliquots (80 μl) were analyzed by SDS-PAGE (5% gels) followed by immunoblotting as described (Wojcikiewicz, 1995). Negatives were scanned using a Hamamatsu (Bridgewater, NJ) camera interfaced to a Compix (Cranberry Township, PA) imager processor. One-dimensional gel analysis was performed using Compix Simple software.
Immunofluorescence Labeling of InsP31 receptors and Immunoglobulin-binding Protein (BiP)
For fluorescence microscopy, monolayers of RBL-2H3 cells on glass coverslips were activated for specified times at 37°C in Hank’s BSA or medium with DNP-BSA, ionomycin, or thapsigargin. In some experiments, coverslips were coated with fibronectin. In some cases, Ca2+ was omitted from the Hank’s BSA buffer to stimulate cells in nominally Ca2+-free medium (Lee and Oliver, 1995). Cells were fixed for 10 min with 2% paraformaldehyde in PBS (pH 7.4), followed by 10 min permeabilization with 0.1% Triton X-100. The coverslips were washed in PBS and incubated sequentially with primary antibodies (1 μg/ml peptide affinity-purified CT2 or 1 μg/ml monoclonal anti-BiP; StressGen, Victoria, British Columbia, Canada), followed by FITC-conjugated anti-mouse antibodies or Cy3-conjugated anti-rabbit antibodies. Antibody solutions included 1% BSA (Ig-free BSA, Sigma). Where stated, blocking peptide was included with CT2 antibodies at 10 μg/ml. Coverslips were mounted on slides using Vectashield (Vector Laboratories, Burlingame, CA) and photographed using a Zeiss (Thornwood, NY) Photomicroscope III equipped for epifluorescence microscopy. Matched exposure times (60 or 90 s) were used to normalize photographs within a single experiment. For image analysis, data were acquired using a Photometrics (Huntington Beach, CA) CH250 charge-coupled device camera interfaced to a Compix image processor. Cells were marked by hand and thresholded to locate bright spots corresponding to receptor aggregates, and the number of spots per cell was determined using Compix Simple software. For double-labeling experiments, samples were photographed using a Nikon (Garden City, NY) Optiphot equipped with a triple cube fluorescence filter (ChromaLabs) or, alternatively, analyzed by confocal microscopy using a Bio-Rad (Richmond, CA) MRC 600 microscope. For flow cytometry, suspension cultures were incubated with or without DNP-BSA followed by identical fixation and staining protocols using CT2 antibodies, as described above. Fluorescence intensity for FITC labeling of type II InsP3 receptors was quantified using a Coulter (Hialeah, FL) Elite flow cytometer.
For AR4–2J and E36M3R cells, methods were essentially identical, except that cells were stimulated in normal culture medium and were then fixed with 3.6% paraformaldehyde (Acros Organics, New Brunswick, NJ) buffered in Dulbecco’s PBS with Ca2+ and Mg2+. Subsequent steps were performed in Ca2+- and Mg2+-free PBS; cells were permeabilized with 0.2% Triton X-100 for 10 min, washed, and incubated for 1 h with CT2 and TLIII antibodies, respectively, plus 10% fetal calf serum followed by rhodamine-conjugated donkey secondary antibodies (Chemicon, Temecula, CA), also in 10% fetal calf serum. Coverslips were rinsed, mounted in 90% glycerol/0.1% p-phenylenediamine, and photographed using a Nikon Microphot-FXA fluorescence microscope. Negatives were scanned with a Polaroid SprintScan 35 and compiled with Adobe 3.0 software.
Transmission Electron Microscopy (TEM)
Suspension cultures of RBL-2H3 cells were incubated for 10 min at 37°C in medium with DNP-BSA (1 μg/ml), ionomycin (1 or 5 μM), or no stimulus. Cells were fixed with 2% glutaraldehyde in cacodylate buffer (pH 7.4) and processed for TEM as described by Pfeiffer et al. (1985). Samples were analyzed and photographed using a Hitachi (Mountain View, CA) 600 transmission electron microscope.
RESULTS
InsP3 Receptor isoform expression in RBL-2H3 cells
It has been inferred from previous analyses of mRNA levels that RBL-2H3 cells express type I–III InsP3 receptors with the type II (and perhaps a closely related species) constituting ∼70% of total (De Smedt et al., 1994; Parys et al. 1995). A more recent report indicates that the entirety of this 70% is type II receptor (De Smedt et al., 1997). We confirmed this by immunoblotting RBL-2H3 cell membrane preparations in a manner that allows for quantitation of InsP3 receptors (Wojcikiewicz, 1995); the results indicate that the relative abundance of type I, II, and III receptors is ∼10, 70, and 20%, respectively (our unpublished observations).
Type II InsP3 Receptors Colocalize with an ER Marker in Resting RBL-2H3 Cells
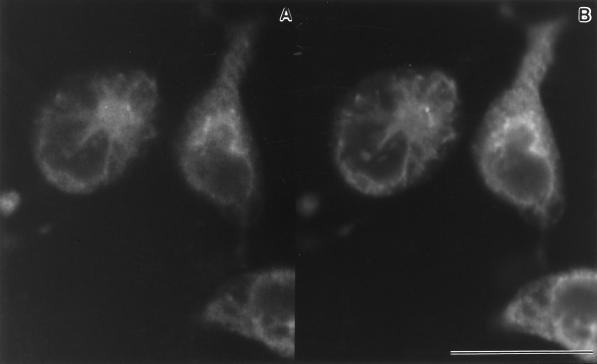
We used immunofluorescence labeling and confocal microscopy to identify the intracellular localization of type II InsP3 receptors in resting RBL-2H3 cells. Type I and III receptors were too scarce for detection by immunofluorescence methods. As shown in Figure 1A, a fine reticular pattern is seen in cells stained with CT2 antibodies, which recognize a unique C-terminal sequence in type II InsP3 receptors, followed by anti-rabbit Cy3-conjugated secondary antibodies. Immunoreactivity is also seen along the nuclear envelope, which is contiguous with the ER. To unequivocably identify these structures as the ER, cells were double labeled with monoclonal antibodies to BiP, a member of the heat shock protein 70 family of chaperones and an ER resident protein (Hass, 1994; Figure 1B). The reticular patterns are identical and indicate that the type II InsP3 receptor typically has a diffuse distribution within the ER of resting RBL-2H3 cells.
Figure 1.
Colocalization of type II InsP3 receptors and BiP in the ER of RBL-3H3 cells. (A) Confocal image showing cells fixed, permeabilized, and stained with CT2 polyclonal antibodies against the type II InsP3 receptor, followed by Cy3-conjugated secondary antibodies. (B) Confocal image of the same field double labeled with monoclonal antibodies to the ER resident protein BiP, followed by FITC-conjugated secondary antibodies. Bar, 25 μm.
Type II InsP3 Receptors Form Large Clusters after Stimulation of RBL-2H3 Cells with Calcium-mobilizing Agents
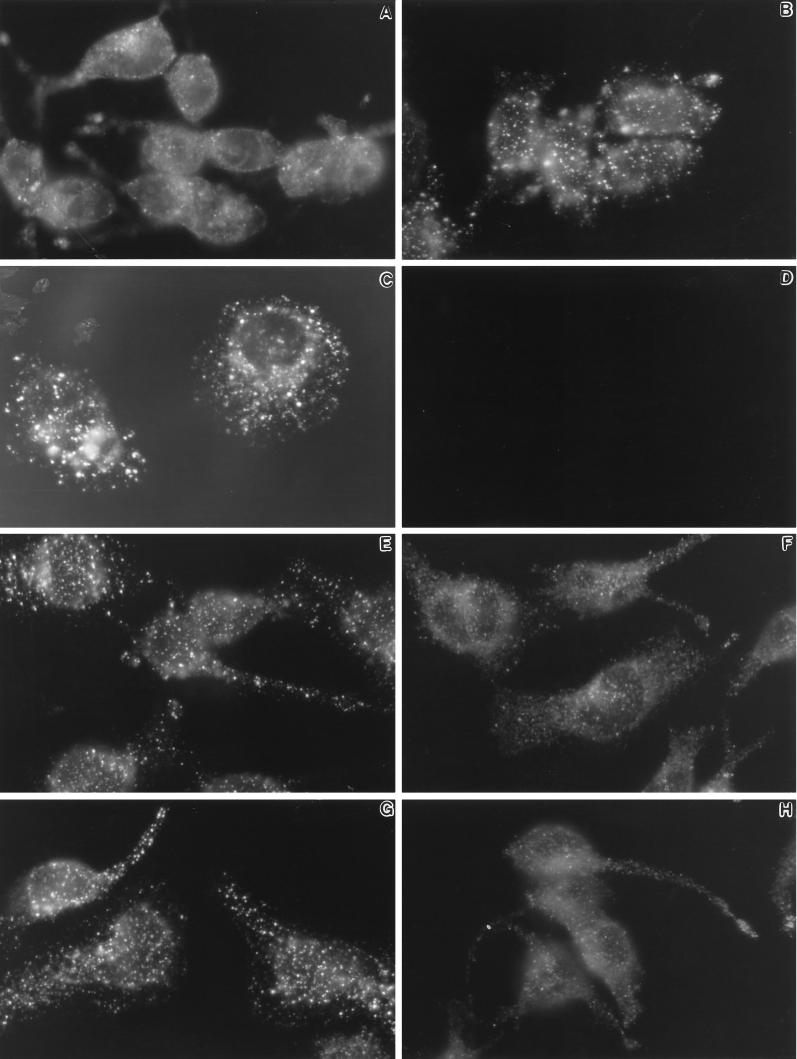
As shown in Figure 2, there is a dramatic change in the appearance of type II InsP3 receptors after activation of RBL-2H3 cells with antigen, which cross-links FcεR1, or with the calcium-mobilizing agents ionomycin and thapsigargin. Figure 2A shows the typical diffuse pattern for type II InsP3 receptors in the rounded and poorly adherent resting RBL-2H3 cell, as seen by epifluorescence analysis of whole cells. In resting cells, there are consistently a few brightly labeled spots suggestive of small aggregates. After 10 min (Figure 2B) or 1 h (Figure 2C) of antigen stimulation, RBL-2H3 cells dramatically up-regulate their adhesive properties and spread. Here, the type II InsP3 receptors are seen in large clusters, concentrating around the nuclear envelope and dispersed throughout the cytoplasm. The pattern is specific for type II InsP3 receptors, because it is abolished by the presence of immunizing peptide during incubation with CT2 (Figure 2D). Similar patterns of receptor clustering are seen in cells treated for 10 min with 1 μM ionomycin (Figure 2E) or 250 nM thapsigargin (Figure 2G). These agents fail to stimulate cell adhesion and spreading, indicating that clustering is not dependent on morphological changes that accompany antigen stimulation. However, the clustering of type II InsP3 receptors is largely prevented if cells are activated with ionomycin (Figure 2F), thapsigargin (Figure 2H), or antigen (our unpublished observations) in the absence of extracellular calcium. These results suggest that Ca2+ influx is specifically necessary for type II InsP3 receptor redistribution.
Figure 2.
Changes in distribution of type II InsP3 receptors after activation of RBL-2H3 cells. Cells were grown on glass coverslips and fixed before (A) or after (B–H) incubation at 37°C with calcium-mobilizing agents, followed by permeabilization and staining with CT2 antibodies and Cy3-conjugated secondary antibodies. Cells in B and C were primed with DNP-specific IgE, washed, and stimulated for 10 min or 1 h, respectively, with DNP-BSA (1 μg/ml). The coverslip shown in D was treated identically to that in B, except that immunizing peptide was added during incubation with CT2 primary antibodies. Cells in E and F were incubated for 10 min with 1 μM ionomycin with (E) or without (F) extracellular calcium. Cells in G and H were incubated for 10 min with 250 nM thapsigargin with (G) or without (F) extracellular calcium. Results are representative of at least four separate experiments.
Binding of Type II InsP3 Receptor Antibodies Is Not Affected by Activation State
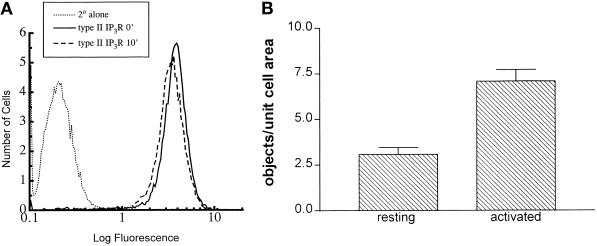
The intensely bright spots labeled with antibodies to type II InsP3 receptors in activated cells raised the possibility that epitope unmasking could potentially enhance the binding of CT2 antibodies to target receptors. To rule out this possibility, suspension cultures of RBL-2H3 cells were activated, fixed, permeabilized, and stained using protocols identical to those for microscopy. Their fluorescence intenstiy was measured by flow cytometry. As shown in Figure 3A, there was no increase in the overall intensity of CT2 labeling in activated cells, compared with resting RBL-2H3 cells. Indeed, the slight downward shift in the mean intensity of label for antigen-stimulated cells is possibly attributible to quenching of signal within large clusters.
Figure 3.
(A) Total immunofluoresence labeling of RBL-2H3 cells with CT2 antibodies does not change after antigen stimulation. Suspension cultures of DNP-specific, IgE-primed RBL-2H3 cells were fixed before (dotted and solid lines) or after (dashed line) 10-min activation with antigen (1 μg/ml DNP-BSA). Permeabilized cells were stained with CT2 antibodies directed at type II InsP3 receptors (solid and dashed lines), followed by FITC-conjugated secondary antibodies, or with secondary antibody alone (dotted line). Fluorescence was quantitated by flow cytometry. (B) Receptor aggregates increase after antigen stimulation. Coverslips were prepared as described in the legend to Figure 2 and documented using a Zeiss Photomicroscope III equipped with a computer-interfaced Photometrics charge-coupled device camera. Images were acquired for a minimum of 15 fields, totaling >70 cells for each condition. Image analysis was performed using Compix Simple software. Cell boundaries were manually defined in each field, and a threshold was set for object recognition using the Sobel function. Data are expressed as objects per unit area ± SEM; significance was determined using the unpaired t test (p < 0.0001).
Receptor Aggregates Increase in Number after Antigen Stimulation in RBL-2H3 Cells
We used digital image analysis to confirm the visual perception of receptor aggregation. Resting cells were compared with cells stimulated for 10 min with antigen. Results of this analysis show approximately three times more intensely bright spots corresponding to receptor clusters in antigen-stimulated cells in comparison with resting cells (Figure 3B).
Changes in the ER Follow Calcium Mobilization in RBL-2H3 Cells
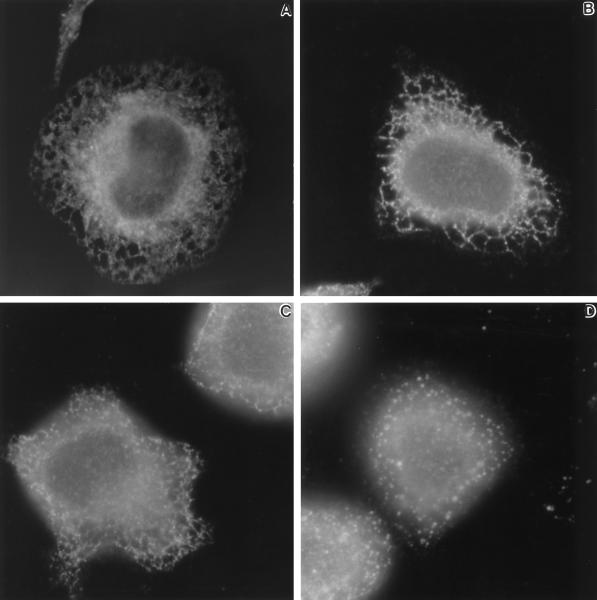
Earlier reports have suggested that prolonged treatment with calcium ionophores can lead to profound changes in the ER, including vesiculation and restricted diffusion of ER resident proteins (Koch et al., 1988; Subramanian and Meyer, 1997). We used antibodies to BiP to analyze the integrity and general morphology of the ER by immunofluorescence microscopy. As shown in Figure 4A, the ER of resting RBL-2H3 cells comprises a fine meshwork of interconnecting tubules. After 10 min of stimulation with antigen (Figure 4B, 1 μg/ml DNP-BSA) or with ionomycin (Figure 4C, 1 μM), BiP staining within the ER tubules has a coarser appearance and often resembles beads on a string. Vesiculation of the ER was not observed with antigen stimulation and only rarely seen after 1 μM ionomycin treatment. However, increasing the concentration of ionomycin to 5 μM had a profound effect on the ER. As shown in Figure 4D, this led to almost complete vesiculation of the ER within 10 min. Cell viability was also rapidly compromised at the higher ionomycin concentration (our unpublished observations).
Figure 4.
Distribution of BiP within the ER of DNP-specific IgE primed-RBL-2H3 cells before (A) or after 10 min at 37°C with 1 μg/ml DNP-BSA (B), 1 μM ionomycin (C), or 5 μM ionomycin (D). Cells were fixed, permeabilized, and labeled with anti-BiP antibodies as described in MATERIALS AND METHODS. Micrographs are representative of results at least three independent experiments.
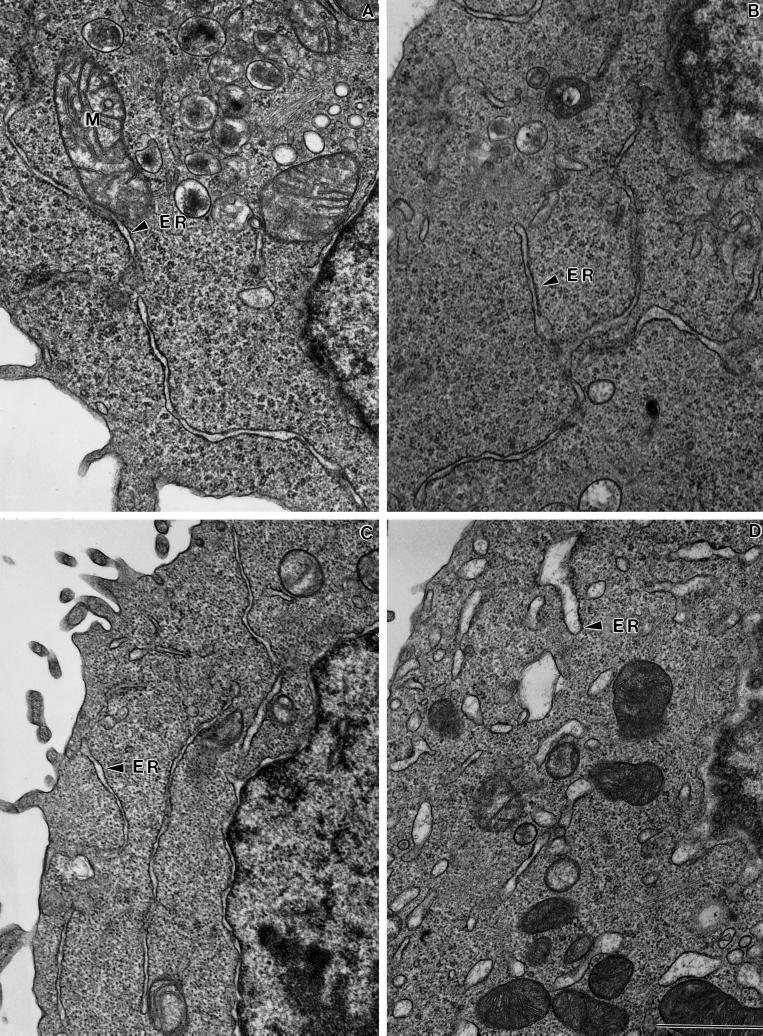
The general morphology of the ER was further documented by TEM. A typical thin section of a resting RBL-2H3 cell is shown in Figure 5A. The ER (Figure 5A, arrowhead) is seen as narrow ribbons that extend through the cytoplasm. Mitochondria (M) are frequently in very close opposition to the ER. Although immunofluorescence labeling of the ER marker BiP appears to be discontinous in cells treated with antigen (Figure 4, B and C), there is no gross change in the appearance of the ER in TEM sections after antigen stimulation (Figure 5B). This suggests that changes in protein mobility, and not a physical restriction, take place in the ER of antigen-stimulated cells. Similarly, although swelling of the ER was noted in a small fraction of cells treated with 1 μM ionomycin, the ERs in the majority of these cells were not markedly altered (Figure 5C). Finally, Figure 5D shows the vesiculation of the ER that occurs in RBL-2H3 cells treated for 10 min with high (5 μM) ionomycin concentrations.
Figure 5.
Morphology of the ER in DNP-specific IgE-primed RBL-2H3 cells before (A) or after stimulus for 10 min at 37°C with 1 μg/ml DNP-BSA (B), 1 μM ionomycin (C), or 5 μM ionomycin (D). Cells were fixed with glutaraldehyde and processed for TEM. M, mitochondria. Bar, 1 μm.
Clustered Type II InsP3 Receptors Are Distributed throughout the ER and the Nuclear Envelope
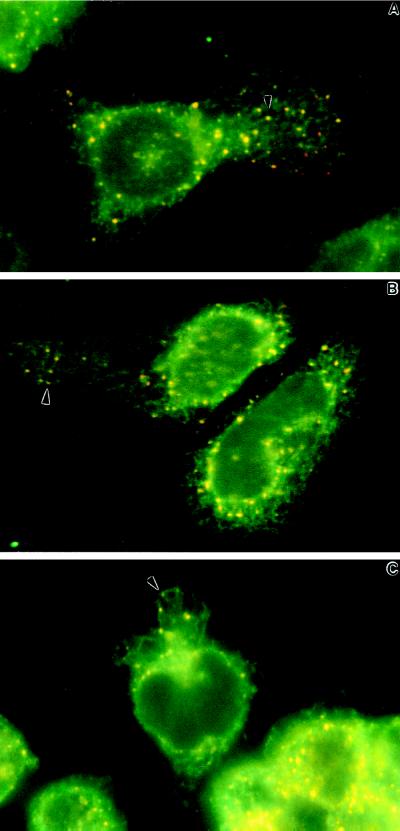
To confirm that the receptor clusters were still associated with the ER, we used double-labeling procedures to compare the distributions of type II InsP3 receptors and BiP in stimulated RBL-2H3 cells. Results are shown in Figure 6, A and B, for antigen-stimulated cells and Figure 6C for cells treated with 1 μM ionomycin. These photographs clearly document that InsP3 receptor clusters (yellow and red) are dispersed along the ER network (green), as well as concentrated along the nuclear envelope. Arrowheads point to examples of individual clusters that align with an ER tubule. These data show that InsP3 receptors do not require massive ER vesiculation for aggregation but do not rule out the possibility that aggregates pinch off from the ER to form small ER-associated vesicles resembling the calciosomes previously described by others (Hashimoto et al. 1988; Volpe et al., 1988).
Figure 6.
Clustered type II InsP3 receptors align with ER tubules in activated RBL-2H3 cells. Cells were grown on coverslips, primed with DNP-specific IgE, and incubated for 10 min at 37°C with 1 μg/ml DNP-BSA (A and B) or 1 μM ionomycin (C). Cells were fixed and doubled labeled with CT2 polyclonal antibodies and Cy3-conjugated secondary antibodies together with anti-BiP monoclonal antibody and FITC-conjugated secondary antibodies. Arrowheads point to examples of receptor clusters on ER tubules that extend into the cell periphery.
Receptor Clustering Is a Characteristic Feature of InsP3 Receptors in Activated Cells
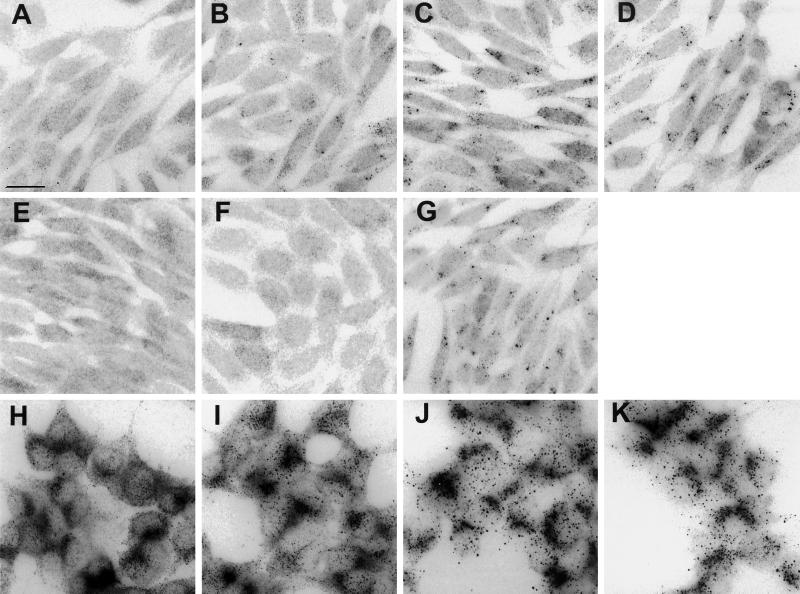
We also sought to determine whether InsP3 receptors were redistributed after activation of G-protein-coupled receptors. For these studies we examined E36M3R cells, which express predominantly type III InsP3 receptors and which, by virtue of being transfected with human m3-muscarinic receptor cDNA, mobilize calcium in response to carbachol (Wojcikiewicz, unpublished data). We also examined AR4–2J cells, which express predominantly type II receptor (Wojcikiewicz, 1995) and mobilize Ca2+ in response to CCK (Simeone et al., 1995). Figure 7A shows that type III receptors are distributed diffusely in resting E36M3R cells. Figure 7, B–D, shows that exposure to carbachol for 10–60 min leads to receptor clustering. This effect was maximal by 30 min, was blocked by atropine (Figure 7E), was reversed 30 min after withdrawal of carbachol, and was not seen in untransfected carbachol-treated E36 cells (our unpublished results), indicating that it is muscarinic receptor mediated. The effect of carbachol was not mimicked by PMA (Figure 7F) but was mimicked by thapsigargin (Figure 7G), indicating that release of Ca2+ from intracellular stores is critical to this process.
Figure 7.
InsP3 receptor clustering in E36M3R and AR4–2J cells. Cells were stimulated, fixed, and permeabilized and then incubated with antibodies against type II or III InsP3 receptors and rhodamine-conjugated secondary antibodies. (A–G) E36M3R cells stained for type III receptor after exposure to 1 mM carbachol for 0 min (A), 10 min (B), 30 min (C), and 60 min (D) or for 60 min to 1 mM carbachol plus 10 μM atropine (E). Alternatively, E36M3R cells were treated with 400 nM PMA (F) or 2 μM thapsigargin (G). (H–K) AR4–2J cells stained for type II receptor after exposure to 0.5 μM CCK for 0 min (H), 10 min (I), 30 min (J), and 60 min (K). Micrographs shown are representative of at least two independent experiments. Bar, 20 μm.
Activation of AR4–2J cells with CCK (Figure 7, H–K) showed a similar response to that seen in E36M3R cells, except that in addition to receptor clustering there was a gradual loss in intensity of immunofluorescence staining, as predicted based on previous evidence that InsP3 receptors are down-regulated in these cells after prolonged stimulus (Wojcikiewicz, 1995).
Receptor Clustering Does Not Correlate with Degradation of InsP3 Receptors
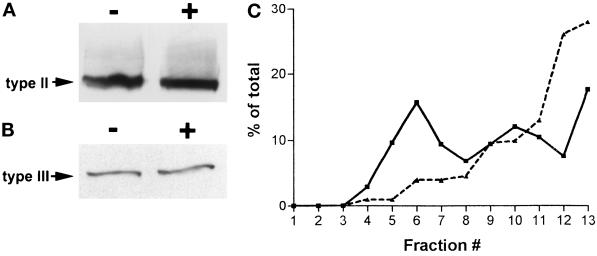
We next examined the possibility that receptor clustering correlates with, and perhaps leads to, InsP3 receptor down-regulation by degradation. For these experiments, RBL-2H3 and E36M3R cells were stimulated with either antigen or carbachol, membrane fractions were prepared, and levels of InsP3 receptors were determined by SDS-PAGE and Western blotting. As shown in Figure 8, there is no apparent relationship between the ability of agonists to stimulate receptor clustering and receptor degradation. After 2 h of exposure to antigen, there is no change in type II InsP3 receptor levels in RBL-2H3 cells (Figure 8A). Similarly, 4 h of exposure to carbachol stimulation fails to alter type III InsP3 receptor levels in E36M3R cells (Figure 8B). Thus, of the three cell types examined here, only stimulation of AR4–2J pancreatic cells leads to down-regulation of InsP3 receptors (Wojcikiewicz, 1995).
Figure 8.
Analyses of receptor levels and aggregation. (A) Membranes were prepared from anti-DNP IgE-primed RBL-2H3 cells incubated without (−) or with (+) antigen (1 μg/ml DNP-BSA) for 2 h. Proteins were separated by SDS-PAGE, transferred to nitrocellulose, and probed with anti-type II receptor antibody. (B) Membranes were prepared from E36M3R cells incubated without (−) or with (+) 1 mM carbachol for 4 h. Membrane proteins were separated by SDS-PAGE, transferred to nitrocelluose, and probed with anti-type III receptor antibody. (C) Sucrose density gradient analysis of stimulated receptor aggregation. RBL-2H3 cells were lysed in CHAPS buffer after 10 min of incubation without (solid line) or with (dashed line) antigen (1 μg/ml DNP-BSA). Cell lysates were clarified by microcentrifugation and loaded onto 5–20% sucrose gradients, followed by ultracentrifugation, as described in MATERIALS AND METHODS. Fractions were collected and analyzed by Western blotting and densitometry for the presence of type II Ins(1,4,5)P3 receptors. Data shown are representative of two independent determinations.
Clustered Receptors Migrate to a Denser Fraction in Sucrose Gradients
Biochemical analysis using sucrose density gradients provided additional evidence for receptor aggregration. For these experiments, cell lysates were prepared from CHAPS-solubilized RBL-2H3 cells before and after 10-min stimulation with antigen. Lysates were applied to 5–20% sucrose gradients, followed by Western blotting analysis of fractions collected from the gradient after ultracentrifugation. As shown in Figure 8C, type II Ins(1,4,5)P3 receptors from resting cells are found throughout the last 10 fractions of the gradient, with the highest levels in fraction 6 (15.8%) and fraction 13 (17.6%). These results suggest that resting RBL-2H3 cells contain a range of receptors in the partially aggregated and nonaggregated state and are consistent with observations of a few small clusters in these cells by fluorescence microscopy (Figure 2A) and with imaging analysis (Figure 3B). After antigen stimulation, there is a significant shift of receptors to the higher density fractions of the gradient, with the highest values in the densest fractions, 12 (26%) and 13 (28%).
DISCUSSION
In this report, we show that activation of PLC and Ca2+ mobilization via tyrosine kinase-associated receptors or G-protein-coupled receptors leads to InsP3 receptor clustering. In RBL-2H3 cells, cross-linking the tyrosine-coupled IgE receptor FcεR1 leads to progressive aggregation of InsP3 receptors within the ER and nuclear envelope of RBL-2H3 cells. In these cells, the clustering of InsP3 receptor is complete within 10 min of stimulus and persists for at least 1 h. Receptor aggregation is a calcium-dependent process, because it is initiated by treatment of cells with the calcium ionophore ionomycin, or when stores are emptied by the leak pathway in the presence of the SERCA Ca2+/ATPase pump inhibitor thapsigargin. Receptor clustering is incomplete in the absence of extracellular calcium, indicating that continous elevation of [Ca2+]i is a requirement.
InsP3 receptor clustering is also initiated by carbachol stimulation of E36M3R cells and by CCK stimulation of AR4–2J cells. Again, the clustering appeared to be dependent on stores depletion, because it was mimicked by thapsigargin. The time course of redistribution in these cell types (evident within 10 min and maximal at 30 min) was somewhat slower than that seen in RBL-2H3 cells, perhaps because of the difference in the class of cell surface receptor being stimulated. The mechanism for redistribution is not known. However, it is not altered by brefeldin A, which disrupts Golgi structure and blocks ER to Golgi transport, or by the actin- and microtubule-depolymerizing agents cytochalasin and colchicine (Oberdorf and Wojcikiewicz, unpublished observations). We speculate that depletion of Ca2+ stores and subsequent sustained elevations in cytoplasmic Ca2+ lead to receptor clustering because of a subtle reorganization of ER structure. Alternatively, clustering could be attributed to the Ca2+ binding properties of the InsP3 receptors and/or associated ER-resident proteins.
In RBL-2H3 cells, antigen or moderate concentrations of ionomycin (<1 μM) cause the finely networked ER to take on a coarser appearance. After Ca2+ mobilization, BiP staining appears beaded, as though there are regularly spaced constrictions in the tubules. Recently, Subramanian and Meyer (1997) found that 1 μM ionomycin caused a marked reduction in the diffusion of a green fluorescent protein-tagged elastase within the ER lumen of RBL-2H3 cells. These investigators hypothesized either that a persistent Ca2+ increase results in physical restrictions in the ER that limit lumenal diffusion or that the ER becomes fragmented into individual vesicles. Using TEM, we found no marked change in the appearance of the ER after antigen treatment (Figure 5). When used at a concentration of 1 μM, ionomycin also failed to induce gross changes in the ER in a majority of RBL-2H3 cells. Extensive vesiculation of the ER requires threefold to fivefold higher concentrations of ionomycin (Figures 4 and 5) and is accompanied by loss of adherence and cell viability. We note that the size and distribution of clustered InsP3 receptors in antigen-treated cells do not resemble the beaded appearance of BiP within the ER, suggesting that the two phenomena may not be related.
What is the significance of InsP3 receptor clustering? Early in the course of these experiments, we speculated that receptor clustering might be a prerequisite in the pathway leading to down-regulation of InsP3 receptors by proteolytic degradation (Wojcikiewicz et al., 1994). As shown in Figures 7 and 8, however, receptor redistribution is observed in RBL-2H3 cells and in E36M3R cells, which fail to rapidly degrade InsP3 receptors after calcium mobilization via tyrosine kinase- or G-protein-coupled pathways. In contrast, redistribution is seen in AR4–2J cells, in which profound InsP3 receptor down-regulation occurs (Wojcikiewicz, 1995). Thus receptor clustering does not appear to lead directly to degradation. Other possibilities can now be considered and experimentally addressed. Receptor clustering may directly affect InsP3 binding affinity and/or the open probability of the channel. Another intriguing possibility is that receptor aggregates form by association with additional ER constituents, which include calcium-binding proteins such as calreticulin and calsequestrin. Indeed, Simpson et al. (1997) showed recently that cultured rat oligodendrocytes contain patches of type II InsP3 receptors and calreticulin along cell processes. These patches are frequently associated with mitochondria. They propose that the patches represent specialized regions or microdomains that are capable of causing locally high concentrations of Ca2+ within the cytoplasm and potentially evoke Ca2+ waves or oscillatory behavior.
Finally, it seems reasonable to expect that conditions that limit diffusion of ER constituents may favor the trapping of aggregated InsP3 receptors within a small fraction of the ER subcompartments. If this is the case, it could result in the reorganization of the ER into domains with markedly different sensitivities to Ins(1,4 5)P3. Similar concepts were proposed by Mak and Foskett (1997) after patch-clamp electrophysiology of InsP3 receptors in oocyte outer nuclear membranes. In the latter study, a large fraction of patches (86%) contained no InsP3 receptor activity. Of the active patches detected, >50% contained multiple channels. These data strongly suggest that there are both single and clustered InsP3 receptors within the outer membrane of oocyte nuclei, as well as large regions of the membrane that lack functional receptors. Mak and Foskett (1997) suggest that, under submaximal concentrations of Ins(1,4,5)P3, clustering of InsP3 receptors could limit mobilization of Ca2+ to those stores where there is sufficiently high density of receptors to respond before channel inactivation. In contrast, partially emptied stores with low-density receptors might be expected to be a source of Ca2+ for mobilization by a subsequent stimulus. These interpretations may represent new considerations for models of incremental, or quantal, release of Ca2+.
ACKNOWLEDGMENTS
We thank Drs. J. Wallace [University of New Mexico (UNM) Neurosciences Department], M. Maimore (State University of New York Health Science Center), and M. Folsom (UNM Biology Department) for access to Nikon Optiphot, Nikon-FXA, and Bio-Rad Confocal microscopes, respectively. Other microscopy and cytometry experiments used shared instrumentation in the UNM Cancer Research and Treatment Center’s cytometry and microscopy facility and in the UNM School of Medicine’s electron microscopy facility. Dr. A. Tobin (University of Leicester, Leicester, United Kingdom) generously provided m3 receptor cDNA, and Dr. G. Strous (Utrecht University, Utrecht, the Netherlands) provided E36 cells. We thank Marina Martinez for technical assistance and R.J. Lee and S.A. Barker for helpful discussion. This work was supported by National Institutes of Health grants GM50562 (to B.S.W.), HL56384 and GM49814 (to J.M.O.), and DK49194 (to R.J.H.W.), a grant from the Sinsheimer Foundation (to R.J.H.W.), and a career development award to B.S.W. from a Howard Hughes Institutional Award to UNM School of Medicine.
REFERENCES
- Barker SA, Caldwell KK, Hall A, Martinez AM, Pfeiffer JR, Oliver JM, Wilson BS. Wortmannin blocks lipid and protein kinase activities associated with PI 3-kinase and inhibits a subset of responses induced by FcεR1 cross-linking. Mol Biol Cell. 1995;6:1145–1158. doi: 10.1091/mbc.6.9.1145. [DOI] [PMC free article] [PubMed] [Google Scholar]
- Barker SA, Caldwell KK, Pfeiffer JR, Wilson BS. Wortmannin-sensitive phosphorylation, translocation and activation of PLCγ1, but not PLCγ2, in antigen-stimulated RBL-2H3 mast cells. Mol Biol Cell. 1998;9:483–496. doi: 10.1091/mbc.9.2.483. [DOI] [PMC free article] [PubMed] [Google Scholar]
- Beaven MS, Roger J, Moore JP, Hesketh TR, Smith GA, Metcalfe JC. The mechanisms of the calcium signal and correlation with histamine release in 2H3 cells. J Biol Chem. 1984;259:7129–7136. [PubMed] [Google Scholar]
- Beecroft MD, Taylor CW. Incremental Ca2+ mobilization by inositol trisphosphate receptors is unlikely to be mediated by their desensitization or regulation by luminal or cytosolic Ca2+ Biochem J. 1997;326:215–220. doi: 10.1042/bj3260215. [DOI] [PMC free article] [PubMed] [Google Scholar]
- Benhamou M. FcεR1-induced protein tyrosine phosphorylation. In: Hamawy MM, editor. IgE Receptor (FcεRI) Function in Mast Cells and Basophils. Austin, TX: R.G. Landes Co.; 1997. pp. 33–54. [Google Scholar]
- Bokkala S, Joseph SK. Angiotensin II-induced down-regulation of inositol trisphosphate receptors in WB rat liver epithelial cells. Evidence for involvement of the proteasome pathway. J Biol Chem. 1997;272:12454–12461. doi: 10.1074/jbc.272.19.12454. [DOI] [PubMed] [Google Scholar]
- De Smedt H, Missiaen L, Parys JB, Bootman MD, Mertens L, Vand Den Bosch L, Casteels R. Determination of relative amounts of inositol trisphosphate receptor mRNA isoforms by ratio polymerase chain reaction. J Biol Chem. 1994;269:21691–21698. [PubMed] [Google Scholar]
- De Smedt H, Missiaen L, Parys JB, Henning RH, Sienaert I, Vanlingen S, Gijsens A, Himpens B, Casteels R. Isoform diversity of the inositol trisphosphate receptor in cell types of mouse origin. Biochem J. 1997;322:575–583. doi: 10.1042/bj3220575. [DOI] [PMC free article] [PubMed] [Google Scholar]
- Fasolato C, Hoth M, Penner R. A GTP-dependent step in the activation mechanism of capacitative calcium influx. J Biol Chem. 1993;268:20737–20740. [PubMed] [Google Scholar]
- Ferris CD, Huganir RL, Supattapone S, Snyder SH. Purified inositol 1,4,5-trisphosphate receptor mediates calcium flux in reconstituted lipid vesicles. Nature. 1989;342:870–889. doi: 10.1038/342087a0. [DOI] [PubMed] [Google Scholar]
- Ferris D, Cameron AM, Huganir RL, Snyder SH. Quantal calcium release by purified reconstituted inositol 1,4,5-trisphosphate receptors. Nature. 1992;356:350–352. doi: 10.1038/356350a0. [DOI] [PubMed] [Google Scholar]
- Fujimoto T, Nakade S, Miyawaki A, Mikoshiba K, Ogawa K. Localization of inositol 1,4,5-trisphosphate receptor-like protein in plasmalemmal caveolae. J Cell Biol. 1992;119:1507–1513. doi: 10.1083/jcb.119.6.1507. [DOI] [PMC free article] [PubMed] [Google Scholar]
- Gerasimenko OV, Gerasimenko JV, Belan PV, Peterson OH. Inositol trisphosphate and cyclic ADP-ribose-mediated release of Ca2+ from single isolated pancreatic zymogen granules. Cell. 1996;84:472–480. doi: 10.1016/s0092-8674(00)81292-1. [DOI] [PubMed] [Google Scholar]
- Golovina VA, Blaustein MP. Spatially and functionally distinct Ca2+ stores in sarcoplasmic and endoplasmic reticulum. Science. 1997;275:1643–1648. doi: 10.1126/science.275.5306.1643. [DOI] [PubMed] [Google Scholar]
- Hashimoto S, Bruno B, Lew DP, Pozzan T, Volpe P, Meldolesi J. Immunocytochemistry of calciosomes in liver and pancreas. J Cell Biol. 1988;107:2524–2531. doi: 10.1083/jcb.107.6.2523. [DOI] [PMC free article] [PubMed] [Google Scholar]
- Hass IG. BiP(GRP78), an essential HSP70 resident protein in the endoplasmic reticulum. Experientia. 1994;50:1012–1020. doi: 10.1007/BF01923455. [DOI] [PubMed] [Google Scholar]
- Joseph SK. The inositol trisphosphate receptor family. Cell Signal. 1996;8:1–7. doi: 10.1016/0898-6568(95)02012-8. [DOI] [PubMed] [Google Scholar]
- Keizer J, Li Y-X, Stojilkovic S, Rinzel J. InsP3-induced Ca2+ excitability of the endoplasmic reticulum. Mol Biol Cell. 1995;6:945–951. doi: 10.1091/mbc.6.8.945. [DOI] [PMC free article] [PubMed] [Google Scholar]
- Kindman LA, Meyer T. Use of intracellular Ca2+ stores from rat basophilic leukemia cells to study the molecular mechanism leading to quantal Ca2+ release by inositol 1,4,5-trisphosphate. Biochemistry. 1993;32:1270–1277. doi: 10.1021/bi00056a011. [DOI] [PubMed] [Google Scholar]
- Khan AA, Steiner JP, Klein MG, Schneider MF, Snyder SH. IP3 receptor: localization to plasma membrane of T cells and cocapping with the T cell receptor. Science. 1992;257:815–818. doi: 10.1126/science.1323146. [DOI] [PubMed] [Google Scholar]
- Koch GLE, Booth C, Wooding FBP. Dissociation and reassembly of the endoplasmic reticulum. J Cell Sci. 1988;91:511–522. doi: 10.1242/jcs.91.4.511. [DOI] [PubMed] [Google Scholar]
- Kulka RG, Raboy B, Schuster R, Parag HA, Diamond G, Ciechanover A, Marcus M. A Chinese hamster cell cycle mutant arrested at G2 phase has a temperature sensitive ubiquitin-activating enzyme, E1. J Biol Chem. 1988;263:15726–15731. [PubMed] [Google Scholar]
- Kuno M, Gardner P. Ion channels activated by inositol 1,4,5-trisphosphate in plasma membrane of human T-lymphocytes. Nature. 1987;326:301–304. doi: 10.1038/326301a0. [DOI] [PubMed] [Google Scholar]
- Lee MG, Xu X, Zeng W, Diaz J, Wojcikiewicz RJH, Kuo TH, Wuytack F, Racymaekers L, Muallem S. Polarized expression of Ca2+ channels in pancreatic and salivary gland cells. J Biol Chem. 1997;272:15765–15770. doi: 10.1074/jbc.272.25.15765. [DOI] [PubMed] [Google Scholar]
- Lee RJ, Lujan DE, Hall AL, Sklar LA, Wilson BS, Oliver JM. Cooperation between the FcεR1 and formyl peptide receptor signaling pathways in RBLFPR cells: the contribution of receptor-specific Ca2+ mobilization responses. Biochem Biophys Res Commun. 1997;235:812–819. doi: 10.1006/bbrc.1997.6874. [DOI] [PubMed] [Google Scholar]
- Lee RJ, Oliver JM. Two mechanisms of antigen-stimulated Ca2+ influx in RBL-2H3 cells. Mol Biol Cell. 1995;6:825–839. doi: 10.1091/mbc.6.7.825. [DOI] [PMC free article] [PubMed] [Google Scholar]
- Liu FT, Bohn JW, Ferry EL, Yamamoto H, Molinaro CA, Sherman LA, Klinman NR, Katz DH. Monoclonal dinitrophenyl-specific murine IgE antibody: preparation, isolation and characterization. J Immunol. 1980;24:2728–2736. [PubMed] [Google Scholar]
- Mak D-O, Foskett JK. Single-channel kinetics, inactivation, and spatial distribution of inositol trisphosphate (IP3) receptors in Xenopus oocyte nucleus. J Gen Physiol. 1997;109:571–587. doi: 10.1085/jgp.109.5.571. [DOI] [PMC free article] [PubMed] [Google Scholar]
- Maranto AR. Primary structure, ligand binding, and localization of the human type 3 inositol 1,4,5-trisphosphate receptor expressed in intestinal epithelium. J Biol Chem. 1994;269:1222–1230. [PubMed] [Google Scholar]
- Mignery GA, Sudhof TC, Takei K, De Camilli P. Putative receptor for inositol 1,4,5-trisphosphate similar to ryanodine receptor. Nature. 1989;342:192–195. doi: 10.1038/342192a0. [DOI] [PubMed] [Google Scholar]
- Muallem S, Pandol SJ, Beeker TG. Hormone-evoked calcium release from intracellular stores is a quantal process. J Biol Chem. 1989;264:205–212. [PubMed] [Google Scholar]
- Parys JB, De Smedt H, Missiaen L, Bootman MD, Sienaert I, Casteels R. Rat basophilic leukemia cells as model system for inositol 1,4,5-trisphosphate receptor IV, a receptor of the type II family: functional comparison and immunological detection. Cell Calcium. 1995;17:239–249. doi: 10.1016/0143-4160(95)90070-5. [DOI] [PubMed] [Google Scholar]
- Perez PJ, Ramos-Granco. J, Fill M, Mignery GA. Identification and functional reconstitution of the type 2 inositol 1,4,5-trisphosphate receptor from ventricular cardiac myocytes. J Biol Chem. 1997;272:23961–23969. doi: 10.1074/jbc.272.38.23961. [DOI] [PubMed] [Google Scholar]
- Pfeiffer JR, Deanin GG, Seagrave JC, Davis BH, Oliver JM. Membrane and cytoskeletal changes associated with IgE-mediated serotonin release in rat basophilic leukemia cells. J Cell Biol. 1985;101:2145–2155. doi: 10.1083/jcb.101.6.2145. [DOI] [PMC free article] [PubMed] [Google Scholar]
- Pietri F, Hilly M, Mauger J-P. Calcium mediates the interconversion between two states of the liver inositol 1,4,5,-trisphosphate receptor. J Biol Chem. 1990;265:17478–17485. [PubMed] [Google Scholar]
- Ross CA, Meldolesi J, Milner TA, Satoh T, Supattapone S, Snyder SH. Inostol 1,4,5-trisphosphate receptor localized to endoplasmic reticulum in cerebellar Purkinje neurons. Nature. 1989;339:468–470. doi: 10.1038/339468a0. [DOI] [PubMed] [Google Scholar]
- Satoh T, Ross CA, Villa A, Supattapone S, Pozzan T, Snyder SH, Meldolesi J. The inositol 1,4,5-trisphosphate receptor in cerebellar purkinje cells: quantitative immunogold labeling reveals concentration in an ER subcompartment. J Cell Biol. 1990;111:615–624. doi: 10.1083/jcb.111.2.615. [DOI] [PMC free article] [PubMed] [Google Scholar]
- Sienaert I, Missiaen L, De Smedt H, Parys JB, Sipma H, Casteels R. Molecular and functional evidence for multiple Ca2+-binding domains in the type 1 inositol 1,4,5-trisphosphate receptor. J Biol Chem. 1997;272:25899–25906. doi: 10.1074/jbc.272.41.25899. [DOI] [PubMed] [Google Scholar]
- Simeone DM, Yule DI, Logsdon CD, Williams JA. Ca2+ signaling through secretagogue and growth factor receptors on pancreatic AR42J cells. Regul Pept. 1995;55:197–206. doi: 10.1016/0167-0115(94)00107-9. [DOI] [PubMed] [Google Scholar]
- Simpson PB, Mehotra S, Lange GD, Russell JT. High density distribution of endoplasmic reticulum proteins and mitochondria at specialized Ca2+ release sites in oligodendrocyte processes. J Biol Chem. 1997;272:22654–22661. doi: 10.1074/jbc.272.36.22654. [DOI] [PubMed] [Google Scholar]
- Stump RF, Oliver JM, Cragoe EJ, Jr, Deanin GG. The control of mediator release from RBL-2H3 cells: roles for Ca2+, Na+, and protein kinase C. J Immunol. 1987;139:881–886. [PubMed] [Google Scholar]
- Subramanian K, Meyer T. Calcium-induced restructuring of nuclear envelope and endoplasmic reticulum calcium stores. Cell. 1997;89:963–971. doi: 10.1016/s0092-8674(00)80281-0. [DOI] [PubMed] [Google Scholar]
- Volpe P, Krause KH, Hashimoto S, Zorzato F, Pozzan T, Meldolesi J, Lew DP. “Calciosome,” a cytoplasmic organelle: the inositol 1,4,5-trisphosphate-sensitive Ca 2+ store of nonmuscle cells? Proc Natl Acad Sci USA. 1988;85:1091–1095. doi: 10.1073/pnas.85.4.1091. [DOI] [PMC free article] [PubMed] [Google Scholar]
- Watras J, Moraru J, Costa DJ, Kindman LA. Two inositol 1,4,5-trisphosphate binding sites in rat basophilic leukemia cells: relationship between receptor occupancy and calcium release. Biochemistry. 1994;33:14359–14367. doi: 10.1021/bi00251a050. [DOI] [PubMed] [Google Scholar]
- Wilson BS, Barker SA, Graham TC, Pfeiffer JR, Oliver JM. Phosphoinositide-derived second messengers in FcεR1 signaling: PI 3-kinase products control membrane topography and the translocation and activation of PLCγ1 in antigen-stimulated mast cells. In: Razin E, Pecht I, Rivera J, editors. Signal Transduction in Mast Cells and Basophils. Austin, TX: R.G. Landes Co.; 1998. (in press). [Google Scholar]
- Wojcikiewicz RJH. Type I, II and III inositol 1,4,5-trisphosphate receptors are unequally susceptible to down-regulation and are expressed in markedly different proportions in different cell types. J Biol Chem. 1995;270:11678–11683. doi: 10.1074/jbc.270.19.11678. [DOI] [PubMed] [Google Scholar]
- Wojcikiewicz RJH, Furuichi T, Nakade S, Mikoshiba K, Nahorski SR. Muscarinic receptor activation down-regulates the type I inositol 1,4,5-trisphosphate receptor by accelerating its degradation. J Biol Chem. 1994;269:7963–7969. [PubMed] [Google Scholar]
- Wojcikiewicz RJH, Oberdorf JA. Degradation of inositol 1,4,5-trisphosphate receptors during cell stimulation is a specific process mediated by cysteine protease activity. J Biol Chem. 1996;271:16652–16655. doi: 10.1074/jbc.271.28.16652. [DOI] [PubMed] [Google Scholar]
- Worley PF, Baranban JM, Supattapone S, Wilson VS, Snyder SH. Characterization of inositol trisphosphate receptor-binding in brain: regulation by pH and calcium. J Biol Chem. 1987;262:12132–12136. [PubMed] [Google Scholar]
- Yoneshima H, Miyawaki A, Michikawa T, Furuichi T, Nikoshiba K. Ca2+ differentially regulates the ligand-affinity states of type 1 and type 3 inositol 1,4,5,-trisphosphate receptors. Biochem J. 1997;322:591–596. doi: 10.1042/bj3220591. [DOI] [PMC free article] [PubMed] [Google Scholar]
- Yule DI, Ernst SA, Ohnishi H, Wojcikiewicz RJH. Evidence that zymogen granules are not a physiologically relevant calcium pool. J Biol Chem. 1997;272:9093–9098. doi: 10.1074/jbc.272.14.9093. [DOI] [PubMed] [Google Scholar]


