

Abstract
Dental plaque microcosms were established under a feast-famine regimen within constant-depth film fermentors and exposed four times daily postfeeding to a triclosan (TR)-containing rinse (dentifrice) (TRD). This was diluted so that the antimicrobial content was 0.6 mg/ml. Microcosms were characterized by heterotrophic plate counts and PCR-denaturing gradient gel electrophoresis (DGGE) with primers specific for the V2-V3 region of the eubacterial 16S rRNA gene (rDNA). Dominant isolates and PCR amplicons were identified by partial sequencing of 16S rDNA. TRD caused considerable decreases in the counts of both gram-negative organisms and total anaerobic cells, transiently lowered the numbers of streptococci and actinomycetes, and markedly increased the proportion of lactobacilli. DGGE indicated the presence of putatively unculturable bacteria and showed that a Porphyromonas sp. and Selenomonas infelix had been inhibited by TRD. Pure culture studies of 10 oral bacteria (eight genera) showed that Neisseria subflava, Prevotella nigrescens, and Porphyromonas gingivalis were highly susceptible to TR, while the lactobacilli and streptococci were the least susceptible. Clonal expansion of the lactobacilli in the pulsed microcosm could be explained on the basis of TR activity. The mean MICs of TR, chlorhexidine, erythromycin, penicillin V, and vancomycin for the population before and after 5 days of exposure to TRD showed few significant changes. In conclusion, changes in plaque microcosm populations following repeated exposure to TRD showed inhibition of the most susceptible flora and clonal expansion of less susceptible species.
Triclosan (TR; 2,4,4′-trichloro-2′-hydroxydiphenyl ether), also known as irgasan, is the most commonly used and most potent example of the chlorinated diphenylether antibacterials (10). Since its introduction in the 1960s, TR has been used clinically as a topical antiseptic (26, 38), in medicated soaps and hand washes (1), and in therapeutic baths for methicillin-resistant Staphylococcus aureus-infected patients (55). Although TR is largely ineffective against the members of the family Pseudomonadaceae (10), it possesses broad-spectrum activity, with MICs generally ranging from 0.1 to 30 mg/liter (39, 49). TR is increasingly being deployed in a variety of personal products, including shampoos (24), deodorants (3), and a number of oral hygiene products (31).
The efficacy of TR within oral formulations for the control of plaque accumulation is supported by a number of studies with human volunteers and in vitro studies, together with substantial postmarketing experience. Jenkins et al. (19) noted significant reductions in the magnitude of salivary bacterial counts following single rinses with 0.2% TR. The antiplaque efficacies of TR-containing rinses (dentifrices) (TRDs) were clearly demonstrated in a 4-day investigation in which volunteers did not brush (5), and the use of TRDs has been associated with reductions in gingival inflammation (31). Although these and many similar studies demonstrate the efficacy of TR in such applications, they do not evaluate the potential effects of the biocide and the antibiotic susceptibilities of the exposed bacteria. In this respect, recent studies have demonstrated that TR interacts with the enoyl-acyl carrier protein reductase (FabI) of Escherichia coli (13, 16, 25, 30), an essential enzyme in the fatty acid biosynthetic pathway of many different bacterial species (13, 14, 15). Importantly, TR can select for mutations in the FabI gene of E. coli when it is used at sublethal concentrations that confer tolerance to this biocide (25, 30). Assertions that sublethal exposures to such biocides might affect susceptibilities to chemically unrelated compounds have also been made (9, 25, 41). A number of studies have investigated such assertions, but to date no clear correlation has been made (45). With TRD use, oral bacteria are exposed to sublethal levels of TR over extended periods. In this respect, Walker et al. (51) studied the efficacy and possible effects of TR-containing dental formulations on the TR susceptibilities of the plaque flora using 144 subjects over 6 months. Application of TRD resulted in highly significant reductions in the total number of cultivable flora. The emergence of periodontal or opportunistic pathogens with altered spectra of susceptibilities to TR or other antibacterials was not noted.
The aim of the present study was to investigate the impact that a TRD might have on the microbial ecology and antimicrobial resistance properties of dental plaque microcosms. These were grown in constant-depth film fermentors (CDFFs), which have previously been used to model complex (36) and defined (21, 50) oral bacterial communities. Heterotrophic plate counts of selected groups of oral bacteria and culture-independent methods (denaturing gradient gel electrophoresis [DGGE]) (32, 52), in conjunction with sequencing and phylogenetic analysis, were used to characterize the ecosystems that developed. In order to study the possible effects of TR exposure on the susceptibilities of the oral community of organisms, the MICs of TR, chlorhexidine, vancomycin, penicillin V, and erythromycin for the numerically dominant aerobic and facultative clones isolated both from baseline microcosms and following 5 days of TRD exposure were determined.
MATERIALS AND METHODS
Continuous culture of dental plaque microcosms.
CDFFs were used to grow dental bacteria under environmental conditions similar to those that occur in supragingival plaque (nutrient availability, surfaces for colonization, oxygen status, etc.). The fermentation system consisted of a stainless steel rotor housing 15 removable polytetrafluoroethylene (PTFE) pans. Each PTFE pan holds five cylindrical pegs, which may be recessed to an accurate depth by using calibrated rods. In operation, two spring-loaded PTFE blades constantly scrape the surface of the rotor and ensure that the microcosm can grow only to the depth at which the plugs have been recessed (28, 35; see reference 36 for a diagram). The apparatus was located in a sealed glass unit to prevent contamination and to enable control of the gaseous environment (36). In these experiments, the Teflon substrata were used as described by Wilson (54). The temperature (36 ± 0.5°C) was maintained by locating fermentors within a Perspex incubation chamber (Stuart Scientific, Redhill, Surrey, United Kingdom). CDFF plugs were set to a depth of 200 μm, and the rotor speed was set to 3 rpm. A modified artificial saliva medium was used (27, 42) and contained the following (at the indicated concentrations in distilled water): mucin (type II, porcine gastric), 2.5 g/liter; bacteriological peptone, 2.0 g/liter; tryptone, 2.0 g/liter; yeast extract, 1.0 g/liter; NaCl, 0.35 g/liter; KCl, 0.2 g/liter; CaCl2, 0.2 g/liter; cysteine hydrochloride, 0.1 g/liter; hemin, 0.001 g/liter; and vitamin K1, 0.0002 g/liter. The saliva used for inoculation was obtained from two healthy adults (one woman and one man) aged 24 and 30 years (volunteers A and B). These individuals had no history of periodontal disease and had exclusively used oral products without biocides for at least 5 months prior to saliva donation. Volunteers A and B had taken no antibiotics for over 8 months and 5 years, respectively. Prior to inoculation, the CDFF plug surfaces were conditioned for 24 h with culture medium, which was continuously added to each fermentor by a peristaltic pump (9.6 ± 0.2 ml/h; Minipuls 3; Gilson). The fermentors were inoculated with fresh saliva on three separate occasions (2.0 ± 0.5 ml/fermentor/inoculation) over a period of 24 h by using fresh, pooled saliva from the donor. Anaerobiosis was maintained within the CDFFs by constant gassing with an anaerobic gas mixture (CO2 and N2; 5:95,) at ca. 1 liter/h. In order to simulate the increased bacterial growth substrate conditions which may occur in the mouth following a meal, the microcosms received an additional, electronically timed, intermittent feeding (four times daily at 19 ml/h for 30 min), as described and validated previously (27). The composition (at the indicated concentrations in distilled water) was as follows: soluble starch, 5.0 g/liter; casein, 3.0 g/liter; bacteriological peptone, 3.0 g/liter; sucrose, 2.0 g/liter; yeast extract, 2.5 g/liter; NaCl, 4.5 g/liter; K2HPO4, 0.2 g/liter; CaCl2, 0.4 g/liter; and NaHCO3, 0.2 g/liter. Once dynamic steady states were established (evidenced by stability of the colony counts), TRD, which was diluted so that the TR content was 0.6 mg/ml, was added over 5 days by a peristaltic pump (8 ml/h for 5 min) immediately following each feeding. Samples were taken at regular intervals throughout the 5 days and were processed in less than 30 min for bacteriology or were archived at −60°C for subsequent analysis by PCR-DGGE.
Differential bacteriological analysis.
The selection of bacterial populations for use as markers of microcosm dynamics was based on numerical importance, together with ease of cultivation. For enumeration, samples of human saliva (1 ml) or dental microcosm (three sample plugs) were homogenized by mechanical shaking in a bead beater (0.5 min, 240 oscillations per minute; Griffin Scientific, London, United Kingdom). Maceration of the microcosms grown on CDFF plugs was aided by the addition of 1.5 g of sterile glass beads (diameter, 3.5 to 5.5 mm; BDH, Poole, United Kingdom). The samples were then serially diluted with prereduced, half-strength thioglycolate medium (USP). Appropriate dilutions (0.05 ml) were then plated in triplicate onto a variety of selective and nonselective media by using a model CU spiral plater (Spiral Systems, Cincinnati, Ohio). These media were Wilkins-Chalgren agar (for total anaerobes); Wilkins-Chalgren agar with supplements for gram-negative organisms (for total gram-negative anaerobes); cadmium, fluoride, acriflavin, and tellurite agar (56) (for dental actinomycetes); Rogosa agar (for total lactobacilli); Trypticase yeast extract, cysteine, and sucrose agar (48) (for Streptococcus spp.); and nutrient agar (for total aerobes). These agars were immediately placed in an anaerobic chamber (with an atmosphere of 10% H2, 10% CO2, and 80% N2), and all agars except nutrient agar were maintained at 37°C for up to 5 days; the nutrient agar was incubated aerobically in a standard incubator for 3 days. Morphologically distinct bacterial colonies were counted, subcultured, and archived at −80°C for subsequent identification.
Characterization of resistance properties.
Stock solutions (4 mg/ml) of chlorhexidine, erythromycin, penicillin V, and vancomycin were prepared in deionized, distilled water. TR stock solutions were prepared in 25% ethanol. All solutions were sterilized by filtration through cellulose acetate filters (pore size, 0.2 μm; Millipore, Watford, United Kingdom) and stored at −60°C. MICs were determined by the broth dilution endpoint method with overnight cultures of reference strains or isolates from microcosms that were established by using the saliva from volunteer B. The test bacteria were grown in Wilkins-Chalgren broth and were then diluted to approximately 105 CFU/ml in sterile broth. In all cases, controls were run for the 25% ethanol solvent used for TR.
DGGE analysis.
Microcosm samples archived in vitro (three CDFF plugs) were mixed with 1 ml of sterile sodium phosphate buffer (0.12 M; pH 8.0), vortexed, and subjected to two cycles of freezing and heating (−60°C for 10 min, 60°C for 2 min). The samples were then transferred to a Bead-Beater vial (Biospec Products, Bartlesville, Okla.) containing 0.3 g of sterile zirconium beads (diameter, 0.1 mm). Tris-equilibrated phenol (150 μl; pH 8.0) was added, and the suspension was shaken three times for 80 s at maximum speed (Mini-Bead-Beater; Biospec Products). After 10 min of centrifugation at 13,000 × g, the supernatant was extracted three times with an equal volume of phenol-chloroform and once with chloroform-isoamyl alcohol (24:1 [vol/vol]). The DNA was precipitated from the aqueous phase with 3 volumes of ethanol, air dried, and resuspended in 100 μl of deionized water. The amount and quality of the DNA extracted were estimated by electrophoresis of 5-μl aliquots on a 0.8% agarose gel and comparison to a molecular weight standard (which was stained with ethidium bromide). DNA extracts were stored at −60°C prior to analysis. The V2-V3 region of the 16S rRNA gene (rDNA; corresponding to positions 339 to 539 of E. coli) was amplified with eubacterium-specific primers HDA1 (5′-GC CGC CCG GGG CGC GCC CCG GGC GGG GCG GGG GCA CGG GGG GAC TCC TAC GGG AGG CAG CAG T-3′) and HDA2 (5′-GTA TTA CCG CGG CTG CTG GCA C-3′) (52). The reactions were performed in 0.2-ml tubes by using a DNA thermal cycler (model 480; Perkin-Elmer Cambridge, United Kingdom) and Red Taq DNA polymerase ready mixture (25 μl; Sigma, Dorset, United Kingdom), HDA primers (2 μl each at 5 mM), nanopure water (16 μl), and DNA extracted from the microcosm community (5 μl). Previously described optimization studies (32) showed that the DNA extracted from the microcosm community required a minimum of a 1:10 dilution to ensure reliable PCRs. The thermal program was as follows: 1 cycle of 94°C for 4 min, followed by 30 thermal cycles of 94°C for 30 s, 56°C for 30 s, and 68°C for 60 s. The final cycle incorporated a 7-min chain elongation step at 68°C. The PCR products derived from the microcosm community samples were resolved with a D-code universal mutation detection system (Bio-Rad, Hemel Hempstead, United Kingdom) with polyacrylamide gels (8%; 16 by 16 cm by 1 mm in depth) run with 1× TAE buffer diluted from 50× TAE buffer (40 mM Tris base, 20 mM glacial acetic acid, 1 mM EDTA). Initially, separation parameters were optimized by running the PCR products from selected pure cultures of bacteria and the PCR amplicons from extracted microcosm community DNA on gels with a 0 to 100% denaturation gradient perpendicular to the direction of electrophoresis (a 100% denaturing solution contained 40% [vol/vol] formamide and 7.0 M urea). Denaturing gradients were formed with two 8% acrylamide (acrylamide-bisacrylamide; 37.5:1) stock solutions (Sigma). On this basis, a denaturation gradient for parallel DGGE analysis ranging from 30 to 60% was selected. PCR amplicons from Fusobacterium nucleatum (ATCC 10953), Lactobacillus rhamnosus (AC413), Neisseria subflava (A1078), Porphyromonas gingivalis (W50), Actinomyces naeslundii (WVU627), and Prevotella nigrescens (T588) were run on a parallel gel in order to validate the separation conditions. For community analyses, the gels also contained a 30 to 60% denaturing gradient. Electrophoresis was carried out at 150 V and 60°C for approximately 4.5 h. All gels were stained with SYBR Gold stain [diluted to 10−4 in 1× TAE; Molecular Probes (Europe), Leiden, The Netherlands] for 30 min. The gels were viewed and the images were documented with a BioDocit system (UVP, Cambridge, United Kingdom).
Partial 16S rDNA sequencing of bacterial isolates and excised gel bands.
All morphologically distinct colonies from each of the isolation media were subcultured on Wilkins-Chalgren agar. Bacterial colonies (two to three) were aseptically removed from the surface of the plate and homogenized in a reaction tube containing nanopure water (100 μl). The bacterial suspensions were heated to 100°C in a boiling water bath for 10 min and centrifuged at 10,000 × g for 10 min. The supernatants were used as templates for PCR. Partial 16S rRNA gene sequences were amplified by using primers 8FPL1 (5′-GAG TTT GAT CCT GGC TCA G-3′) and 806R (5′-GGA CTA CCA GGG TAT CTA AT-3′) at 5 μM each. Each PCR mixture consisted of Red Taq DNA polymerase ready mixture (25 μl; Sigma) forward and reverse primers (2 μl each at 5 μM), nanopure water (16 μl), and template DNA (5 μl). A Perkin-Elmer model 480 thermal DNA cycler was used to run 35 thermal cycles, as follows: 94°C for 1 min, 53°C for 1 min, and 72°C for 1 min. The final cycle incorporated a 15-min chain elongation step. For analysis of the major amplicons resolved by DGGE, selected, resolved bands were cut out of the polyacrylamide gels with a sterile scalpel under UV illumination and incubated together with 20 μl of nanopure water at 4°C for 20 h in nuclease-free universal bottles. Portions (5 μl) were removed and used as the template for a PCR identical to that outlined in the section on DGGE analysis. The PCR products were purified with Qiaquick PCR purification kits (Qiagen Ltd., West Sussex, United Kingdom) and sequenced. The sequencing cycles were 1 cycle of 94°C for 4 min, followed by 25 cycles of 96°C for 30 s, 50°C for 15 s, and 60°C for 4 min. Once chain termination was complete, sequencing was done in a Perkin-Elmer ABI 377 sequencer. Primer HDA2 was used for sequencing of DGGE amplicons. DNA sequences were compiled by using GENETOOL LITE (version 1.0) software (DoubleTwist; BioTools, Inc., Alberta, Canada) to obtain consensus sequences or to check and edit unidirectional sequences. For bands excised from the DGGE gels after PCR, the presence of a GC clamp on sequence analyses confirmed that the correct target rather than an extraneous contaminant had been reamplified.
Sequence databases.
The BLAST program (http://www.ncbi.nlm.nih.gov/blast) was used to search the European Molecular Biology Laboratories (EMBL) prokaryote database for sequences that matched the sequences compiled in the present study.
Chemicals.
Unless stated otherwise, chemicals and antimicrobial agents were obtained from Sigma. Formulated bacteriological media were purchased from Oxoid, Basingstoke, United Kingdom. TR (irgasan DP300) was obtained from Oils and Soaps Ltd. (Bradford, United Kingdom).
Bacteria.
F. nucleatum ATCC 10953, L. rhamnosus AC413, N. subflava A1078, P. gingivalis W50, A. naeslundii WVU627, and P. nigrescens T588 were obtained from D. Bradshaw, BioSciences, Quest International, Ashford, United Kingdom. Streptococcus oralis NCTC11427, Streptococcus sanguis NCTC7863, and Streptococcus mutans NCTC10832 were obtained from J. Verran, Manchester Metropolitan University, Manchester, United Kingdom.
Statistical analysis.
Individual MIC measurements were arranged into groups on the basis of antimicrobial agents and the bacterial group (gram-positive species, oral lactobacilli, and enterobacteria). These groups were then subjected to F tests and two-sample Student's t tests by using Microsoft Excel software.
Nucleotide sequence accession numbers.
The sequences of the following isolated cell clones have been deposited in the EMBL sequence database (the accession numbers are given in parentheses): Streptococcus mitis MBRG 5.7 (AJ514235), Streptococcus anginosus MBRG 5.2 (AJ514236), Streptococcus gordonii MBRG 5.6 (AJ514237), S. sanguis MBRG 5.5 (AJ514238), L. rhamnosus MBRG 6.1 (AJ514239), Citrobacter freundii MBRG 7.3 (AJ514240) Bacillus licheniformis MBRG 7.1 (AJ514241), S. salivarius MBRG 5.8 (AJ514242), Bacillus subtilis MBRG 7.0 (AJ514243), Streptococcus sp. strain MBRG 5.3 (AJ514244), Staphylococcus epidermidis MBRG 6.5 (AJ514245), Lactococcus lactis MBRG 6.3 (AJ514246), Lactobacillus casei MBRG 5.9 (AJ514247), Peptostreptococcus sp. strain MBRG 6.4 (AJ514248), Staphylococcus hominis MBRG 6.6 (AJ514249), Streptococcus sp. strain MBRG 5.4 (AJ514250), Streptococcus constellatus MBRG 5.1 (AJ514251), Prevotella buccae MBRG 6.2 (AJ514252), and S. epidermidis MBRG 6.8 (AJ514253). The sequences of the following amplicons obtained from the DGGE gels were deposited in the EMBL sequence database (the accession numbers are given in parentheses): uncultured Porphyromonas sp. strain B1 (AJ514229), uncultured bacterial strain B2 of the family Chloroflexaceae (AJ514230), S. infelix B3 (AJ514231), C. freundii T1 (AJ514232), uncultured Prevotella sp. strain T2 (AJ514233), and uncultured selenate-reducing bacterial strain T3 (AJ514234).
RESULTS AND DISCUSSION
Most of the published studies of TR and oral bacteria have relied on selective isolation to measure the bacteriological effects. Few have applied culture-independent techniques or have evaluated changes in the antimicrobial susceptibilities of TR-exposed bacterial populations. The aims of this study were therefore to combine culture with DGGE to investigate the dynamic changes within dental plaque microcosms caused by 5 days of exposure to TR. A secondary objective was to evaluate such dynamic changes in terms of the susceptibility profile of the community before and after stress. Microcosms were grown in CDFFs under steady-state conditions by using a previously validated feast-famine feeding regimen (27).
Bacteriological effects of TR.
The data in Fig. 1 show the results of culture-based enumeration of selected bacterial groups within the microcosms. Anaerobic counts of ca. 8 log10/mm2 occurred in the fermentors, with smaller numbers of aerobic and facultative species (ca. 7 log10/mm2) detected. Large numbers of streptococci and putative actinomycetes were also isolated. Dynamic stability was attained in the fermentors within 3 days of inoculation and was maintained at levels similar to those in the baseline microcosms. The addition of TRD caused large decreases in total anaerobe counts, which achieved a maximum decrease after 2 days, and similar reductions in the numbers of gram-negative anaerobes. The latter recovered to approach the baseline levels over the subsequent 3 days. Minor, transient reductions in the counts of the streptococci occurred, while the counts of the actinomycetes and the total aerobic bacteria were largely unaffected by exposure to TRD. Major increases in the counts of the lactobacilli occurred. Table 1 shows the closest relatives of the numerically dominant isolates, demonstrating that the greatest species diversity occurred within the streptococci. Interestingly, a number of bacteria not normally considered resident oral species were isolated. For example, Citrobacter spp. are enteric bacteria, while S. epidermidis is normally found on the skin. Enteric species have previously been isolated from dental plaque (6, 12), as have staphylococci (33, 34, 37).
FIG. 1.

Viable counts of selected groups of oral bacteria in a dental microcosm before and during pulsed TR addition. Data are means ± standard deviations from two separate sample pans analyzed in triplicate. Units are log10 CFU per gram (wet weight) of biofilm. Arrows denote the times of DGGE sampling, and the vertical dotted line shows the time of TR addition. Times are given in days (d).
TABLE 1.
Identities of major isolated cells, including clones, which proliferated or decreased in number during TR addition
| Sample | Cell clone (MBRG no.) | Ambiguitya
|
Relative (EMBL accession no.) (% sequence similarity) | |
|---|---|---|---|---|
| No. of base pairs | % | |||
| Streptococci | 5.2 | 786 | 0.9 | Streptococcus anginosus (AF306838) (99) |
| 5.1 | 780 | 0.9 | Streptococcus constellatus (AF104677) (98) | |
| 5.6 | 776 | 0.6 | Streptococcus gordonii (AF003931) | |
| 5.7 | 758 | 0.1 | Streptococcus mitis (AF003929) (99) | |
| 5.8 | 783 | 0.8 | Streptococcus salivarius (M58839) (99) | |
| 5.5 | 744 | 4.0 | Streptococcus sanguis (AF003928) (94) | |
| 5.4 | 759 | 0.5 | Streptococcus sp. (AF432131) (98) | |
| 5.3 | 766 | 1.3 | Streptococcus sp. (AF316595) (97) | |
| Lactobacilli | 5.9 | 788 | 0.5 | Lactobacillus casei (AF385770) (99) |
| 6.1 | 792 | 2.1 | Lactobacillus rhamnosus (AF243146) (99)b | |
| 6.3 | 776 | 0.1 | Lactococcus lactis (AJ514246) (99) | |
| Anaerobes | 6.2 | 763 | 0.4 | Prevotella buccae (L16478) (99)c |
| 6.4 | 783 | 0.6 | Peptostreptococcus sp. (AF287767) (98) | |
| Other species | 6.5 | 783 | 0.4 | Staphylococcus epidermidis (AF270147) (99) |
| 6.8 | 769 | 0.3 | Staphylococcus epidermidis (AY030342) (99) | |
| 6.7 | 770 | 0 | Staphylococcus haemolyticus (L37600) (99) | |
| 6.6 | 780 | 0.4 | Staphylococcus hominis (L37601) (99) | |
| 7.1 | 795 | 1.3 | Bacillus licheniformis (AF391127) (99) | |
| 7.0 | 772 | 0 | Bacillus subtilis (AJ276351) (100) | |
| 7.3 | 763 | 0 | Citrobacter freundii (AF025365) (99) | |
| 7.2 | 773 | 0.5 | Citrobacter murliniae (AF025369) (99) | |
Sequence similarities by database analysis with the BLAST program.
The species clonally expanded during TR addition.
Viability decreased during TR addition.
The data in Table 1 show that the major decreases in gram-negative anaerobe and total anaerobe counts were related to the losses of P. buccae, while the concomitant increases in the counts of the lactobacilli were attributable to the elevation in the counts of a bacterium that had 95% homology to L. rhamnosus. Bradshaw et al. (4) also demonstrated the specificity of TR for gram-positive organisms and its markedly lower levels of activity against streptococci and lactobacilli using defined communities in vitro. A similar specificity of TR has also been shown in studies with human volunteers (20) and in a novel supragingival plaque model (11). The extent of TR-mediated effects on oral microcosms varies widely in the literature, depending on the experimental system used. This variation is presumably due to various pharmacokinetic profiles. Systems such as CDFF (35) and flow chambers (47), for example, use a continuous flow of growth medium, while culture plate models (11) and chemostats (4) may have considerably longer antimicrobial retention times. The relatively large amplitude of the bacterial effects observed in this study may be attributable to the extended TR residence times due to the relatively slow flow rate of artificial saliva. Furthermore, since actively growing bacteria are generally most susceptible to antimicrobial effects (7), feeding prior to the addition of TRD may have relieved nutrient limitation and enhanced susceptibility. This could also explain the clonal expansion of the lactobacilli that occurred during exposure to TR, since the saccharolytic lactobacilli (17) may have exploited the ecological niche vacated by the gram-negative anaerobes.
DGGE analysis.
Figure 2 shows that the microcosms harbored considerable eubacterial diversity at the baseline, as evidenced by the large number of bands (>20) on the gels, but were dominated by only a few species. These dominant organisms were related to the gram-negative anaerobic oral bacteria Porphyromonas spp. and S. infelix (22) and to a bacterium with homology to a bacterium of the family Chlorflexaceae (Fig. 2; Table 2). Some dynamic changes were apparent within the microcosms prior to the addition of TR. For example, the bacterium of the family Chlorflexaceae became detectable between days 3 and 5 after the beginning of exposure to TR, although the majority of species appeared to be under dynamic stability, as evidenced by the stable maintenance of the majority of bands, including major bands B1 and B3. TR exposure decreased the microbial diversity of the microcosm communities, as indicated by a reduction in the total number of bands on the DGGE gels. With respect to changes within the putatively most abundant phylotypes, bands B1 and B2 disappeared (the bacterium in the family Chlorflexaceae and a Porphyromonas sp., respectively) following 5 days of exposure to TR, while band B3 (S. infelix) became reduced in abundance and bacteria corresponding to bands T1 and T3 (C. freundii and Prevotella sp., respectively) were clonally expanded. Importantly, since Porphyromonas and S. infelix are gram-negative anaerobes, this aspect of the DGGE analysis is in agreement with the selective culture-based data (Table 2). However, the apparent clonal expansion of the Prevotella sp. (band T3) conflicts with the culture data. This apparent anomaly either can be explained on the basis of biases inherent in the DGGE analysis or highlights the utility of DGGE for the detection of dynamic changes within complex communities that might evade detection by conventional isolation methods. Furthermore, of the six dominant phylotypes, only the Porphyromonas sp. and C. freundii had been isolated by exhaustive culture procedures, demonstrating the importance of adopting culture-independent methods. In this respect, the proportion of yet-to-be-cultivated bacteria in subgingival plaque-type ecosystems has been estimated to be over 50% (23).
FIG. 2.
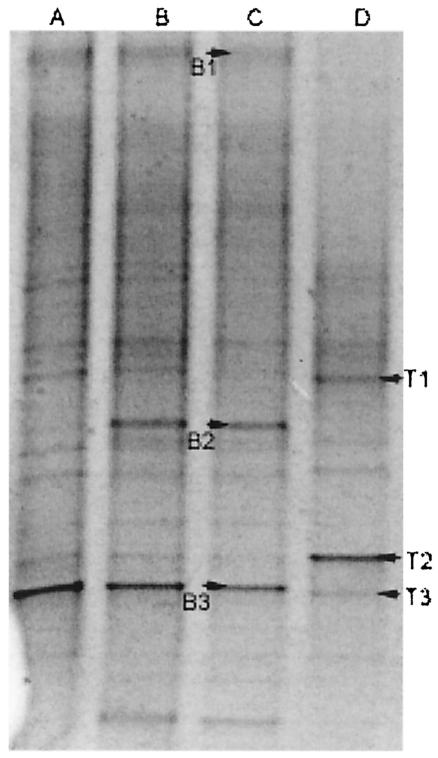
Negative image of a parallel DGGE gel showing microcosm samples removed at days 3 (A), 5 (B), and 11 (C) (baseline) and day 17 (D) (5 days after TR addition).
TABLE 2.
Sequences of dominant PCR amplicons derived from DGGE gels at baseline and following 5 days of TR additiona
| Time of testing | DNA clone | Ambiguity
|
Relative (EMBL accession no.) (% sequence similarity)b | |
|---|---|---|---|---|
| No. of base pairs | % | |||
| Baseline | B1 | 176 | 9.7 | Porphyromonas sp. (AF366271) (87) |
| B2 | 182 | 25 | Bacterium of family Chloroflexaceae (AJ309631) (90) | |
| B3 | 181 | 1.1 | S. infelix (AF287802) (100) | |
| After TR addition | T1 | 172 | 1.7 | C. freundii (AJ233408) (97) |
| T2 | 174 | 14.3 | Prevotella sp. (AF385512) (83) | |
| T3 | 182 | 2.7 | Selenate-reducing bacterium (AB018592) (98) | |
See Fig. 1 for sample timings.
Identities based on database searches with the BLAST program.
The detection of atypical oral species in the microcosms further reinforces the utility of DGGE over hybridization methods since there is no experimental bias toward typical resident oral species. DGGE identifies any amplifiable target sequence present at levels above the detection thresholds (32), whereas hybridization techniques measure the abundance of a finite number of species (18, 43, 44). An issue of concern when DGGE is used to monitor dynamic changes in microbial ecosystems is the detection of nonviable organisms. In this respect, real-time monitoring is dependent on the rapid turnover of dead cells and degradation of the associated DNA within the test community. The considerable proteolytic activities demonstrated in plaque ecosystems (53) are likely to rapidly degrade dead cells, while the half-life of target DNA is likely to be short since many streptococci produce nucleases (8). Validation studies in our laboratory with samples taken at 12-h time intervals suggested that the rate of turnover was considerably faster than 12 h (data not shown).
While the utility of the technique is acknowledged, care should be taken when phylogenetic inferences from the sequenced DGGE bands are made, since derived sequences are short and may be of variable quality (Table 2). Such ambiguities probably arise from amplification of different phylotypes with similar or identical electrophoretic mobilities. The relatively short sequences derived from DGGE also reduce the refinement of phylogenetic determination. Despite these concerns, DGGE is one of the only techniques that allows reproducible visual comparisons of profiles from microbial communities to be derived and has been successfully applied to a wide variety of microbial ecosystems (40, 46, 52).
TR susceptibilities of selected oral type strains.
Table 3 shows the MICs and minimal bactericidal concentrations (MBCs) for 10 dental bacteria which comprise the Marsh consortium (4, 29). These data show that N. subflava was the most susceptible bacterium, followed by the gram-negative anaerobes P. nigrescens, P. gingivalis, and F. nucleatum. S. mutans and L. rhamnosus were considerably less susceptible. There are few reports in the literature concerning the specificity of TR for oral bacteria in pure culture; most studies have focused on microcosm or defined community plaques. The data for pure cultures presented in Table 3 demonstrate an apparent specificity of TR for gram-negative oral species, which is interesting, since the clinical application of this agent for infections caused by methicillin-resistant S. aureus exploits its specificity for gram-positive species (2, 55). Importantly, the specificity data suggest that the species specificity of TR in pure culture can be extrapolated to effects against microcosm plaques.
TABLE 3.
MICs and MBCs of TR for selected type strains of oral bacteriaa
| Strain | MIC (mg/liter) | MBC (mg/liter) | Ratio |
|---|---|---|---|
| A. naeslundii WVU 627 | 3.9 | 7.8 | 1:2 |
| F. nucleatum ATCC 10953 | 7.8 | 7.8 | 1:1 |
| L. rhamnosus AC 413 | 15.6 | 15.6 | 1:1 |
| N. subflava A 1078 | 0.1 (0.03) | 0.1 | 1:1 |
| P. nigrescens T 588 | 3.9 | 6.5 (1.84) | 1:2 |
| P. gingivalis W50 | 3.9 | 3.9 | 1:1 |
| S. mutans NCTC10832 | 20.8 (7.4) | 20.8 (7.4) | 1:1 |
| S. sanguis NCTC7863 | 2.6 (1.0) | 5.2 (1.8) | 1:2 |
| S. oralis NCTC11427 | 5.2 | 5.2 (1.8) | 1:1 |
| Veillonella dispar ATCC 17745 | 3.9 | 7.8 | 1:2 |
Data were determined by the broth dilution endpoint method (doubling dilutions). The data are the means from duplicate experiments performed in triplicate. Where data varied between replicates, standard deviations are given in parentheses.
Effects of TR on microcosm drug susceptibilities.
The mean and median MICs and the standard deviations of the MICs for the randomly selected clonal isolates, grouped as gram-positive cocci, lactobacilli, and enteric species, determined separately both before and after 5 days of microcosm community exposure to TR are presented in Table 4. According to the baseline data, TR and chlorhexidine possessed the greatest potencies against all groups of dental isolates, the MICs of erythromycin and penicillin V varied considerably, but vancomycin was largely ineffective against the lactobacilli and enteric species. With respect to the MICs for the clonal variants of the various bacterial groups after 5 days of exposure to TR in which any mean increase was apparent, the data were generally not statistically significant. The P values were as follows: for gram-positive cocci, TR, P = 0.19; erythromycin, P = 0.51; penicillin V, P = 0.79; and vancomycin, P = 0.77; for the oral lactobacilli, TR, P = 0.47; chlorhexidine, P = 0.16; erythromycin, P = 0.02; penicillin V, P = 0.68; and vancomycin, P = 0.42; for enteric species, TR, P = 0.48; chlorhexidine, P = 0.31; erythromycin, P = 0.43; penicillin V, P = 0.63; and vancomycin, P = 0.29. Therefore, the data were more consistent with a loss of highly sensitive clones during exposure to TR. Similar observations have previously been made in studies conducted with adult volunteers over 7 months (20). The changes in microcosm community susceptibility presented in the present study are presumably attributable to dynamic changes in community composition, which affected the frequency of occurrence of cell clones and which thus altered the average susceptibility values.
TABLE 4.
Dominant cultivable facultative species and their susceptibilities to selected antimicrobial agents before and after exposure to TRa
| Sample | No. of clones
|
MIC (mg/liter)b
|
||||||||||
|---|---|---|---|---|---|---|---|---|---|---|---|---|
| Before | After | TR
|
CH
|
ERY
|
PEN
|
VAN
|
||||||
| Before | After | Before | After | Before | After | Before | After | Before | After | |||
| Gram-positive cocci | 27 | 6 | 1.6, 14.8 (22.7) | 2.2, 0.3 (4.0) | 3.7, 0.1 (7.0) | 0.05, 0.01 (0.10) | 225, 400 (189) | 280, 160 (131) | 127, 64.0 (158) | 146, 64.0 (198) | 149, 0.7 (196) | 200, 0.91 (219) |
| Oral lactobacilli | 8 | 7 | 1.4, 0.9 (1.2) | 2.5, 1.4 (3.5) | 0.01, 0.01 (0.01) | 0.02, 0.01 (0.01) | 62.9, 25.6 (137) | 274, 400 (166) | 25.0, 10.0 (44.9) | 36.3, 3.5 (36.3) | 270, 400 (186) | 343, 400 (152) |
| Enteric species | 9 | 17 | 86.9, 64.0 (71.1) | 115, 160 (104) | 4.3, 0.3 (6.7) | 1.9, 0.1 (5.0) | 373, 400 (80.0) | 340, 400 (107) | 293, 400 (160) | 326, 400 (159) | 400, 400 (0.0) | 350, 400 (136) |
| Total anaerobic species | 9 | 7 | 19.0, 1.6 (52.9) | 10.3, 1.4 (22.0) | 0.04, 0.01 (0.07) | 0.01, 0.01 (0.0) | 100, 25.6 (170) | 274, 337 (153) | 40.0, 10.0 (61.5) | 84.3, 14.5 (140) | 270, 400 (186) | 343, 400 (140) |
MICs were determined by the broth dilution method (replicate determinations for each isolate; n = 4).
The values are presented as the mean, median; standard deviations of the data for multiple cell clones are given in parentheses. CH, chlorhexidine; ERY, erythromycin; PEN, penicillin V; VAN, vancomycin.
Conclusions.
In the investigations described here, we have used isolation techniques to demonstrate a clear specificity of TR for anaerobic and gram-negative species in microcosm dental plaques. DGGE corroborated these observations, gave an indication of the stability of the baseline plaques in vitro, and enabled phylogenetic information to be obtained about the major phylotypes in the microcosm community that altered in abundance during exposure to TR. Importantly, we have shown that the levels of susceptibility to a range of antibacterial compounds varied widely among the microcosm isolates and that the dynamic changes within these communities during exposure to TR reflect their susceptibility. In general, these changes were not statistically significant and were probably related to a clonal expansion of less susceptible members of the community. There was no evidence that TR exposure caused the emergence of potentially pathogenic species or otherwise adversely affected the balance within the plaque bacterial ecosystem.
Acknowledgments
We are grateful to Procter and Gamble for funding this work.
We thank D. Bradshaw and J. Verran for supplying the oral reference strains.
REFERENCES
- 1.Ayliffe, G. A., J. R. Babb, J. G. Davies, and H. A. Lilly. 1988. Hand disinfection: a comparison of various agents in laboratory and ward studies. J. Hosp. Infect. 11:226-243. [DOI] [PubMed] [Google Scholar]
- 2.Bamber, A. I., and T. J. Neal. 1999. An assessment of triclosan susceptibility in methicillin-resistant and methicillin-sensitive Staphylococcus aureus. J. Hosp. Infect. 41:107-109. [DOI] [PubMed] [Google Scholar]
- 3.Bhargava, H. N., and P. A. Leonard. 1996. Triclosan: applications and safety. Am. J. Infect. Control 24:209-218. [DOI] [PubMed] [Google Scholar]
- 4.Bradshaw, D. J., P. D. Marsh, G. K. Watson, and D. Cummins. 1993. The effects of triclosan and zinc citrate, alone and in combination, on a community of oral bacteria grown in-vitro. J. Dent. Res. 72:25-30. [DOI] [PubMed] [Google Scholar]
- 5.Cao, C., Y. Sha, H. Meng, J. Kang, C. H. Yeh, H. Y. Chyon, and J. L. Winston. 2001. A four-day study to evaluate the anti-plaque efficacy of an experimental triclosan-containing dentifrice. J. Clin. Dent. 12:87-91. [PubMed] [Google Scholar]
- 6.de Campos, C. M., and F. Zelante. 1978. Human oral microbiota. I. Occurrence of enteric bacteria in saliva, tongue and dental plaque. Rev. Fac. Odontol. Sao Paulo 16:77-86. [PubMed] [Google Scholar]
- 7.Evans, D. J., D. G. Allison, M. R. Brown, and P. Gilbert. 1990. Effect of growth-rate on resistance of gram-negative biofilms to cetrimide. J. Antimicrob. Chemother. 26:473-478. [DOI] [PubMed] [Google Scholar]
- 8.Ferreira, B. T., L. C. Benchetrit, A. C. De Castro, T. G. Batista, and L. Barrucand. 1992. Extracellular deoxyribonucleases of streptococci: a comparison of their occurrence and levels of production among beta-hemolytic strains of various serological groups. Zentbl. Bakteriol. Parasitenkd. Infektkrankh. Hyg. Abt. 1 Orig. 277:493-503. [DOI] [PubMed] [Google Scholar]
- 9.Fraise, A. P. 2002. Biocide abuse and antimicrobial resistance—a cause for concern? J. Antimicrob. Chemother. 49:11-12. [DOI] [PubMed] [Google Scholar]
- 10.Furia, T. E., and A. G. Schenkel. 1968. A new, broad-spectrum bacteriostat. Soap Chem. Specialties 44:47-50, 116-122.
- 11.Guggenheim, B., W. Giertsen, P. Schupbach, and S. Shapiro. 2001. Validation of an in-vitro biofilm model of supragingival plaque. J. Dent. Res. 80:363-370. [DOI] [PubMed] [Google Scholar]
- 12.Hase, J. C., S. Edwardsson, J. Rundegren, R. Attstrom, and E. Kelty. 1998. Six-month use of 0.2% delmopinol hydrochloride in comparison with 0.2% chlorhexidine digluconate and placebo. II. Effect on plaque and salivary microflora. J. Clin. Periodontol. 25:841-849. [DOI] [PubMed] [Google Scholar]
- 13.Heath, R. J., and C. O. Rock. 1995. Enoyl-acyl carrier protein reductase (FabI) plays a determinant role in completing cycles of fatty-acid elongation in Escherichia coli. J. Biol. Chem. 270:26538-26542. [DOI] [PubMed] [Google Scholar]
- 14.Heath, R. J., J. Li, G. E. Roland, and C. O. Rock. 2000. Inhibition of the Staphylococcus aureus NADPH-dependant enoyl-acyl carrier protein reductase by triclosan and hexachlorophene. J. Biol. Chem. 275:4654-4659. [DOI] [PubMed] [Google Scholar]
- 15.Heath, R. J., N. Su, C. K. Murphy, and C. O. Rock. 2000. The enoyl-acyl-carrier-protein reductases FabI and FabL from Bacillus subtilis. J. Biol. Chem. 275:40128-40133. [DOI] [PubMed] [Google Scholar]
- 16.Heath, R. J., Y. T. Yu, M. A. Shapiro, E. Olson, and C. O. Rock. 1998. Broad spectrum antimicrobial biocides target the FabI component of fatty acid synthesis. J. Biol. Chem. 273:30316-30320. [DOI] [PubMed] [Google Scholar]
- 17.Holdeman, L. V., E. P. Cato, and W. E. C. Moore (ed.). 1977. Anaerobe laboratory manual, 4th ed. Virginia Polytechnic Institute and State University, Blacksburg.
- 18.Hopkins, M. J., R. Sharp, and G. T. Macfarlane. 2001. Age and disease related changes in intestinal bacterial populations assessed by cell culture, 16S rRNA abundance, and community cellular fatty acid profiles. Gut 48:198-205. [DOI] [PMC free article] [PubMed] [Google Scholar]
- 19.Jenkins, S., M. Addy, W. Wade, and R. G. Newcombe. 1994. The magnitude and duration of the effects of some mouthrinse products on salivary bacterial counts. J. Clin. Periodontol. 21:397-401. [DOI] [PubMed] [Google Scholar]
- 20.Jones, C. L., J. A. Ritchie, P. D. Marsh, and F. Van der Ouderaa. 1988. The effect of long-term use of a dentifrice containing zinc citrate and a non-ionic agent on the oral flora. J. Dent. Res. 67:46-50. [DOI] [PubMed] [Google Scholar]
- 21.Kinniment, S. L., J. W. Wimpenny, D. Adams, and P. D. Marsh. 1996. The effect of chlorhexidine on defined, mixed culture oral biofilms grown in a novel model system. J. Appl. Bacteriol. 81:120-125. [DOI] [PubMed] [Google Scholar]
- 22.Kolenbrander, P. E., R. N. Andersen, and L. V. Moore. 1989. Coaggregation of Fusobacterium nucleatum, Selenomonas flueggei, Selenomonas infelix, Selenomonas noxia, and Selenomonas sputigena with strains from 11 genera of oral bacteria. Infect. Immun. 57:3194-3203. [DOI] [PMC free article] [PubMed] [Google Scholar]
- 23.Kroes, I., P. W. Lepp, and D. A. Relman. 1999. Bacterial diversity within the human subgingival crevice. Proc. Natl. Acad. Sci. USA 96:14547-14552. [DOI] [PMC free article] [PubMed] [Google Scholar]
- 24.Kwochka, K. W., and J. J. Kowalski. 1991. Prophylactic efficacy of four antibacterial shampoos against Staphylococcus intermedius in dogs. Am. J. Vet. Res. 52:115-118. [PubMed] [Google Scholar]
- 25.Levy, C. W., A. Roujeinikova, S. Sedelnikova, P. J. Baker, A. R. Stuitje, A. R. Slabas, D. W. Rice, and J. B. Rafferty. 1999. Molecular basis of triclosan activity. Nature 398:383-384. [DOI] [PubMed] [Google Scholar]
- 26.Levy, S. B. 2000. Antibiotic and antiseptic resistance: impact on public health. Pediatr. Infect. Dis. J. 19:S120-S122. [DOI] [PubMed] [Google Scholar]
- 27.McBain, A. J., R. G. Bartolo, C. E. Catrenich, D. Charbonneau, R. G. Ledder, and P. Gilbert. 2003. Growth and molecular characterization of dental plaque microcosms. J. Appl. Microbiol. 94:655-664. [DOI] [PubMed] [Google Scholar]
- 28.McBain, A. J., R. G. Bartolo, C. E. Catrenich, D. Charbonneau, R. G. Ledder, A. H. Rickard, S. A. Symmons, and P. Gilbert. 2003. Microbial characterization of biofilm in domestic drains and the establishment of stable biofilm microcosms. Appl. Environ. Microbiol. 69:177-185. [DOI] [PMC free article] [PubMed] [Google Scholar]
- 29.McKee, A. S., A. S. McDermid, D. C. Ellwood, and P. D. Marsh. 1985. The establishment of reproducible, complex communities of oral bacteria in the chemostat using defined inocula. J. Appl. Bacteriol. 59:263-275. [DOI] [PubMed] [Google Scholar]
- 30.McMurry, L. M., M. Oethinger, and S. B. Levy. 1998. Triclosan targets lipid synthesis. Nature 394:531-532. [DOI] [PubMed] [Google Scholar]
- 31.Moran, J., M. Addy, R. G. Newcombe, and I. Marlow. 2001. A study to assess the plaque inhibitory action of a newly formulated triclosan toothpaste. J. Clin. Periodontol. 28:86-89. [DOI] [PubMed] [Google Scholar]
- 32.Muyzer, G., and K. Smalla. 1998. Application of denaturing gradient gel electrophoresis (DGGE) and temperature gradient gel electrophoresis (TGGE) in microbial ecology. Antonie Leeuwenhoek 73:127-141. [DOI] [PubMed] [Google Scholar]
- 33.Packer, S., N. Woodley, M. Wilson, and P. Mullany. 1999. Prevalence and persistence of amoxycillin-resistant bacteria in the dental plaques of adults. Microbios 100:135-144. [PubMed] [Google Scholar]
- 34.Percival, R. S., S. J. Challacombe, and P. D. Marsh. 1991. Age-related microbiological changes in the salivary and plaque microflora of healthy adults. J. Med. Microbiol. 35:5-11. [DOI] [PubMed] [Google Scholar]
- 35.Peters, A. C., and J. W. T. Wimpenny. 1988. A constant-depth laboratory model film fermenter. Biotechnol. Bioeng. 32:263-270. [DOI] [PubMed] [Google Scholar]
- 36.Pratten, J., and M. Wilson. 1999. Antimicrobial susceptibility and composition of microcosm dental plaques supplemented with sucrose. Antimicrob. Agents Chemother. 43:1595-1599. [DOI] [PMC free article] [PubMed] [Google Scholar]
- 37.Rawlinson, A., B. I. Duerden, and L. Goodwin. 1993. New findings on the microbial flora associated with adult periodontitis. J. Dent. 21:179-184. [DOI] [PubMed] [Google Scholar]
- 38.Regos, J., O. Zak, R. Solf, W. A. Vischer, and E. G. Weirich. 1979. Antimicrobial spectrum of triclosan, a broad-spectrum antimicrobial agent for topical application. II. Comparison with some other antimicrobial agents. Dermatologica 158:72-79. [DOI] [PubMed] [Google Scholar]
- 39.Regos, J., and H. R. Hitz. 1974. Investigations on the mode of action of triclosan, a broad-spectrum antimicrobial agent. Zentbl. Bakteriol. Parasitenkd. Infektkrankh. Hyg. Abt. 1 Orig. Reihe A 226:390-401. [PubMed] [Google Scholar]
- 40.Satokari, R. M., E. E. Vaughan, A. D. Akkermans, M. Saarela, and W. M. de Vos. 2001. Bifidobacterial diversity in human feces detected by genus-specific PCR and denaturing gradient gel electrophoresis. Appl. Environ. Microbiol. 67:504-513. [DOI] [PMC free article] [PubMed] [Google Scholar]
- 41.Schweizer, H. P. 2001. Triclosan: a widely used biocide and its link to antibiotics. FEMS Microbiol. Lett. 202:1-7. [DOI] [PubMed] [Google Scholar]
- 42.Shah, H. N., R. A. D. Williams, G. H. Bowden, and J. M. Hardie. 1976. Comparison of the biochemical properties of Bacteroides melinogenicus from human dental plaque and other sites. J. Appl. Bacteriol. 41:473-492. [DOI] [PubMed] [Google Scholar]
- 43.Socransky, S. S., C. Smith, L. Martin, B. L. Paster, F. E. Dewhirst, and A. E. Levin. 1994. “Checkerboard” DNA-DNA hybridization. BioTechniques 17:788-792. [PubMed] [Google Scholar]
- 44.Socransky, S. S., C. Smith, and A. D. Haffajee. 2002. Subgingival microbial profiles in refractory periodontal disease. J. Clin. Periodontol. 29:260-268. [DOI] [PubMed] [Google Scholar]
- 45.Suller, M. T., and A. D. Russell. 2000. Triclosan and antibiotic resistance in Staphylococcus aureus. J. Antimicrob. Chemother. 46:11-18. [DOI] [PubMed] [Google Scholar]
- 46.Tresse, O., M. J. Lorrain, and D. Rho. 2002. Population dynamics of free-floating and attached bacteria in a styrene-degrading biotrickling filter analyzed by denaturing gradient gel electrophoresis. Appl. Microbiol. Biotechnol. 59:585-590. [DOI] [PubMed] [Google Scholar]
- 47.van Kooten T. G., J. M. Schakenraad, H. C. Van der Mei, and H. J. Busscher. 1992. Development and use of a parallel-plate flow chamber for studying cellular adhesion to solid surfaces. J. Biomed. Mater. Res. 26:725-738. [DOI] [PubMed] [Google Scholar]
- 48.Van Palenstein Helderman, W. H., M. Ijsseldijk, and J. H. J. Huis In 'T Veld. 1983. A selective medium for the two major subgroups of the bacterium Streptococcus mutans isolated from human dental plaque and saliva. Arch. Oral Biol. 28:599-603. [DOI] [PubMed] [Google Scholar]
- 49.Vischer, W. A., and J. Regös. 1974. Antimicrobial spectrum of triclosan, a broad-spectrum antibacterial agent for topical application. Zentbl. Bakteriol. Parasitenkd. Infektkrankh. Hyg. Abt. 1 Orig. Reihe A 226:376-389. [PubMed] [Google Scholar]
- 50.Vroom, J. M., K. J. De Grauw, H. C. Gerritsen, D. J. Bradshaw, P. D. Marsh, G. K. Watson, J. J Birmingham, and C. Allison. 1999. Depth penetration and detection of pH gradients in biofilms by two-photon excitation microscopy. Appl. Environ. Microbiol. 65:3502-3511. [DOI] [PMC free article] [PubMed] [Google Scholar]
- 51.Walker, C., L. C. Borden, J. J. Zambon, C. Y. Bonta, W. DeVizio, and A. R. Volpe. 1994. The effects of a 0.3% triclosan-containing dentifrice on the microbial composition of supragingival plaque. J. Clin. Periodontol. 21:334-341. [DOI] [PubMed] [Google Scholar]
- 52.Walter, J., G. W. Tannock, A. Tilsala-Timisjarvi, S. Rodtong, D. M. Loach, K. Munro, and T. Alatossava. 2000. Detection and identification of gastrointestinal Lactobacillus species by using denaturing gradient gel electrophoresis and species-specific PCR primers. Appl. Environ. Microbiol. 66:297-303. [DOI] [PMC free article] [PubMed] [Google Scholar]
- 53.Wei, G. X, J. S. van der Hoeven, J. W. Smalley, F. H. Mikx, and M. W. Fan. 1999. Proteolysis and utilization of albumin by enrichment cultures of subgingival microbiota. Oral Microbiol. Immunol. 14:348-351. [DOI] [PubMed] [Google Scholar]
- 54.Wilson, M. 1999. Use of constant depth film fermenter in studies of biofilms of oral bacteria. Methods Enzymol. 310:264-279. [DOI] [PubMed] [Google Scholar]
- 55.Zafar, A. B., R. C. Butler, D. J. Reese, L. A. Gaydos, and P. A. Mennonna. 1995. Use of 0.3% triclosan (Bacti-Stat) to eradicate an outbreak of methicillin-resistant Staphylococcus aureus in a neonatal nursery. Am. J. Infect. Control 23:200-208. [DOI] [PubMed] [Google Scholar]
- 56.Zybler, L. K., and H. V. Jordan. 1981. Development of a selective medium for detection and enumeration of Actinomyces viscosus and Actinomyces naseslundii in dental plaque. J. Clin. Microbiol. 15:253-259. [DOI] [PMC free article] [PubMed] [Google Scholar]