

Abstract
Objectives:
We sought to determine whether full-cycle glottal width measurements could be obtained with a quantitative laryngeal imaging system using videostroboscopy, and whether glottal width and vocal fold length measurements were repeatable and reliable.
Methods:
Synthetic vocal folds were phonated on a laboratory bench, and dynamic images were obtained in repeated trials by use of videostroboscopy and videokymography (VKG) with an imaging system equipped with a 2-point laser projection device for measuring absolute dimensions. Video images were also obtained with an industrial videoscope system with a built-in laser measurement capability. Maximum glottal width and vocal fold length were compared among these 3 methods.
Results:
The average variation in maximum glottal width measurements between stroboscopic data and VKG data was 3.10%. The average variations in width measurements between the clinical system and the industrial system were 1.93% (stroboscopy) and 3.49% (VKG). The variations in vocal fold length were similarly small. The standard deviations across trials were 0.29 mm for width and 0.48 mm for length (stroboscopy), 0.18 mm for width (VKG), and 0.25 mm for width and 0.84 mm for length (industrial).
Conclusions:
For stable, periodic vibration, the full extent of the glottal width can be reliably measured with the quantitative videostroboscopy system.
Keywords: endoscope, glottal width, laser, videokymography, videostroboscopy, vocal fold
INTRODUCTION
Videoendoscopy combined with videostroboscopy is a valuable tool for imaging vocal fold vibration, in both clinical and research settings.1 For imaging the stable, periodic vibration of normal, healthy vocal folds, videostroboscopy is one of the most practical techniques available,2 and can be routinely performed with a rigid (transoral) endoscope as long as articulatory speech production is not required during laryngeal imaging. To date, measuring vocal fold dimensions such as amplitude of vibration and length in absolute quantities has been difficult, because there is no standard reference for calibrating videoendoscopic images.3 A few researchers have proposed solutions to overcome this limitation,4-7 including the use of optical triangulation with a single or multiple laser dots to provide measurements in both the vertical and horizontal planes, or the projection of 2 precisely spaced laser dots in the video image for the quantitative measurement of vocal fold length and vibratory amplitudes.
The objective of this study was to determine whether a quantitative laryngeal imaging system, using a new 2-point laser projection device with a rigid endoscope and a digital videostroboscopy system, was able to measure the full extent of the glottal width for stable, periodic vibration, and whether the measurements were reliable and repeatable. Maximum glottal width measurements made with the videostroboscopy camera were compared to measurements made with a videokymography (VKG) camera, also with use of the laser device and a rigid endoscope. Because VKG produces a composite image of single scan lines from successive frames of standard video, frame rates of up to 8,000 images per second8 are possible, which is more than adequate to capture the full glottal width cycle. The key to making such a comparison was to image the vocal folds during stable, continuous oscillation over an extended period of time, so that the images obtained with the different cameras were of the same constant frequency and amplitude of vibration. To this end, a synthetic vocal fold model fabricated from a flexible polyurethane rubber compound was phonated on a laboratory bench, and dynamic images were obtained with both cameras and the new 2-point laser projection device. It was hypothesized that the difference between the measurements obtained with the 2 different techniques would be negligible for normal, stable phonation and periodic vibration.
In order to evaluate the accuracy of quantitative measurements made with the new 2-point laser device, we also obtained video images with an industrial videoscope system with a built-in laser measurement capability. The commercial system was designed for industrial applications, such as remote visual inspection of turbine engine blades, and was easily adapted to perform measurements with a model phonated on a laboratory bench. This report presents the results of the comparison of the glottal width and vocal fold length data extracted from dynamic images obtained with all 3 systems.
MATERIALS AND METHODS
Materials
A flexible synthetic glottis-shaped orifice simulating the geometry of human vocal folds was phonated on a laboratory bench, and dynamic images were obtained by means of videostroboscopy and VKG with the new 2-point laser projection system. The laser projection system was attached to the shaft of a KayPENTAX (Lincoln Park, New Jersey) model 9106 rigid laryngeal endoscope with a 70° forward viewing angle. Video images were also obtained with an industrial videoscope system with a built-in laser measurement capability. Figure 1 shows the schematic of the experimental setup. The KayPENTAX 9295 Digital Video Stroboscopy System with a model 8900 Videokymography Camera was used with the prototype 2-point laser projection system. The industrial reference system used was a model 81048020 Techno Pack X (TPX) System with a model V05021AEMV Flexible Videoscope, made by Karl Storz Industrial-America, Inc (Culver City, California). Pressurized air to drive the synthetic vocal folds was passed through a Fairchild (Winston-Salem, North Carolina) model 10 pressure regulator and an Omega FMA-1611A flowmeter, then heated and humidified with a Hudson RCI (Temecula, California) ConchaTherm III servocontrolled heater. A 3-foot (0.91 m) section of 0.75-inch (17.56-mm inner diameter) polyvinyl chloride tubing with a 90° elbow bend directed the regulated, heated air through the glottal orifice plate. Subglottal pressure was also measured with a Dwyer Instruments, Inc (Michigan City, Indiana), Slack Tube U-tube manometer.
Fig 1.

Schematic of experimental setup.
Design of Two-Point Laser Projection Device
The 2-point laser projection device was developed at the National Center for Voice and Speech (NCVS) in Denver, Colorado, and constructed in the optics laboratory of Dr Randall Tagg at the University of Colorado at Denver and Health Sciences Center. It consists of a battery-operated green (532-nm wavelength) laser diode module and customized optics to split the laser source into 2 beams and project them at the required angle. The peak power of the class IIIa laser diode was less than 5 mW. An anodized aluminum housing was machined for the laser diode module, which attached to the shaft of the rigid endoscope. The housing includes a thumb-operated miniature toggle switch for turning the laser on and off, and a DC power jack to connect an external battery pack to power the laser. A stainless steel cannula alongside the endoscope shaft houses a miniature beam displacer, which separates the single beam output of the laser module into 2 parallel beams with a separation distance of 2.0 mm. The beam displacer is an yttrium vanadate birefringent crystal, which is a geometrically ordered material with a variation in its refractive index that is sensitive to direction, such that an incident polarized light beam oriented at a 45° angle with respect to the crystal's optical axis is split into 2 orthogonal components. The 2 parallel beams emerging from the beam displacer are then reflected downward at an angle of −70° to match the optical axis of the endoscope, by means of a right-angle prism mirror set in an anodized aluminum end cap at the tip of the cannula. A schematic of the optics to achieve the beam splitting and reflection of the laser beam is shown in Fig 2A. A photograph of the laser optics in an optical bench breadboard is shown in Fig 2B. A clear glass window in the bottom of the end cap allows the 2 parallel beams to exit the cannula. The laser device attached to the endoscope can be seen in Fig 3A. The metal and glass components of the laser projection device were assembled with an optically clear, chemical-resistant epoxy, which allows the cannula to be chemically sterilized with the endoscope.
Fig 2.
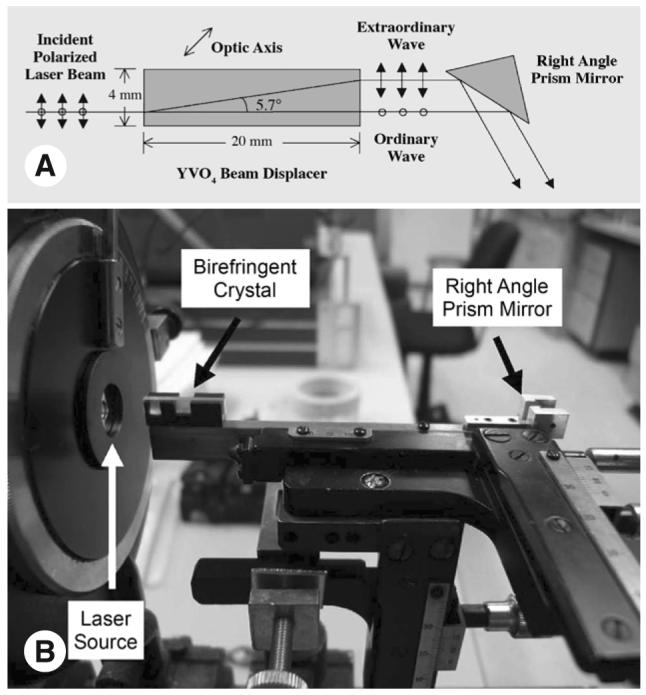
Design of 2-point laser projection device. A) Schematic of beam-splitting and reflection optics. B) Optical bench breadboard shows close-up of birefringent crystal and right angle prism mirror.
Fig 3.
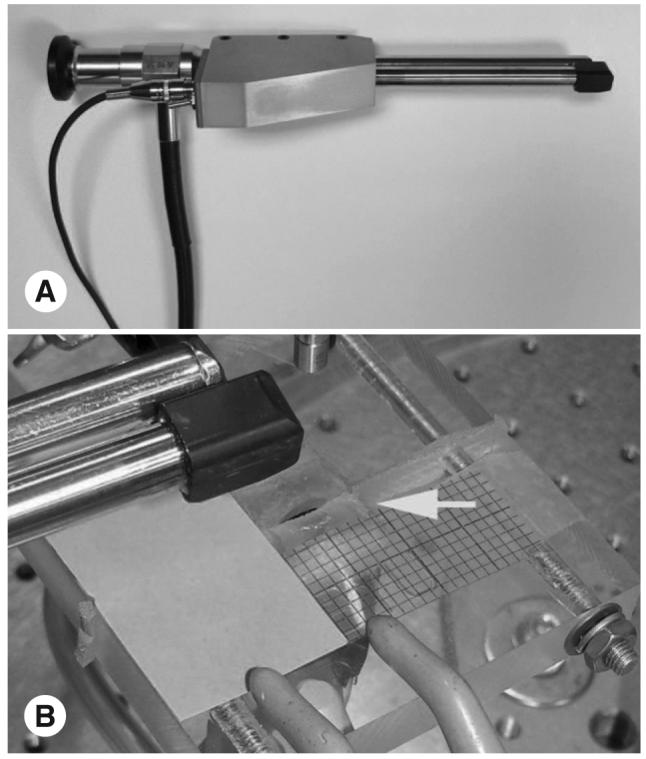
Equipment used in experiment. A) KayPENTAX model 9106 rigid endoscope with 2-point laser projection system attached. (Endoscope rod is on left; laser optics cannula is on right.) B) Rubber glottis-shaped orifice plate simulating human vocal fold geometry. Arrow indicates synthetic rubber vocal folds.
At an incident angle of −70°, the 2-mm-spaced parallel beams would theoretically project 2 dots with a spacing of 2.0/cos(20°) = 2.13 mm onto a horizontal plane. The actual distance between the laser dots was measured with a set of vernier calipers having a precision of 0.02 mm, made by Fowler Scientific, Indianapolis, Indiana. The calipers were laid on a flat surface and adjusted so that each laser dot fell on the “knife-edge” of each caliper blade. A series of repeated measurements were made in this manner with the laser projection device fixed at distances ranging from 3 to 6 mm above the caliper blades, and the average of these measurements was 2.20 mm with a standard deviation of 0.05 mm (about 2%).
Measurement of Two-Point Laser Projection System Precision and Accuracy
The precision of the dimensional measurements is defined as the smallest dimension that can be measured with the system to be qualified, and is determined by the pixel resolution of the images obtained with the digital video camera to which the endoscope and the 2-point laser system are attached. For the Panasonic GP-US522H camera used for videostroboscopy, the standard resolution is 768 × 487 pixels, and the endoscope field of view ranged from 16 × 16 mm at a distance of 3 cm above the image plane to 30 × 30 mm at a distance of 6 cm above the image plane. The field-of-view measurements were obtained by looking through the endoscope eyepiece at 2-mm graph paper. With these specifications, a maximum absolute error of 0.039 mm horizontally and 0.061 mm vertically was calculated, based on the 6-cm distance above the image plane. Thus for a 4-mm glottis width, the horizontal percent error is 1%, and for a 17-mm vocal fold length, the vertical percent error is 0.35%.
For the purposes of this report, accuracy is defined as the percent error between a measurement obtained with the system to be qualified and a standard reference measurement. Here, the average of the synthetic vocal fold length measured with the 2-point laser system was compared to the static length of the synthetic vocal folds measured by hand. The average length from the 5 videostroboscopy trials was 17.26 mm, including distances ranging from 3 to 6 cm above the glottal plane and elevation angles ranging from 0° to −10° relative to the glottal plane. Repeated measurements of the static length with a set of vernier calipers, made by Fowler Scientific, yielded an average length of 17.20 mm. Thus, the accuracy was calculated as 0.36%.
The total measurement error, including precision and accuracy, is therefore less than 1% in the vertical dimension and less than 2% in the horizontal dimension.
Description of Synthetic Vocal Fold Model
The synthetic vocal folds were designed and constructed by the research group of Dr Scott Thomson at Brigham Young University in Provo, Utah. The model was designed to simulate human vocal folds in terms of onset pressure, oscillation frequency, size and shape, and material properties.9 Each vocal fold was made by pouring a 3-part liquid silicone compound into a mold of the proper geometry, with an anterior-posterior length of approximately 1.7 cm and a slightly convergent angle of 5°. The liquid compound was allowed to cure, resulting in a flexible synthetic vocal fold, which was then attached to a 1.2-cm-thick rigid acrylic orifice plate. Two such plates were fastened together to form a full laryngeal configuration, as shown in Fig 2B. In the experiments described herein, the model was phonated at pressures of 16 to 20 cm H2O (1.6 to 2.0 kPa) and frequencies of 132 to 136 Hz. Thomson et al9 reported that the model could be operated for several hours with uninterrupted oscillations, unlike an excised larynx; in these experiments the model was operated for up to 20 minutes with stable, uninterrupted oscillations, making accurate comparisons among the 3 measurement methods in the same trial possible.
Description of Karl Storz TPX System
The Storz TPX video imaging system with a flexible fiberoptic scope was an industrial system intended for applications ranging from manufacturing quality control to aviation or power plant maintenance. The lens tip of the fiberscope emitted 1 of 2 red laser dot patterns, either a 6-dot grid or a 2-dot linear distance reference. The 2-dot pattern served the same purpose as the 2-point laser projection device built for this study; hence, it was an ideal “reference” system for comparison to the one we built for qualifying our system. The TPX system also included a host computer with interactive software to determine distance in still images from stored video. The user was required to first draw a reference line with the mouse between the 2 red laser dots in the image of interest; then, other lines could be drawn between 2 points in the image representing a desired distance measurement. The software computed the distance in the desired units based on the distance between the 2 dots, which was known to be 2.25 mm. The camera shutter speed can be set to up to 0.1 ms, but images are recorded at the standard NTSC (National Television System Committee) video frame rate of 29.97 frames per second. Thus, the TPX system can be considered a “quasi-high-speed” system. It was not intended to record high-speed motion, but rather worked best for stationary objects that were beyond the reach of standard visual or photographic inspection.
Image Data Acquisition
Digital video data were collected over 5 separate trials, in order to assess the consistency and repeatability of the measurement methods, and to perform statistical analyses of the dimensional results. Trials 1 through 4 were done with the endoscope at a constant distance of 3 cm above the glottal plane, with the plane of the endoscope axis (from eyepiece to tip) parallel to the glottal plane. For videostroboscopic measurements, the 120-W xenon lamp of the KayPENTAX RLS 9100B light source was used, operated in “fast” mode. For the VKG measurements, the 150-W halogen lamp of the KayPENTAX RLS 9100B light source was used, supplemented by an external high-wattage floodlight. The VKG data acquisition technique included obtaining standard full-frame video images of the synthetic vocal folds for a few seconds, during which the laser dots were turned on and off, to distinguish them from other reflections in the black-and-white video and to allow the distance calibration to be performed.
The tip of the Storz Flexible Videoscope was held fixed at a distance of 3.5 cm above the glottal plane. The camera shutter speed of the Storz TPX system was set to 0.5 ms. Care was taken to ensure that the synthetic vocal folds were in a constant, stable vibration mode for all the measurements by the different methods throughout each data collection session. Flow, temperature, and pressure conditions were recorded for each data collection session, and are summarized in Table 1. The flow in liters per second for each trial was calculated from the mass flow measured by the Omega FMA-1611A flowmeter in grams per minute. The driving pressure in kilopascals for each trial was calculated from the pressure measured by the U-tube manometer in centimeters of water.
TABLE 1.
FLOW, TEMPERATURE, AND PRESSURE CONDITIONS FOR EACH DATA COLLECTION TRIAL
| Trial | Flow (L/s) | Temperature (°C) | Pressure (kPa) |
|---|---|---|---|
| 1 | 0.63 | 25.63 | 1.65 |
| 2 | 0.71 | 24.20 | 1.88 |
| 3 | 0.75 | 24.03 | 1.96 |
| 4 | 0.76 | 25.49 | 1.92 |
A fifth trial, in which only videostroboscopic data were obtained, varied the endoscope distance from 3 to 6 cm above the glottal plane, and the endoscope elevation angle from 0° to −10° relative to the glottal plane.
Analysis of Digital Video Images
The digital video data from the various methods were analyzed on a frame-by-frame basis with a custom script written in Matlab (version 6.5.0.180913a, release 13, June 18, 2002, © 1984-2002, The MathWorks, Inc, Natick, Massachusetts). The individual frames were extracted for each video clip with Adobe Premier Pro (version 7.0 C522, Adobe Systems Incorporated, San Jose, California). The Matlab script required the experimenter to identify the vocal fold length in each frame. (For the synthetic model, this was fixed, but for human vocal folds in situ, a trained human eye is required to distinguish the anterior commissure and the vocal process from the surrounding tissue.) After that, the program ran automatically, utilizing a color detection algorithm to determine the width of the glottis at the vocal fold mid-membranous point. The glottal width was converted to absolute dimensions by applying the pixels-per-millimeter conversion factor obtained by measuring the laser dot distance in each video frame, and also using a color detection algorithm to detect the brightest pixels in the frame. By properly selecting the brightness threshold for this detection process, the peak of each laser dot could be detected, corresponding to a cluster of only a few pixels out of the entire dot of dispersed laser light. Because there were 2 dots, the algorithm returned a region of interest containing 2 clusters of pixels, and the dot distance was calculated as the distance between the centroids of the top and the bottom clusters. A cyclical representation of the glottal width and vocal fold length was then generated as a function of the frame number (and by extension, as a function of time, using the frame rate of 29.97 frames per second) for each video clip. An example of the automatic dot distance and glottal width detection is shown in Fig 4 for the KayPENTAX videostroboscopy data. The brightest peak of the top laser dot was not found to be in the center of the dot, perhaps because of the way the laser light was dispersed on the surface of the synthetic vocal fold. As mentioned previously, a pixel corresponds to about 0.06 mm in the vertical dimension, so if the distance were off by 2 to 3 pixels, the error in calculating the 2.2-mm dot distance would be less than 10%. Examples of the plot of the cyclical parameters are shown in Fig 5 for the videostroboscopy data and in Fig 6 for the TPX videoendoscopy data.
Fig 4.
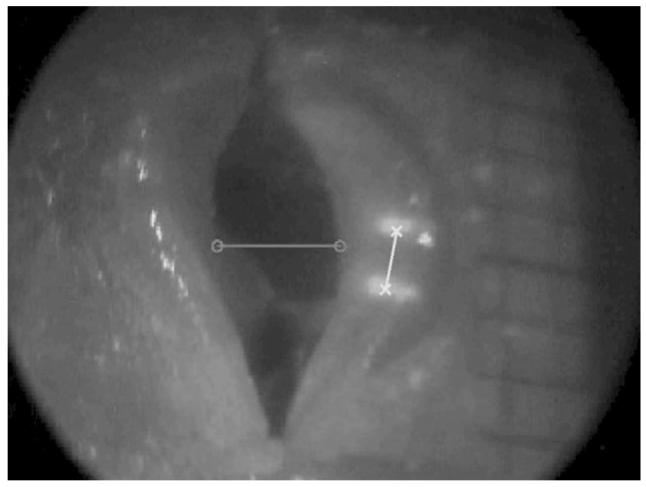
Sample videostroboscopy frame shows automatic dot distance and glottal width detection.
Fig 5.

Plot of frame-by-frame analysis of 4 seconds (120 frames) of stroboscopy video with 2-point laser projection system used to calculate absolute glottal width and absolute length of synthetic vocal folds. Circled data points are maximum glottal widths in each cycle used to calculate multicycle average.
Fig 6.
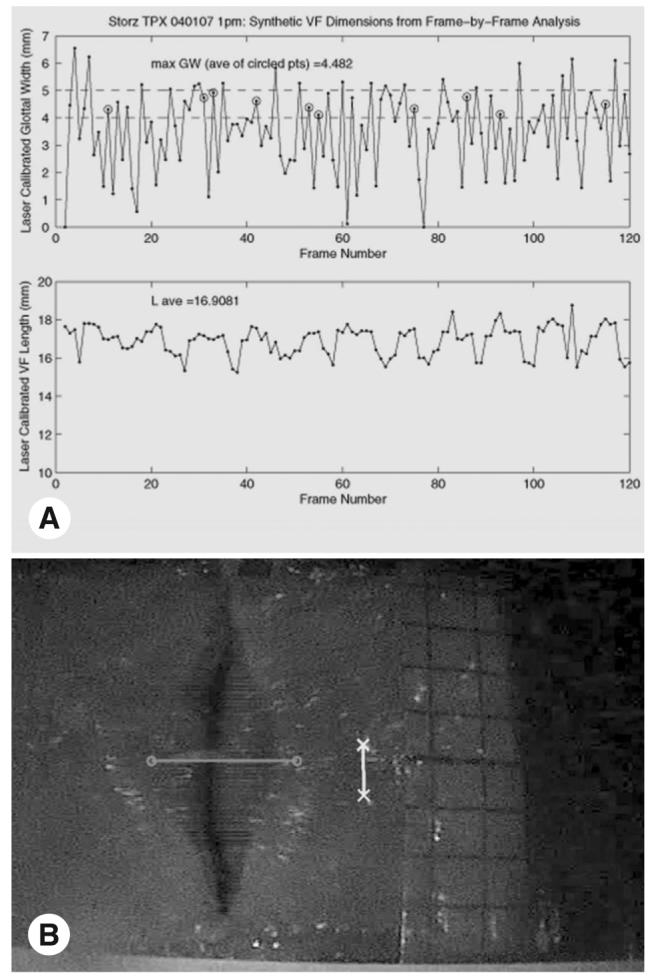
Results of frame-by-frame analysis of 4 seconds (120 frames) of video obtained with Karl Storz TPX videoscope system with LaserTrue used to calculate absolute glottal width and absolute length of synthetic vocal folds. Shutter speed is 0.5 ms. A) Cyclical plots of glottal width and vocal fold length versus frame number. Circled data points are results of automatic glottis detection software that were verified by visual inspection. Data points above 5 mm are errors in glottal detection software, and were not used to calculate multicycle average. B) Example of glottal detection error due to blurred picture.
The Matlab script was modified to perform the glottal width detection from the VKG video frames. An example of the output is shown in Fig 7.
Fig 7.

Glottal width detection using videokymography. A) Standard-mode frame of simulated vocal folds shows 2-mmspaced dots from 2-laser projection system. B) Sample frame of high-speed videokymography data used to calculate maximum glottal width of 4.43 mm.
RESULTS
Absolute measurements of maximum glottal width and vocal fold length were compared among the 3 methods. Table 2 lists the absolute glottal widths measured with all 3 methods, and the absolute vocal fold lengths measured with the KayPENTAX stroboscopy and Storz TPX systems. (Length cannot be measured with VKG.) The average glottal width, average length, and standard deviations across trials are also shown in Table 2 for each method. The standard deviations are an indicator of how consistent each measurement method was across trials. For the 2-point laser projection system, the standard deviation of the glottal width measurements was 0.29 mm for the stroboscopy method and 0.18 mm for the VKG method, and the standard deviation of the length measurements was 0.48 mm. By comparison, for the Storz TPX system, the standard deviations of the glottal width measurements and length measurements were 0.25 and 0.84 mm, respectively. This outcome shows that the new 2-point laser projection system is able to make consistent, repeatable measurements for the laryngeal dimensions of glottal width and vocal fold length, and is comparable to the Storz TPX system in terms of repeatability.
TABLE 2.
RESULTS OF MEASUREMENTS FROM THREE METHODS
| Trial | Multicycle Averages (mm) |
Two-Point Laser With KayPENTAX Strobe |
Two-Point Laser With KayPENTAX VKG |
Storz TPX |
|---|---|---|---|---|
| 1 | Maximum glottal width | 4.09 | 4.36 | 4.18 |
| Average vocal fold length | 16.86 | N/A | 17.63 | |
| 2 | Maximum glottal width | 4.43 | 4.42 | 4.24 |
| Average vocal fold length | 16.14 | N/A | 15.95 | |
| 3 | Maximum glottal width | 4.52 | 4.43 | 4.48 |
| Average vocal fold length | 17.05 | N/A | 16.91 | |
| 4 | Maximum glottal width | 3.89 | 4.05 | 3.86 |
| Average vocal fold length | 17.25 | N/A | 17.79 | |
| Average maximum glottal width across trials | 4.23 | 4.32 | 4.19 | |
| SD of maximum glottal width across trials | 0.29 | 0.18 | 0.25 | |
| Average vocal fold length across trials | 16.82 | N/A | 17.07 | |
| SD of vocal fold length across trials | 0.48 | N/A | 0.84 |
VKG — videokymograph; N/A — not applicable.
Table 3 shows the absolute variation in the width and length measurements between methods. Specifically, the width variation between the stroboscopy method and the VKG method was less than 7% over all trials, with an average variation of 3.10%. The variations in both length and width between the stroboscopy method and the TPX method were less than 5% over all trials, with an average width variation of 1.93% and an average length variation of 2.44%. The width variation between the VKG method and the TPX method was also less than 5% over all trials, with an average variation of 3.49%.
TABLE 3.
VARIATION IN WIDTH AND LENGTH MEASUREMENTS AMONG THREE METHODS
| Trial | Parameter |
Variation Between Strobe and TPX (%) |
Variation Between VKG and Strobe (%) |
Variation Between VKG and TPX (%) |
|---|---|---|---|---|
| 1 | Maximum glottal width | 2.25 | 6.27 | 4.15 |
| Average vocal fold length | 4.59 | N/A | N/A | |
| 2 | Maximum glottal width | 4.12 | 0.11 | 4.02 |
| Average vocal fold length | 1.17 | N/A | N/A | |
| 3 | Maximum glottal width | 0.76 | 1.94 | 1.16 |
| Average vocal fold length | 0.85 | N/A | N/A | |
| 4 | Maximum glottal width | 0.58 | 4.08 | 4.64 |
| Average vocal fold length | 3.16 | N/A | N/A | |
| Average glottal width variation across trials | 1.93 | 3.10 | 3.49 | |
| Average length variation across trials | 2.44 | N/A | N/A |
Table 4 shows the results of the fifth trial, in which the distance of the endoscope tip and the endoscope elevation angle were varied, for the stroboscopic method only. Estimates of the typical working distances during a rigid endoscopic examination of 4 to 9 cm and tilt angles from 5° to 10° have been reported previously in the literature.5,7 In this study, distances from 3 to 6 cm and angles from 0° to 10° were chosen on the basis of how the resulting image filled the field of view of the endoscope used, as viewed through the camera. All variations in glottal width and vocal fold length were less than 3%.
TABLE 4.
STROBOSCOPIC MEASUREMENTS AT VARIOUS WORKING DISTANCES AND TILT ANGLES
| Parameter |
3.0 cm Above Glottal Plane, 0° Elevation |
6.0 cm Above Glottal Plane, 0° Elevation |
4.0 cm Above Glottal Plane, −10° Elevation |
|---|---|---|---|
| Maximum glottal width multicycle average (mm) | 3.89 | 3.88 | 3.99 |
| % Variation from case 1 | 0.00 | 0.01 | −2.59 |
| Length multicycle average (mm) | 18.02 | 17.95 | 17.56 |
| % Variation from case 1 | 0.00 | 0.40 | 2.56 |
DISCUSSION
The reason for comparing the performance of the 2-point laser device with the videostroboscopy camera to the performance of the 2-point laser device with the VKG camera was to show that the strobe method can be used to capture the full extent of the amplitude cycle when stable, periodic vibration is being measured. The fact that VKG, with its extended time resolution (at the expense of spatial resolution) and therefore greater accuracy in measuring the dynamic characteristics of vocal fold vibration, yielded results similar to those obtained with stroboscopy proves this. The advantages of using the stroboscopy system rather than a high-speed system are that 1) the stroboscopic images are in color (so that green laser dots are clearly visible and distinguishable from the laryngeal tissue); 2) the stroboscopic images have a higher spatial resolution relative to high-speed systems; 3) longer recorded examination times are possible with stroboscopy relative to high-speed systems (yielding more cycles of vibration amplitude data); and 4) stroboscopy systems have lower cost and greater availability relative to high-speed or VKG systems. The reason for comparing the performance of the NCVS-built 2-point laser device to the Karl Storz TPX industrial videoendoscope was to show that the custom device built in our laboratory and workshop works just as well as a commercially available device generally accepted as providing accurate, reliable results.
The quantitative laryngeal imaging technique described in this article is part of an ongoing project to measure glottal width and vocal fold length in human subjects, and for future use in a clinical setting for the collection of human laryngeal dimensional data. To date, glottal width and vocal fold length data have been obtained for 1 male subject and 1 female subject. Glottal width data were obtained by computing the multicycle averages of the maximum glottal widths in multiple phonations, within the setting of a standard laryngeal examination using the quantitative imaging system described herein. Vocal fold lengths were obtained by computing the average length over multiple phonations. The maximum glottal widths were in the range of 0.7 to 2.6 mm for both the male and female subjects. Measured vocal fold lengths were between 8.8 and 14.7 mm for the male subject, and between 4.3 and 13.4 mm for the female subject. These measurements compare favorably to those reported in the literature.10
The custom software used to perform the video data processing was also qualified in this series of experiments. In order to perform the automatic detection of the dots and the glottal boundaries in each video frame, we varied the parameters of gamma, contrast, and brightness (adjusted by changing the colormap limits) in the initial version of the software and optimized them by trial and error for processing images obtained with the KayPENTAX Digital Video Stroboscopy System. It was found that the gamma and contrast values initially chosen were robust across the different methods and cameras; the only parameters that had to be adjusted for the processing of the Storz video images were the colormap limits affecting brightness of the laser dots and the glottal opening.
Although similar versions of the 2-point laser device exist (see Introduction), the advantages of our device include its simplicity of construction, use of a commonly available laser diode module (same as that used in green laser pointers), off-the-shelf optics (as opposed to custom-built, expensive, high-precision optics), and the fact that it was built for 70° forward angle endoscopes that are much easier to use for laryngeal examinations. (Previous versions reported in the literature all use a 90° projection angle.) Another unexplored but useful advantage is that the 2 beams produced by our device are orthogonally polarized with respect to each other; this configuration can be exploited in future experiments for analyzing the geometric properties of the mucosal tissue cellular lattice when light sources with different polarizations are reflected from it.
CONCLUSIONS
A quantitative laryngeal imaging system using a 2-point laser projection device in combination with a rigid endoscope and a videostroboscopy camera has been shown to obtain reliable measurements of maximum glottal width, as compared to results obtained with the same hardware and a VKG camera. The significance of this result is that the pseudocyclical representation of vocal fold vibration obtained with videostroboscopy was comparable to the full-cycle information obtained with VKG to within 7%, for stable, periodic vocal fold vibration, so the less expensive and more commonly available stroboscopy system can be used to measure normal, healthy vibration in humans. These measurements, along with quantitative measurements of vocal fold length, were found to be repeatable over multiple trials in which airflow and subglottal pressure were carefully controlled. The total measurement error with the videostroboscopy system was shown to be less than 2%, or less than 0.1 mm for glottal width measurements on the order of 4 mm. In clinical and research applications of videoendoscopy, accuracy requirements range from 1 to 2 mm (eg, for assessing symmetry) to submillimeter (eg, for assessing improvements in glottal closure as a result of thyroplasty). The system described herein meets or exceeds these requirements. Ongoing phases of a larger project will involve the use of the quantitative laryngeal imaging system with human subjects, to obtain laryngeal dimensional data and to study the effects of therapy or surgery to treat such conditions as glottal insufficiency, vocal fold paralysis, upper airway stenosis, and tissue damage from laryngeal reflux. Future versions of the 2-point laser projection system will incorporate the laser optics and the viewing optics into a single shaft.
Acknowledgments
The authors thank Dr Randall Tagg and Brad Busley in the Physics Department at the University of Colorado at Denver and Health Sciences Center, Denver, Colorado, for their assistance in the construction of the 2-point laser device; Dr Scott Thomson in the Mechanical Engineering Department at Brigham Young University, Provo, Utah, for providing the rubber glottis-shaped orifice plate; Dana Landry, formerly of Storz Endovision, Inc, for the loan of the Storz TPX System; and Kyle Malone, in the Media Relations Department at The Denver Center for the Performing Arts, for taking the photographs of the 2-point laser device and the orifice plate.
Funding for this work was provided by grant 1R01 DC04224 from the National Institute on Deafness and Other Communication Disorders.
REFERENCES
- 1.Kobler JB, Hillman RE, Zeitels SM, Kuo J. Assessment of vocal function using simultaneous aerodynamic and calibrated videostroboscopic measures. Ann Otol Rhinol Laryngol. 1998;107:477–85. doi: 10.1177/000348949810700605. [DOI] [PubMed] [Google Scholar]
- 2.Bless DM, Hirano M, Feder RJ. Videostroboscopic evaluation of the larynx. Ear Nose Throat J. 1987;66:289–96. [PubMed] [Google Scholar]
- 3.Rosen D, Minhaj A, Hinds M, Kobler J, Hillman R. Calibrated sizing system for flexible laryngeal endoscopy; Proceedings of the 6th International Workshop in Advances in Quantitative Laryngology, Voice and Speech Research; Hamburg, Germany. 2003. [Google Scholar]
- 4.Kobler JB, Rosen DI, Burns JA, et al. Comparison of a flexible laryngoscope with calibrated sizing function to intraoperative measurements. Ann Otol Rhinol Laryngol. 2006;115:733–40. doi: 10.1177/000348940611501004. [DOI] [PubMed] [Google Scholar]
- 5.Larsson H, Hertegård S. Calibration of high-speed imaging by laser triangulation. Logoped Phoniatr Vocol. 2004;29:154–61. doi: 10.1080/14015430410024353. [DOI] [PubMed] [Google Scholar]
- 6.Schade G, Leuwer R, Kraas M, Rassow B, Hess MM. Laryngeal morphometry with a new laser “clip on” device. Lasers Surg Med. 2004;34:363–7. doi: 10.1002/lsm.20065. [DOI] [PubMed] [Google Scholar]
- 7.Schuberth S, Hoppe U, Döllinger M, Lohscheller J, Eysholdt U. High-precision measurement of the vocal fold length and vibratory amplitudes. Laryngoscope. 2002;112:1043–9. doi: 10.1097/00005537-200206000-00020. [DOI] [PubMed] [Google Scholar]
- 8.Svec JG, Schutte HK. Videokymography: high-speed line scanning of vocal fold vibration. J Voice. 1996;10:201–5. doi: 10.1016/s0892-1997(96)80047-6. [DOI] [PubMed] [Google Scholar]
- 9.Thomson SL, Mongeau L, Frankel SH. Aerodynamic transfer of energy to the vocal folds. J Acoustic Soc Am. 2005;118:1689–700. doi: 10.1121/1.2000787. [DOI] [PubMed] [Google Scholar]
- 10.Nishizawa N, Sawashima M, Yonemoto K. Vocal fold length in vocal pitch change. In: Fujimura O, editor. Vocal physiology: voice production, mechanisms and functions. Raven Press; New York, NY: 1988. pp. 75–82. [Google Scholar]