Abstract
Using long Med-El Combi40+ electrode arrays, it is now possible to cover the whole range of the cochlea, up to about two turns. Such insertion depths have received little attention. To evaluate the contribution of deeply inserted electrodes, five Med-El cochlear implant users were tested on vowel and consonant identification tests with fittings with first one, two, and up to five apical electrodes being deactivated. In addition, subjects performed pitch-ranking experiments, using loudness-balanced stimuli, to identify electrodes creating pitch confusions. Radiographs were taken to measure each electrode insertion depth. All subjects used each modified fitting for two periods of about 3 weeks. During the experiment, the same stimulation rate and frequency range were maintained across all the fittings used for each individual subject. After each trial period the subject had to perform three consonant and three vowel identification tests. All subjects showed deep electrode insertions ranging from 605° to 720°. The two subjects with the deepest electrode insertions showed significantly increased vowel- and consonant-identification performances with fittings with the two or three most apical electrodes deactivated compared to their standard fitting with all available electrodes activated. The other three subjects did not show significant improvements in performance when one or two of their most apical electrodes were deactivated. Four out of five subjects preferred to continue use of a fitting with one or more apical electrodes deactivated. The two subjects with the deepest insertions also showed pitch confusions between their most apical electrodes. Two possible reasons for these results are discussed. One is to reduce neural interactions related to electrodes producing pitch confusions. Another is to improve the alignment of the frequency components of sounds coded by the electrical signals delivered to each electrode to the overall pitch of the auditory perception produced by the electrical stimulation of auditory nerve fibers.
Keywords: cochlear implant, insertion depth, interaction, pitch
INTRODUCTION
In an attempt to mimic the natural stimulation of the auditory nerve, cochlear implant systems use intracochlear electrodes distributed along the scala tympani to excite the auditory nerve-fiber endings. Electrical signals are delivered by these electrodes to code information extracted from different frequency bands. Cochlear implant systems exploit the frequency-position function of the human cochlea (tonotopy) discovered by von Békésy (1960) and further analyzed by Greenwood (1961, 1990). This frequency-position function describes the place along the cochlea of the maximal basilar membrane oscillation in response to acoustic tones of different frequencies. In cochlear implants the overall pitch produced by electrical excitation of the auditory nerve-fiber endings, according to each electrode insertion depth, is not exactly known. Note that this overall pitch is different from the normal auditory percept that conveys melody of the auditory perception in normal hearing persons and is also related to timbre. Acoustic to overall electric pitch comparisons (Boëx et al. 2006) conducted in cochlear implant subjects presenting residual hearing in their nonimplanted ear showed that the electric frequency-position function (pitch sensations versus electrode insertions) is better characterized by the insertion angles rather than insertion lengths, especially for electrode arrays designed to lie close to the inner wall of the cochlea. Whereas the measurements of angular electrode position could be improved if the round window position could be exactly measured, rather than estimated, the pitch sensations were found to be about one octave lower than they would be if determined by the frequency-position function of a normal ear.
The Med-El Combi40+ electrode array (Innsbruck, Austria) can be inserted to achieve very deep insertions, up to about two turns (Gstoettner et al. 1997; Kós et al. 2005), making it possible to cover almost the whole frequency range of the cochlea. The consequences of such insertion depths have received little attention. We can expect two particular effects resulting from such insertion depths: one is to deliver electrical signals coding low pitch sounds to a place of the cochlea innervated by auditory nerve fibers that are naturally excited by even lower pitch sounds; another effect would be to generate neural interactions between electrodes that can occur when two neighboring electrodes excite overlapping populations of fibers, at that place of the cochlea where the density of neuronal fibers is specially dense (Ariyasu et al. 1989).
The general goal of the present study was to investigate the benefit on speech reception of using very deep electrodes located close to the apical end of the cochlea in CIS sound-coding strategies (Wilson et al. 1991). Five Med-El cochlear implant users were tested on vowel and consonant identification tests with CIS fittings with between one and five of the most apical electrodes being deactivated while maintaining the same overall frequency coverage in the speech. To take account of adaptation to a new place representation of the spectrum (Rosen et al. 1999, Fu and Galvin 2003 for normal hearing subjects; Fu et al. 2002 for cochlear implant patients), subjects received two periods of about 3 weeks of experience with each experimental fitting, and their vowel and consonant identification tests were measured after each of these periods of experience. We analyzed the results of these tests with regard to angular electrode positions. To investigate the possibility that neural interaction that can occur with very deep electrodes, subjects performed pitch-ranking experiments for the whole electrode array, using loudness-balanced stimuli. Speech reception results obtained with the most apical electrodes deactivated are discussed with regard to the alignment of the center-frequencies of the CIS analysis filters to the estimated overall pitch produced by electric stimulation of apical electrodes, and with regard to the reduction of neural interaction expected deactivating apical electrodes presenting pitch confusions.
MATERIALS AND METHODS
Subjects
Five users of the Med-El Combi40+ implant (M09, M15, M16, M20, M22) participated in the study. Table 1 describes the age at which they received their cochlear implant, the duration of their deafness before they received their implant, the etiology of deafness of their implanted ear and the duration of implant use at the time of the study. Subject M22 was prelingually deaf (hearing threshold 90 db HL at 250 Hz; not measurable above 500 Hz). Subject M15 had residual hearing on his nonimplanted ear and continued the use of his acoustic hearing aid.
TABLE 1.
Individual subjects’ data (CI: cochlear implant): age at the time of the implantation, duration of deafness before implantation, etiology of deafness and duration of use of the cochlear implant at the time of testing
| Subject | Age at implant surgery (years) | Duration of deafness before CI (years) | Etiology of deafness | Duration of CI use at the time of the study (years) |
|---|---|---|---|---|
| M09 | 60 | 14 | Congenital (Progressive) | 2 |
| M15 | 55 | 0 | Unknown (Progressive) | 2 |
| M16 | 56 | 36 | Meningitis | 1 |
| M20 | 40 | 3 | Unknown (Progressive) | 1 |
| M22 | 23 | 23 | Congenital (Progressive) | 1 |
All subjects were volunteers. They were selected because of their willingness to participate in this study. This study followed the ethical guidelines of the Declaration of Helsinki. Each time the subjects attended the laboratory for the purposes of the study, they received an allowance for participation.
Electrode array
The Med-El™ Combi40+ implant has a soft and flexible array of 24 hemispherical contacts, 0.3 mm in diameter, wired in pairs to present a total of 12 electrodes. The total length of the array is 26.7 mm. The distance between the electrodes is 2.4 mm. Electrodes are numbered from the most apical to the most basal electrode from 1 to 12.
Implementation of CIS processors
All subjects have been using a standard CIS processor fitted with the Med-El CI-Studio+ fitting software. All subjects were users of the “behind the ear” Tempo+ processor.
Subjects tested CIS processors with one, two, and up to five most apical channels deactivated in successive phases of the study. Table 2 describes the main parameters of the CIS processors implemented for each subject. If possible, standard CIS processors were implemented to stimulate all the intracochlear electrodes of the implant. In the case of subjects M15 and M22, electrode 12 could not be used in any CIS processor because it was placed too close to the site of the round window. A minimum of seven (M09), eight (M15 and M20), or nine (M16 and M22) electrodes were used in a processor. For instance, subject M09 used initially a standard 12-channel CIS processor; afterward she tested processors with 11, 10, 9, 8, and finally 7 channels. The same rate of stimulation (pulses per second, pps) was maintained across all the fittings used for each individual subject. The highest rate used was 1,653 pps (M22) and the lowest rate used was 1,163 pps (M16 and M20). We kept the overall acoustic frequency range the same within each subject within the limitations of the CI-Studio+ fitting software, which forced small changes of channel-cutoff frequencies as the number of channels was varied.
TABLE 2.
Common parameters of CIS fittings tested
| Maximum number of channels | Discarded electrode in all maps | Max. number of apical channels turned off | Rate of stimulation (pps) | Phase duration (μs) | Min.–max. apical channel-cutoff frequencies (Hz) | Min.–max. basal channel-cutoff frequencies (Hz) | |
|---|---|---|---|---|---|---|---|
| M09 | 12 | – | 5 | 1,500 | 26.7 | 234–266 | 5,606–6,103 |
| M15 | 11 | 12 | 3 | 1,268 | 35 | 350–372 | 5,861–6,128 |
| M16 | 12 | – | 3 | 1,163 | 35 | 348–367 | 7,181–7,466 |
| M20 | 12 | – | 4 | 1,163 | 35 | 348–378 | 7,048–7,466 |
| M22 | 11 | 12 | 2 | 1,653 | 26.7 | 297–310 | 7,122–7,334 |
Minimal and maximal channel cutoff frequencies are determined by the CI-Studio+ fitting software and varied slightly according to the number of channels. Parameters such as phase duration or rate of stimulation were kept as they were determined for the fitting that the subjects used at the beginning of the study.
Radiographs
Insertion depth measurements were assessed according to angular electrode positions. Hence, high-resolution radiographs were taken to measure these positions (modified Stenver’s view, as described by Marsh et al. 1993). To obtain the best image resolution, fluoroscopy (Philips Integris) was used with an exposure of about 80 mAs and 80 kV. The radiographs were used to define the angular position from the round window (Fig. 2) localized according to the method described by Cohen et al. (1996) and Xu et al. (2000). The insertion angle of electrodes was computed as described in Boëx et al. (2006).
FIG. 2.
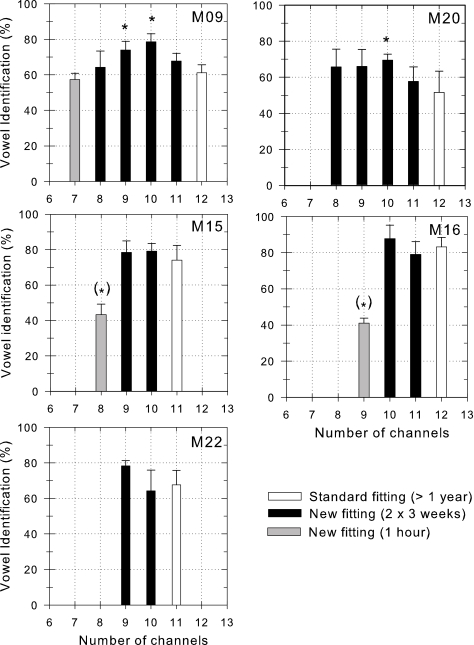
Percentages of correctly identified vowels obtained for each different CIS fitting, for each subject.
Consonant and vowel identification tests
Consonant and vowel identification tests obtained without visual cues were used to evaluate each implementation of the CIS processor (Pelizzone et al. 1993). The consonant test was composed of the 14 consonants of the French language (/b, d, f, g, k, l, m, n, p, R, s, t, v, and z/) presented as tokens: “aba”, “ada”, etc. The vowel test was composed of the seven vowels of the French language (/a, ã, e, i, y, and u/) presented as isolated tokens: “a”, “an”, etc. The subjects were seated 1 m from the loudspeaker (Fostex ™ UP203 S) in a sound-insulated chamber (IAC 1201 A). Blocks of 56 tokens were presented in random order, spoken by one male talker and played at a level of 75 dB (impulse rating, 35 ms) SPL A.
The significance of the overall effect of changing fittings within a subject on consonant or vowel identification performances was conducted with a repeated one-way ANOVA (dependent samples). We identified the fittings that led to significantly different consonant or vowel identification performances with a pairwise multiple comparison procedure, the Holm–Sidak method.
Evaluation of CIS processors
The initial fitting for each subject used the maximum number of available electrodes, 11 for Subject M15 and M22, 12 for all other subjects. Subjects had a period of experience with their own individual processor of between 1 and 2 years before the start of the study. During the study, the modified fittings were used for two periods of about 3 weeks each. A fitting was randomly assigned to each period for each subject. In total, the subjects tested each new fitting for a period of about 6 weeks. Some subjects refused to use fittings with most deactivated apical electrodes. A different color code (gray) is used in the RESULTS section to present performances obtained with these fittings. After finishing each 3-week trial period, subjects performed three consonant and three vowel identification tests. In total, each fitting was evaluated by six consonant and six vowel identification tests.
Pitch-ranking measures
Pitch-ranking measures were conducted to investigate if particular electrode pairs produced pitch confusions to illustrate the potential neural interactions between electrode pairs. If a particular pair of electrodes produces indiscriminable pitch sensations, we might expect that they stimulate overlapping populations of fibers. All stimuli consisted of 300 ms duration trains of 40-μs/phase biphasic pulses presented at a rate of 1,562 pulses per second (pps). Before the experiment, the electrical stimuli were loudness-balanced across electrodes. Initially, the loudness reference was defined as the stimulus amplitude producing a comfortable loudness sensation on electrode 6, which is placed at the middle of the array. A two-interval, two-alternative, forced-choice protocol (2I-2AFC) was used. A constant stimulus method was used. Test pairs consisting of the reference-electrode stimulation (one burst, constant amplitude) and of the stimulation of the reference’s neighboring electrode (one burst, varying amplitudes) were presented to subjects. Eight amplitudes of stimulation of the neighboring electrode were computed to encompass the loudness sensation equivalent to that produced by the reference-electrode stimulation, from clearly softer to clearly louder than the reference (resulting in about 80 and 120% of the balanced amplitude; in steps of about 5% of the balanced amplitude). Stimuli were presented in a random order, either reference electrode first or neighboring electrode first. The subject was asked to indicate which interval contained the louder sensation. If the subject could not perceive a difference in loudness, he was instructed to guess. Bursts were separated by an interval of 0.5 s. Each amplitude was tested five times in a random order. The resulting 40 presentations were analyzed by computing the average responses obtained at each amplitude and fitting a psychometric function to those average data. The psychometric function, i.e., the cumulative integral of a Gaussian distribution, was of the form  where μ and σ correspond to the mean and standard deviation of the underlying Gaussian distribution, respectively. The 50% point of the best fit to this function was used to determine the most equivalent loudness-balanced amplitude. The 25 and 75% points were used to define error bars; they describe the spread of the psychometric curve. Once the most equivalent loudness-balanced amplitude had been determined for one electrode, it was then also used as a reference to balance the next neighboring electrode. Hence, we balanced for instance pairs 6–7, 5–4, 7–8, 4–3, and so on until all electrodes available were tested.
Once the loudness-balanced amplitudes were obtained for all electrodes, the pitch ranking experiment was conducted. All possible pairs of electrodes were compared four times, twice with the basal electrode first, twice with the apical electrode first, using a 2I-2AFC forced choice protocol. The subject was instructed to indicate which particular interval, either the first or the second, sounded the highest in pitch. All pairs, for which all four responses were not in agreement with the excepted tonotopy of the cochlea, were tested four more times during a different session.
RESULTS
Consonant and vowel identification with reduced numbers of channels
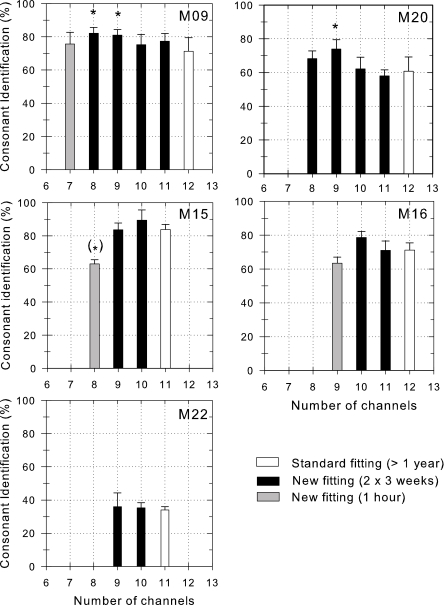
As will be described in detail, all five subjects increased their average performance in the vowel identification by 5 to 18%, and in the consonant identification by 2 to 13%, when using the modified fittings with the two or even three most apical electrodes deactivated. Figure 1 presents the average percentage of correctly identified consonants obtained for each fitting tested. Figure 2 presents the average percentage of correctly identified vowels obtained for each fitting tested. Each bar represents the mean of six different tests obtained in two different sessions. Bars in gray indicate scores that were obtained with fittings with most deactivated apical electrodes that subjects were not willing to wear in daily life. In these cases, the bars are the mean of the results of only three tests. Asterisks indicate scores significantly different from the scores obtained with the standard fitting with all available electrodes activated (Holm–Sidak method with overall significance level at 0.05, post one-way ANOVA).
FIG. 1.
Percentages of correctly identified consonants obtained for each different CIS fitting, for each subject. The number of activated electrodes of each tested fitting is indicated on the abscissa. White bars: fittings used in daily life up to the beginning of the study; black bars: fittings used for about two times 3 weeks in daily life; gray bars: fittings used for about 1 hour in laboratory only. Asterisks indicate scores significantly different from the scores obtained with the standard fitting using all 12 or 11 channels (if electrode 12 was placed too close to the site of the round window and could not be stimulated; P<0.05). Error bars are the standard deviations.
In subject M09, changing the number of channels had a significant effect on consonant identification performances (degree of freedom: 5; F=4.21; P<0.001). Subject M09 obtained higher consonant identification performance with the eight (t=3.86) or nine channel fittings (t=3.45), with the four or three most apical electrodes deactivated, compared to her former standard fitting with all 12 electrodes activated. In subject M09, changing the number of channels had a significant effect on vowel identification performances (df=5; F=8.69; P<0.001). She obtained higher vowel identification performance with the nine (t=3.36) or ten (t=5.10) channel fittings, with three or two apical electrodes deactivated, compared to her standard fitting. Subject M09 chose to use the ten-channel fitting with two most apical electrodes deactivated in daily life.
In subject M20, changing the number of channels had a significant effect on consonant identification performances (df=4; F=4.52; P<0.01). Subject M20 obtained higher consonant identification performance with the nine-channel fitting, with three deactivated apical electrodes compared to his former standard fitting with all twelve electrodes activated (t=3.10), or compared to his 11 (t=3.63) or to his ten channel fittings (t=3.06), with one or two apical electrodes deactivated. In subject M20, changing the number of channels had a significant effect on vowel identification performances (df=4; F=4.13; P<0.05). He achieved higher vowel identification performance with the ten (t=3.20) channel fittings, with two deactivated electrodes, than that achieved with 12 channels. Subject M20 chose to use the nine-channel fitting with the three most apical electrodes deactivated in daily life.
Subject M15 obtained slightly higher scores (+5%, not significant) in the consonant and vowel tests with a ten-channel fitting with one deactivated apical electrode. Subject M15 chose to use this fitting in daily life.
Subject M16 obtained slightly higher scores (+7%, +5%, for consonant and vowel tests, respectively; not significant) with a ten-channel fitting with two deactivated apical electrodes. Subject M16 did not accept the new fittings.
Subject M22, did not use each fitting twice. He is congenitally deaf, is a student and we did not want to disturb his studies. He did not obtain significantly different scores with the different fittings tested for both consonant and vowel tests. Nevertheless, he obtained slightly higher vowel scores (+10% and +2%, for vowel and consonant tests, respectively) with a nine channel fitting. Subject M22 chose to use the nine-channel fitting with the two most apical electrodes deactivated in daily life.
Consonant and vowel identification performances according to electrode insertions. Each subject’s radiograph is shown in Figure 3. All five subjects showed deep electrode insertions (M20, M09: 720°; M16 and M22: about 650°; M15: 605°).
FIG. 3.
Radiographs obtained for each subject after the modified Stenver’s view. The line going through the top of the superior semicircular canal and the center of the vestibule crosses the electrode array at the estimated site of the round window. The line going through the estimated site of the round window to the center of the first turn of the spiral made by the electrode array is used as the 0° reference line. In cases of deep electrode insertions, the line going through the estimated site of the round window to the center of the second turn of the spiral made by the electrode array is determined as the 720° line. Note that subject M16 showed a “bend” at the level of electrodes 9 and 10. This is caused by a fibrosis that was found in the basal turn of this subject at the time of the surgery.
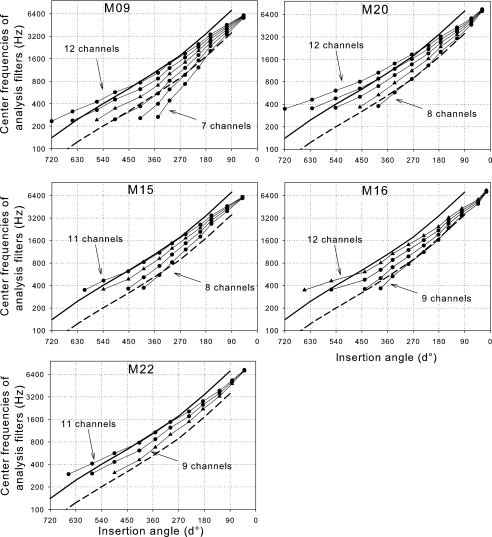
Figure 4 indicates the center frequencies of the analysis filters tested according to the angular position of each electrode stimulated. The solid line estimates the frequency-position function of a normal ear, adapted from Greenwood (1990) for angles from the reconstruction work of Kawano et al. (1996) as described in Boëx et al. (2006). The dashed line represents the same function shifted down one octave, which could describe the electric frequency-position function in relation to the angular position of electrodes in cochlear implant users (Boëx et al. 2006).
FIG. 4.
Center frequencies of analysis filters of CIS strategies tested. The angular position of each electrode stimulated for each strategy is indicated on the abscissa. Close symbols: fittings used for data shown in Figures 1 and 2; triangles: fittings that subjects decided to use in daily life. The solid lines represent Greenwood’s frequency-position function (1990) for a normal ear, using proportion of basilar length (a=0.06; k=1; total length: 35 mm) adapted for angles. The dashed lines represent the same function shifted down by one octave.
All subjects obtained their best consonant and vowel identification scores when the center frequencies of the analysis filters were located between the Greenwood’s frequency-position function of a normal ear and the electric frequency-position function (e.g., nine-channel distribution for M09, M20, and M22; 10-channel distribution for M15 and M16). Four out of five subjects decided to use in daily life a fitting whose center frequencies of the analysis filters (triangles) were situated between the Greenwood’s frequency-position function of a normal ear and the frequency-position function for electrical stimulation (dashed lines).
Pitch ranking
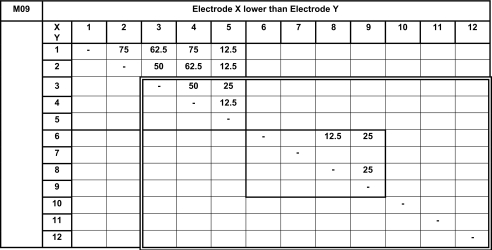
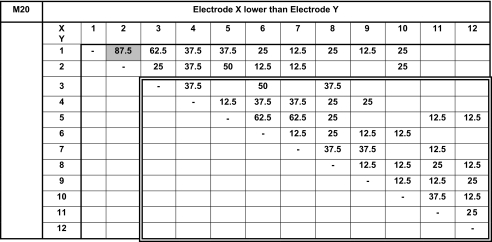
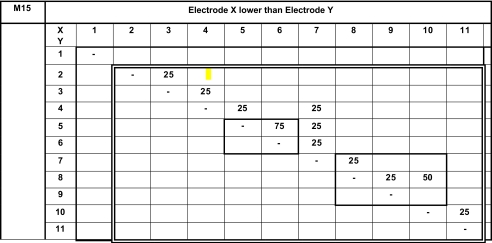
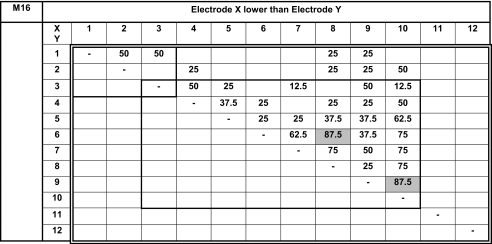
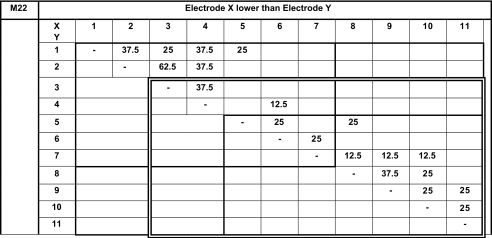
We present pitch-ranking results in the form of matrixes (Tables 3, 4, 5, 6 and 7). On these matrixes, we indicate the percentage of the presentations for which electrode X (ordinate) sounded lower than electrode Y (abscissa). The double-line rectangles represent the electrodes of the fitting chosen by the subjects at the end of the study. Because each electrode pair was only compared four or eight times, we cannot conclude on statistically based pitch confusions or reversals. Nevertheless, these pitch-ranking results can be used to illustrate, but not quantify, the potential neural interactions between electrodes.
TABLE 3.
Results of the pitch ranking experiments for subject M09
Percentages of the electrode-pair presentations for which electrode X (ordinate) sounded lower than electrode Y (abscissa). The complementary scores, i.e., the percentages of the presentations for which electrode X sounded higher that electrode Y, as expected for a tonotopic ordering, are not indicated. Zero (perfect) percent scores are not indicated (all pairs were tested). All possible pairs were tested first four times. All possible pairs stimulating electrodes 1 to 5 were tested four more times (light bold rectangle). The double line rectangles drawn on the matrix represents the selection of electrodes the subject finally decided to use.
TABLE 4.
Results of the pitch-ranking experiments for subject M20
All possible pairs were tested twice four times.
TABLE 5.
Results of the pitch-ranking experiments for subject M15
All possible pairs (for electrodes 1 to 11) were tested once four times. All possible pairs stimulating electrodes 5 and 6 were tested four more times (light bold rectangle). All possible pairs stimulating electrodes 8 to 10 were tested four more times (light bold rectangle).
TABLE 6.
Results of the pitch ranking experiments for subject M16
All possible pairs were tested once four times. All possible pairs stimulating electrodes 1 to 3 were tested four more times (light bold rectangle). All possible pairs stimulating electrodes 3 to 10 were tested four more times (light bold rectangle).
TABLE 7.
Results of the pitch-ranking experiments for subject M22
All possible pairs (for electrodes 1 to 11) were tested once four times. All possible pairs stimulating electrodes 1 to 7 were tested four more times (light bold rectangle). All possible pairs stimulating electrodes 5 to 11 were tested four more times (light bold rectangle).
The pitch-ranking data from subject M09 reveal pitch confusions between electrodes 1 and 2 (for 75% of presented pairs), between electrodes 1 and 3 (62.5%), between electrodes 1 and 4 (75%), between electrodes 2 and 3 or 4 (50%), and between electrodes 3 and 4 (50%). Subject M09 preferred to use the ten-channel fitting with deactivated electrodes 1 and 2, the two electrodes presenting most confusion as revealed by pitch-ranking measurements.
The pitch-ranking data from subject M20 reveal a pitch reversal between electrodes 1 and 2 (87.5%); pitch confusions (62.5% or 50%) between electrodes 1 and 3, 2 and 5, 3 and 6, 5 and 6 or 7. He finally preferred to use the ten-channel fitting with electrodes 1 and 2 deactivated, not using two out of the three electrodes presenting most pitch confusion.
The pitch-ranking data from subject M15 did not reveal pitch confusions (above 25%), except between electrode 5 and 6 (75%). Nevertheless, this subject preferred to use the ten-channel fitting with deactivated electrode 1.
The pitch-ranking data from subject M16 reveal pitch confusions between the three most apical electrodes (50 %), between electrodes 3 and 4 (50 %); pitch reversal (87.5 %) between electrodes 6 and 8, between electrodes 9 and 10. He also presented pitch confusions between electrodes 7 and 6 or 8, between electrodes 9 and 3 or 7, between electrodes 10 and nearly all other electrodes. Fibrosis found in the basal turn of the cochlea at the time of the surgery could create unusual electrical field patterns at the level of electrodes 9 and 10. It can be assumed that these severe basal pitch confusions were caused by fibrosis found at the time of the surgery in the basal turn of the cochlea in this subject, which possibly create unusual electrical field patterns. This subject preferred to use the fitting he always wore, using all 12 electrodes, whereas he also listened to fittings with deactivated electrodes 9 or 10.
The pitch-ranking data from subject M22 reveal pitch confusions between electrodes 2 and 3 (62.5 %). He preferred to use the nine-channel fitting with deactivated electrodes 1 and 2, which present most pitch confusion.
DISCUSSION
Two out of five subjects significantly improved their consonant and vowel identification performance when their standard fittings (used at least for a year) were replaced by fittings with up to three of their most apical electrodes deactivated. Three out of five subjects improved, although not significantly, their consonant and vowel identification performance when their standard fittings were replaced by fittings with one or two of their most apical electrodes deactivated. The four subjects who finally decided to change the fitting that they had been using in daily life chose a nine- or ten-channel fitting with one, two, or three most apical electrodes deactivated. All subjects had been wearing a fitting using all electrodes for many months before the beginning of the study. The new fittings used twice for a period of 3 weeks allowed patients to improve their performance above scores they had been getting for many months. All four subjects who decided to change the fitting they used in daily life will probably improve their performance still further.
The results of the present study do not demonstrate that very deeply inserted electrodes are beneficial for speech perception with the present sound-analysis filters set in the Tempo+ processor. Our 12- and eight-channel fittings would be similar to the “All 12” or to “Basal 8” fittings of the study by Hochmair et al. (2003). Eleven-, ten-, or nine-channel fittings tested in our study would be similar to “Basal 9, 10, or 11” that has not been tested in their study, keeping fixed rates and same frequency ranges for each patient. The low scores obtained by Hochmair et al. with “Basal 8” fittings are in agreement with low scores obtained without use in daily life by subjects M15 and M16 with eight or nine channels, respectively. Subjects M09 and M20 did not exhibit lower performance with eight-channel fittings than with 12-channel fittings. Both subjects had very deep electrodes and both subjects used each fitting twice for a period of 3 weeks over the course of our present study.
Two different phenomena could explain our results. On the one hand, the misalignment between the overall pitch perception produced by electrode stimulation and the center frequencies of the analysis filters (Fig. 4), can be increased in case of deep electrode insertion. On the other hand, some same fibers can be stimulated by different apical electrodes (neural interactions), as the pitch confusions across electrodes would suggest.
By not activating the most apical electrodes in subjects with deeply inserted electrodes (deeper than about 500°) although keeping the frequency bands identical as much as the CI-Studio+ fitting platform can allow it, we might move the center frequencies of the sound-analysis filters closer to the overall pitch of the auditory perception produced through stimulation of the electrodes. Thus, we could also explain the improvements in speech performance as caused by a reduced misalignment of acoustic frequency to cochlear place when apical electrodes were deactivated. Başkent and Shannon (2005) also showed that performance of four Med-El users did not reach a plateau in their increasing performances when the lowest analysis filter of the CIS processor was decreased to comply as far as possible with the electrode distance from the round window with regard to the Med-El CI-Studio+ fitting platform.
The consequences of the misalignment that can exist between the overall pitch of the auditory perception produced by electrical excitation of the auditory nerve-fiber endings and the electrical signals delivered on each electrode to code information extracted from different frequency bands (frequency-to-place misalignment) has been studied initially by means of acoustical simulations of cochlear implant systems in normal hearing subjects. Improvements were obtained when the frequency bands transmitted to electrodes were aligned to the overall pitch that would be produced by the electrode stimulation. Dorman et al. (1997) showed that speech reception increased significantly by simulating an electrode insertion increasing from 22 to 25 mm of the organ of Corti, whereas the center frequency of their lowest analysis filter was set to match the pitch that would be produced at a maximal basilar membrane oscillation of 26 mm. Shannon et al. (1998) showed that speech reception decreased dramatically when a misalignment between analysis filters and pitch produced of about two octaves was simulated. Başkent and Shannon (2003) showed that best performance was obtained when the analysis filters were aligned to the Greenwood’s frequency-position function of a normal ear (insertion ranging from 20 to 25 mm).
In cochlear implants, the detrimental effects of frequency-to-place misalignment on speech reception were illustrated using SPEAK processors (Fu and Shannon 1999b) or CIS processors (Fu and Shannon 1999a; Dorman and Ketten 2003). Fu and Shannon (1999c) showed that this misalignment was most important for low frequencies and apical electrodes. Başkent and Shannon (2004) investigated the detrimental effects of the frequency-to-place misalignment in subjects implanted with the 12-electrode Med-El Combi 40+ system listening under laboratory conditions to different sets of six-channel CIS processors. These subjects found a benefit in listening to fittings in which the center frequencies of the analysis filters were adjusted to electrode distances from the round window. Başkent and Shannon (2005) showed that Med-El patients obtained better performance with an aligned condition (1,322–7,500 Hz) than with a “compressed” condition (244–7,500 Hz) for full electrode insertion ranges (around 20 to 25 mm). Hence, these studies showed a benefit with an improved frequency-to-place alignment.
Pitch ranking can be used to evaluate roughly overlapping populations of fibers, excited by different electrodes. Whereas pitch confusion, revealed by pitch ranking (Simmons et al. 1979; Shannon 1983; Townshend et al. 1987; Dorman et al. 1990; Busby et al. 1994; Nelson et al. 1995; Collins et al. 1997; Collins and Throckmorton 2000), has not been yet shown to be directly related to neural interactions, we used in this study the pitch confusions found between electrodes as an indicator of the excitation produced by an intracochlear electrode. The pitch-ranking results indicate that for some apical electrodes the fibers stimulated would overlap with each other and create pitch confusions. That could be explained by the fact that the spiral ganglion is about 650° in humans (Kawano et al. 1996) and by the fact that “peripheral axons project increasingly oblique as the ganglion extended apically” (Ariyasu et al. 1989). Hence, if electrical stimulation of the very deep electrodes produces spiral ganglion excitation, the electrical stimulation could actually excite the same population of neurons. Not using electrodes with pitch confusions with neighboring electrodes could improve speech reception and could explain improvements observed with fittings, which did not use electrode 1 for subjects M09 and M20. Baumann and Nobbe (2006) reported pitch comparisons in Med-El patients with residual hearing in their nonimplanted ear. They showed that for four out of six subjects, the stimulation of the two most apical electrodes did not produce the perception of pitch differences. Boëx et al. (2003) reported the case of one Clarion S-series listener, implanted with a positioner (Fayad et al. 2003) who improved his consonant identification performance when his deepest apical electrodes (above 532°) were deactivated. This subject showed also important neural interactions on these apical electrodes.
CONCLUSION
Improvements (significant in two out of five patients) were obtained in all five patients with fittings with those electrodes inserted deeper than about 560° being deactivated. Two phenomena can contribute to these improvements: deactivating the most apical electrodes leads to 1) an improvement of the alignment of the center-frequencies of the analysis filters to the estimated overall pitch produced by electric stimulation, and 2) a reduction of interactions between apical electrodes that create pitch confusions. Once this selection of electrodes had been carried out, all subjects achieved excellent consonant and vowel identification performances (above 75% for postlingually deaf patients) with their Med-El CIS fittings. It will be of major interest to evaluate speech recognition with deep electrodes as soon as speech fittings are able to transmit sounds of a frequency of as low as, for instance, 70 Hz. During the clinical fitting of the sound coding strategy, it might be necessary to adjust the analysis filters to the pitch produced by the electrical stimulation of auditory nerve fibers to obtain, for instance, the maximum benefit from bilateral cochlear implants. This study describes a fitting method to improve the performance of many existing Med-El Combi 40 and 40+ implants.
Acknowledgments
This research work was supported by the Swiss National Research Foundation (SNSF grant 31-68263.02). We thank A. Faulkner and U. Baumann for their constructive comments on the manuscript. We thank all members of the “Centre Romand d’Implants Cochléaires” for their help in the laboratory. We thank C. Knuchel and M. Munster for their help in obtaining the radiographs. Most of all, we are especially grateful to the subjects for the time and the effort they devoted to this study.
References
- Ariyasu L, Galey FR, Hilsinger R, Byl FM. Computer-generated three-dimensional reconstruction of the cochlea. Otolaryngol. Head Neck Surg. 100(2):87–91, 1989. [DOI] [PubMed]
- Başkent D, Shannon RV. Speech recognition under conditions of frequency-place compression and expansion. J. Acoust. Soc. Am. 113(4):2064–2076, 2003. [DOI] [PubMed]
- Başkent D, Shannon RV. Frequency-place compression and expansion in cochlear implant listeners. J. Acoust. Soc. Am. 116(5):3130–3140, 2004. [DOI] [PubMed]
- Başkent D, Shannon RV. Interactions between cochlear implant electrode insertion depth and frequency-place mapping. J. Acoust. Soc. Am. 117(3 Pt 1):1405–1416, 2005. [DOI] [PubMed]
- Baumann U, Nobbe A. The cochlear implant electrode-pitch function. Hear. Res. 213(1-2):34–42, 2006. [DOI] [PubMed]
- Boëx C, Kós M-I, Pelizzone M. Forward masking in different cochlear implant systems. J. Acoust. Soc. Am. 114(4):2058–2065, 2003. [DOI] [PubMed]
- Boëx C, Baud L, Cosendai G, Baud L, Sigrist A, Kós M-I, Pelizzone M. Acoustic to electric pitch comparisons in cochlear implant subjects. J. Ass. Res. Otolaryngol. 7(2):110–124, 2006. [DOI] [PMC free article] [PubMed]
- Busby PA, Whitford LA, Blamey PJ, Richardson LM, Clark GM. Pitch perception for different modes of stimulation using the Cochlear multiple-electrode prosthesis. J. Acoust. Soc. Am. 95:2658–2669, 1994. [DOI] [PubMed]
- Cohen LT, Busby PA, Clark GM. Cochlear implant place psychophysics. 1. Pitch estimation with deeply inserted electrodes. Audiol. Neuro-Otol. 1:265–277, 1996. [DOI] [PubMed]
- Collins LM, Throckmorton CS. Investigating perceptual features of electrode stimulation via a multidimensional scaling paradigm. J. Acoust. Soc. Am. 108(5):2353–2365, 2000. [DOI] [PubMed]
- Collins LM, Zwolan TA, Wakefield GH. Comparison of electrode discrimination, pitch ranking, and pitch scaling data in postlingually deafened adult cochlear implant subjects. J. Acoust. Soc. Am. 101(1):440–455, 1997. [DOI] [PubMed]
- Dorman MF, Ketten D. Adaptation by a cochlear-implant patient to upward shifts in the frequency representation of speech. Ear Hear. 24(5):457–460, 2003. [DOI] [PubMed]
- Dorman MF, Smith L, McCandless G, Dunnavant G, Parkin J, Dankowski K. Pitch scaling and speech understanding by patients who use the Ineraid cochlear implant. Ear Hear. 11:310–315, 1990. [DOI] [PubMed]
- Dorman MF, Loizou PC, Rainey D. Simulating the effect of cochlear-implant electrode insertion depth on speech understanding. J. Acoust. Soc. Am. 102(5):2993–2996, 1997. [DOI] [PubMed]
- Fayad JN, Luxford W, Linthicum FH. The Clarion electrode positioner: temporal bone studies. Am. J. Otol. 21:226–229, 2003. [DOI] [PubMed]
- Fu Q-J, Galvin III JJ. The effects of short-term training for spectrally mismatched noise-band speech. J. Acoust. Soc. Am. 113(2):1065–1072, 2003. [DOI] [PubMed]
- Fu Q-J, Shannon RV. Recognition of spectrally degraded and frequency-shifted vowels in acoustic and electric hearing. J. Acoust. Soc. Am. 105(3):1889–1900, 1999a. [DOI] [PubMed]
- Fu Q-J, Shannon RV. Effects of electrode location and spacing on phoneme recognition with the Nucleus-22 cochlear implant. Ear Hear. 20:321–331, 1999b. [DOI] [PubMed]
- Fu Q-J, Shannon RV. Effects of electrode configuration and frequency allocation on vowel recognition with the Nucleus-22 cochlear implant. Ear Hear. 20:332–344, 1999c. [DOI] [PubMed]
- Fu Q-J, Shannon RV, Galvin III JJ. Perceptual learning following changes in the frequency-to-electrode assignment with the Nucleus-22 cochlear implant. J. Acoust. Soc. Am. 112(4):1664–1674, 2002. [DOI] [PubMed]
- Greenwood DD. Critical bandwidth and frequency coordinates of the basilar membrane. J. Acoust. Soc. Am. 33:1344–1356, 1961. [DOI]
- Greenwood DD. A cochlear frequency-position function for several species—29 years later. J. Acoust. Soc. Am. 87(6):2592–2605, 1990. [DOI] [PubMed]
- Gstoettner WK, Baumgartner WD, Franz P, Hamzavi J. Cochlear implant deep-insertion surgery. Laryngoscope 107:544–546, 1997. [DOI] [PubMed]
- Hochmair I, Arnold W, Nopp P, Jolly C, Müller J, Roland P. Deep electrode insertion in cochlear implants: apical morphology, electrodes and speech reception results. Acta Oto-laryngol. 123:612–617, 2003. [DOI] [PubMed]
- Kawano A, Seldon HL, Clark GM. Computer aided three dimensional reconstruction in human cochlear maps: measurements of the lengths of organ of Corti, outer wall, inner wall and Rosenthal’s canal. Ann. Oto-laryngol. 105:701–709, 1996. [DOI] [PubMed]
- Kõs MI, Boëx C, Sigrist A, Guyot JP, Pelizzone M. Measurements of electrode position inside the cochlea for different cochlear implant systems. Acta Oto-laryngol. 125(5):474–480, 2005. [DOI] [PubMed]
- Marsh MA, Xu J, Blamey PJ, Whitford LA, Xu SA, Silverman JM, Clark GM. Radiologic evaluation of multichannel intracochlear implant insertion depth. Am. J. Otol. 4:386–391, 1993. [PubMed]
- Nelson DA, Van Tasell DJ, Schroder AC, Soli S, Levine S. Electrode ranking of “place pitch” and speech recognition in electrical hearing. J. Acoust. Soc. Am. 98(4):1987–1999, 1995. [DOI] [PubMed]
- Pelizzone M, Boëx C, Montandon P. Vowel and consonant identification tests can be used to compare performances in a multilingual group of cochlear implant patients. ORL 55:341–346, 1993. [DOI] [PubMed]
- Rosen S, Faulkner A, Wilkinson L. Adaptation by normal listeners to upward spectral shifts of speech: implications for cochlear implants. J. Acoust. Soc. Am. 106(6):3629–3636, 1999. [DOI] [PubMed]
- Shannon RV. Multichannel electrical stimulation of the auditory nerve in man. I. Basic psychophysics. Hear. Res. 11:157–189, 1983. [DOI] [PubMed]
- Shannon RV, Zeng FG, Wygonski J. Speech recognition with altered spectral distribution of envelope cues. J. Acoust. Soc. Am. 104(4):2467–2476, 1998. [DOI] [PubMed]
- Simmons FB, Mathews RW, Walker MG, White RL. A functional multichannel auditory nerve stimulator. Acta Oto-laryngol. 87:170–175, 1979. [DOI] [PubMed]
- Townshend B, Cotter N, Van Compernolle D, White RL. Pitch perception by cochlear implant subjects. J. Acoust. Soc. Am. 82:106–115, 1987. [DOI] [PubMed]
- von Békésy G. Experiments in Hearing. New-York, McGraw-Hill, 1960.
- Wilson BS, Finley CC, Lawson DT, Wolford RD, Eddington DK, Rabinowitz WM. Better speech recognition with cochlear implants. Nature 352:236–238, 1991. [DOI] [PubMed]
- Xu J, Xu SA, Cohen LT, Clark GM Cochlear view: postoperative radiography for cochlear implantation. Am. J. Otol. 21:49–56, 2000. [PubMed]


