Abstract
We present an improved method for MALDI-MS analysis of proteins that have been electroblotted onto a nitrocellulose (NC) membrane. With this approach, electroblotted proteins can be analyzed directly for intact molecular weight determination or after on-membrane digestion by dissolution of the nitrocellulose in MALDI matrix solution containing 70% acetonitrile and 30% methanol. This solution helps maintain solubility of proteins and peptides while dissolving the NC membrane, which is dissolved by 100% acetone in other protocols. On-membrane tryptic digestion using this method requires half the time of in-gel digestion, and results in fewer missed cleavages and better protein coverage. For the membrane proteins studied, bovine uroplakins II and III, the protein coverage was almost twice that provided by conventional in-gel digestion, and the transmembrane domains of both uroplakins were detected only after on-membrane digestion. We also demonstrated the compatibility with MALDI-MS of a new dye, MemCode™, which is specifically designed for staining NC membrane-immobilized proteins and is faster and more sensitive than Ponceau-S. Our improved on-membrane digestion protocol greatly improves the study of soluble and, particularly strikingly, integral membrane proteins by mass spectrometry.
INTRODUCTION
Identification of proteins and characterization of posttranslational modifications are crucial steps for many biological, biochemical and biomedical studies. The resolving power of sodium dodecyl sulfate-polyacrylamide gel electrophoresis (SDS-PAGE), particularly when coupled with charge separation in two dimensional gels, has made it an effective technique for the separation of proteins extracted from biological samples.1,2 However, the accuracy of molecular weight determination of intact proteins by SDS-PAGE is low, with errors between 1–5% in the best case but often much greater depending on protein structure.3 The combination of SDS-PAGE with mass spectrometry has emerged as a powerful tool for proteomic studies in the last few years. Matrix-assisted laser desorption/ionization mass spectrometry (MALDI-MS) is particularly attractive, providing measurements with high sensitivity and a wide mass range, and allowing accurate molecular weight determination of intact proteins and peptides in mixtures with a relatively high tolerance to many frequently used buffer components.4–6
Characterization of SDS-PAGE-separated proteins is commonly followed by enzymatic or chemical cleavage of the proteins immobilized in the gel followed by MS analysis of the digested peptides.7,8 However, the effectiveness of in-gel digestion can be limited, because (i) the protease or other digestive reagents have limited accessibility to the gel-entrapped proteins; and (ii) large and/or hydrophobic peptides may be difficult to extract from the gel. It is therefore typical that less than 50% of the peptides from a digested protein can be detected by MS; this coverage is worse when studying integral membrane proteins that contain hydrophobic transmembrane domains. Such low protein coverage constitutes a serious problem for the study of posttranslational modifications, since potentially modified residues may be excluded from the analysis.9 Extracting large peptides from gels is even more of a challenge when analyzing proteins that have been chemically crosslinked, since the crosslinked peptides may escape detection.
Another challenge is the isolation of intact proteins from gels for the determination of their molecular weights by MS. Several approaches have been suggested, such as electroelution10, chemical extraction11 and passive diffusion.12. However, these methods are usually time-consuming and protein recovery can be low, especially when working with small (low picomole) levels of proteins. In addition, SDS, usually extracted together with the proteins, interferes with subsequent MS analysis. Removal of SDS using organic solvents has been demonstrated but only with small proteins and at high picomole levels.13 Alternatively, the electrophoretically separated proteins can be transferred by electroblotting onto a membrane support such as polyvinyl difluoride (PVDF) or nitrocellulose (NC). These supports have an excellent binding capacity for small and large proteins, and the bound proteins are free from SDS and other chemical additives, such as buffers, detergents, or salts. Different strategies have been developed using this approach for N-terminal sequence analysis,14,15 intact protein analysis,16 and on-membrane digestion.17
After the proteins are electroblotted onto a membrane, they can be characterized by MS using several approaches: (i) The proteins can be analyzed by on-membrane digestion followed by the extraction of the proteolytic peptides for MS analysis.18 As for in-gel digestion, however, the recovery of large peptides is low. (ii) The intact proteins can be eluted followed by in-solution digestion and MS analysis of the digested peptides.9,19 However, the extraction of intact proteins from NC membranes is difficult, especially for large ones, due to the strong protein-membrane binding. Moreover, it can take up to 72 hours to extract the intact proteins from a PVDF membrane;19 this approach is therefore very time-consuming and inefficient. (iii) The proteins or peptides on the membrane can be directly analyzed by MS.20–22 In this approach, it is crucial that the matrix solution can dissolve the nitrocellulose-bound proteins or peptides in order for them to be incorporated into the matrix crystals. (iv) The nitrocellulose support can be dissolved in the MALDI matrix solution for intact protein MW determination, or after on-membrane digestion, for digested peptide MS analysis.23 MALDI matrix solution prepared in 100% acetone has been used to dissolve the NC membrane followed by MS analysis of intact proteins or on-membrane digested peptides.16,23 This approach seems particularly promising because it bypasses the low yield step of protein extraction. Presumably, the 100% acetone used to dissolve the nitrocellulose can lead to the partial protein precipitation resulting in decreased sensitivity.
We encountered many of the above-mentioned technical problems when we set out to study the nearest neighbor relationships among uroplakin proteins, a group of integral membrane proteins that form 16 nm particles packed hexagonally to form 2D crystals (known as urothelial plaques) covering almost the entire urothelial apical surface.24–28 In previous experiments we demonstrated that treatment of purified urothelial plaques with various bifunctional crosslinking reagents yielded crosslinked proteins.29 However, when we attempted to identify by MS the crosslinked peptides after tryptic digestion, no cross-linked peptides could be detected using previously published protocols.
In this paper, we present an improved method for protein characterization based on the electroblotting of gel-separated proteins onto a NC membrane followed by either dissolution of the nitrocellulose band in the MALDI matrix solution for intact protein MS analysis, or on-membrane enzymatic digestion with subsequent dissolution of the nitrocellulose and MALDI-MS analysis of the digested peptides. Optimization of the MALDI matrix solution to include 70% acetonitrile and 30% methanol rather than 100% acetone greatly increased the sensitivity of the method. We also demonstrate that a new dye specifically designed for staining of NC membranes (Memcode™) is compatible with MALDI-MS and is more sensitive than Ponceau-S. We optimized the method using soluble proteins, and show that this improved procedure gave much better protein coverage than the conventional protocol when applied to two integral membrane proteins, uroplakins II and III. Our improved on-membrane digestion method offers many advantages over the widely-used in-gel digestion methods in terms of time required to complete the analysis, digestion efficiency and protein coverage, for both soluble and integral membrane proteins.
EXPERIMENTAL SECTION
Materials
100% Triton-free nitrocellulose membranes (pore size = 0.2 μm) and Coomassie® brilliant blue R-250 were purchased from Bio-Rad (Hercules, CA). Horse skeletal muscle myoglobin, carbonic anhydrase II from bovine erythrocytes, trifluoroacetic acid (TFA), polyvinylpyrrolidone (PVP-40), formic acid, acetic acid, ammonium hydrogen carbonate, glycine, sodium dodecyl sulfate (SDS), Ponceau-S and α-cyano-4-hydroxycinnamic acid (α-CHCA) were purchased from Sigma (St. Louis, MO). Mass spectrometry grade trypsin was purchased from Promega (Madison, WI). Tris (hidroxymethyl) aminomethane (Tris) and HPLC-grade acetone, acetonitrile, ethanol, water and methanol were purchased from Fisher Scientific (Morris Plains, NJ). Bovine asymmetric unit membranes (AUMs) containing four major uroplakins (Ia, Ib, II and IIIa) were purified from total bovine urothelial membranes as Sarkosyl-insoluble urothelial plaques according to published procedures.24,25,30 MemCode™ reversible protein staining kit was purchased from Pierce (Rockford, IL).
SDS-PAGE and In-Gel Digestion
Proteins were separated by SDS-PAGE on 12% polyacrylamide gels as described by Laemmli.31 After electrophoresis, the proteins were visualized by Coomassie blue staining. The gel bands were excised, destained, and the proteins digested in-gel32 without reduction and alkylation by adding 20μL of trypsin at 12.5 ng/μL prepared in 25 mM NH4HCO3 buffer (pH 8–8.5) and incubated at 37°C for various times between 30 min and 16 h. The resulting peptides were extracted from the gel using acetonitrile and 5% formic acid, dried under vacuum, and re-suspended in 20μL MALDI matrix solution prepared as a saturated solution in 50% acetonitrile and 50% water containing 0.1% TFA. The solution was sonicated for 10 min and 1μL spotted onto the MALDI plate for MS analysis of the tryptic peptides.
Electroblotting and On-membrane Digestion
After separation by SDS-PAGE as described above, electroblotting of proteins to a NC membrane was performed in a transfer buffer of 25 mM Tris, 192 mM glycine, 0.1% SDS and 20% ethanol (15C, 400 mA, and 1 h). Staining with 0.2% Ponceau-S prepared in 5% acetic acid was performed until the bands became visible (2–5 min), destaining was done in distilled water. MemCode™ staining and destaining were carried out according to the manufacturer’s instructions. The protein bands were excised and stored individually before complete removal of the dye.
The NC bands (3–4 mm2) were directly dissolved in 20–50μL of MALDI matrix solution prepared as a saturated solution of α-cyano-4-hydroxycinnamic acid (α-CHCA) in either 100% acetone or 70% acetonitrile and 30% methanol, containing 1% TFA. Solutions were sonicated for 10 min and 1 μL spotted onto the MALDI plate for MS analysis of intact proteins.
Before on-membrane digestion, non-specific protein binding sites on the nitrocellulose were blocked by adding 0.5 mL of 0.5% (w/v) PVP-40 prepared in 100mM acetic acid at 37C for 30 min. After washing the nitrocellulose 6–10 times with 1 mL Milli-Q water to remove excess PVP-40, 20 μL of trypsin at 12.5 ng/μL prepared in 25 mM NH4HCO3 buffer (pH 8–8.5) was added to the nitrocellulose pieces and incubated at 37°C for various times between 30 min and 16 h. After digestion, the samples were dried under vacuum and the NC bands dissolved in 40μL MALDI matrix solution prepared as a saturated solution of α-cyano-4-hydroxycinnamic acid (α-CHCA) in either 100% acetone or 70% acetonitrile and 30% methanol, containing 1% TFA. Solutions were sonicated for 10 min and 1μL spotted onto the MALDI plate for MS analysis of the tryptic peptides.
Mass Spectrometry
Linear and reflectron matrix-assisted laser desorption/ionization time-of-flight (MALDI-TOF) mass spectra were acquired using a Micromass (Manchester, UK) Tof Spec-2E mass spectrometer using standard parameters: a nitrogen laser (λ = 337 nm), laser pulse time 39 ns and accelerating voltage 20 kV. External calibration was carried out using angiotensin I (average mass = 1296.5 Da), corticotropin-like intermediate lobe peptide (ACTH clip 18–39, average mass = 2465.7) for peptide mass measurements or cytochrome C (average mass = 12,230 Da) and bovine serum albumin (average mass = 66,430 Da) for analyses of intact proteins. Typically, 100–200 laser shots were summed into each mass spectrum. The spectra obtained were processed using MassLynx MaxEnt 3 (Micromass, Ltd.) software.
RESULTS AND DISCUSSION
Optimization of the MALDI Matrix Solution
In previous studies involving nitrocellulose-bound proteins and peptides, 100% acetone was used for preparing the matrix solution because of its capacity for dissolving the NC membrane and its low boiling point. A major disadvantage of this solvent is, however, that it is commonly used to precipitate proteins and peptides. Therefore, we decided to test other organic solvents and solvent combinations, as well as different matrix and TFA concentrations, to improve protein and peptide recovery (Table 1). Acetonitrile, methanol and acetone were selected for testing due to their capacity to dissolve nitrocellulose membranes and their compatibility with MS. The three solvents were used alone or in binary mixtures at different ratios to dissolve nitrocellulose bands containing electroblotted intact myoglobin, carbonic anhydrase II or serum albumin. Every experiment was performed twice and each MS spectrum was a sum of 100 laser shots. The MS signal increased with the percentage of acetonitrile in the sample solution while samples dissolved with a solution containing any percentage of acetone yielded the lowest MS signals. The best MS signals were obtained using 70% acetonitrile and 30% methanol, which were used for further experiments. The matrix concentration did not have any significant effect on the MS signal, so the standard concentration (saturated solution, approx. 10 mg/mL) was selected. The optimum percentage of TFA was 1%. Lower concentrations decreased MS signals while higher ones did not improve the signal significantly.
Table 1.
Optimization of variables
| variable | range studied | optimum value |
|---|---|---|
| Acetone (%) | 0–100 | 0 |
| Methanol (%) | 0–100 | 30 |
| Acetonitrile (%) | 0–100 | 70 |
| TFA (%) | 0–3 | 1 |
| α-cyano (mg/mL) | 1–10 | 10 |
| Nitrocellulose (mm2/μL) | 0.20–0.08 | 0.10 |
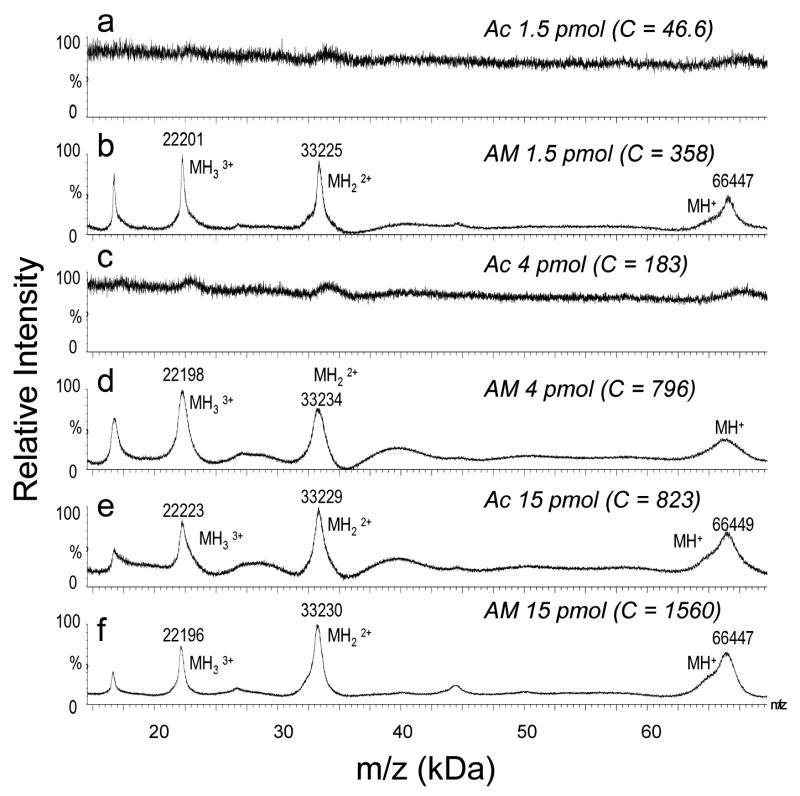
The optimized matrix solution demonstrated superior sensitivity for the analysis of mixtures of 200 fmol, 1 pmol, or 10 pmol electroblotted intact myoglobin (17 kDa) and carbonic anhydrase II (29 kDa) when using the optimized MALDI matrix solution (Figures 1b, 1d, and 1f) rather than 100% acetone (Figures 1a, 1c, and 1e). As little as 200 fmol myoglobin was detected using the optimized solution (Figure 1b), with no discernable signal for the same amount of protein using 100% acetone (Figure 1a). The optimized MALDI matrix solution also provided greater sensitivity for the analysis of a larger proteins, BSA (68 kDa) than the use of 100% acetone (Figure 2). As little as 1.5 pmol bovine serum albumin was successfully detected using the optimized solution (Figure 2b).
Figure 1.
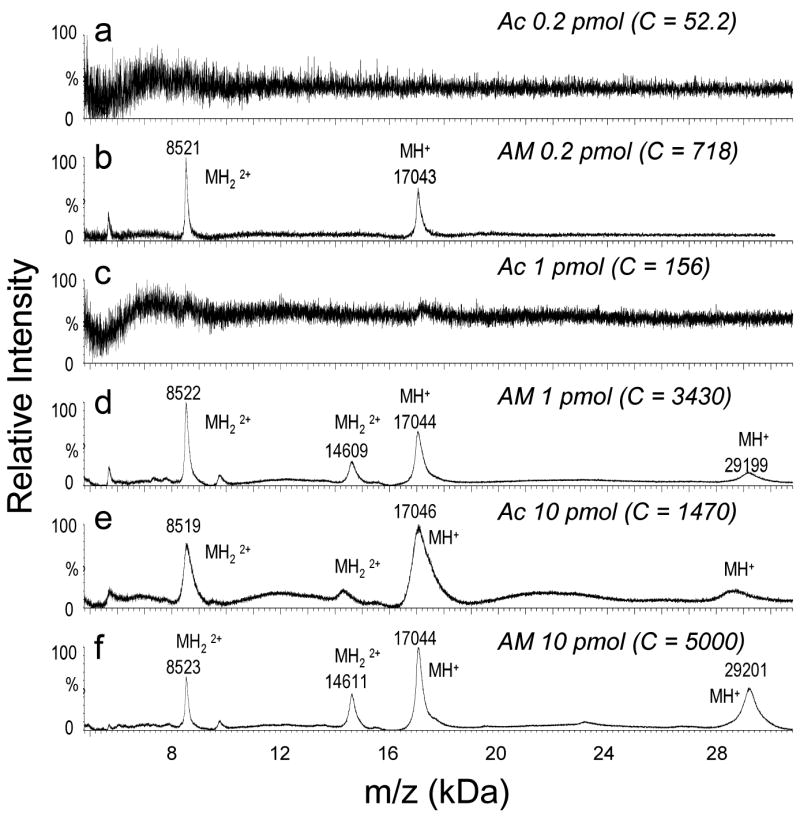
MALDI MS spectra (100 scans) obtained from a mixture of horse myoglobin and bovine carbonic anhydrase II at different concentrations, electroblotted onto a nitrocellulose membrane (3 mm2) and dissolved in 20μL of MALDI matrix solution prepared in either (a, c, e) 100% acetone (Ac) or (b, d, f) 70:30 acetonitrile:methanol (AM). C = base peak ion counts.
Figure 2.
MALDI MS spectra (100 scans) obtained from bovine serum albumin at different concentrations, electroblotted onto a nitrocellulose membrane (3 mm2) and dissolved in 20 μL of MALDI matrix solution prepared in either (a, c, e) 100% acetone (Ac) or (b, d, f) 70:30 acetonitrile:methanol (AM). C = base peak ion counts.
Optimization of the Nitrocellulose Concentration
The final NC concentration in the matrix solution was a key factor for determining the sensitivity of the method. A high NC concentration gave rise to viscous solutions that impeded the crystallization of the matrix, thus decreasing the MS signal. The high viscosity even made pipetting difficult. Using larger volumes of solvent to dissolve the NC membrane reduced the inhibiting effect of the NC on the MS signal by lowering its concentration, but at the expense of diluting the protein or peptides adsorbed onto the nitrocellulose. Therefore we tested different matrix solution volumes (Table 1) on a NC band (4 mm2) containing intact myoglobin. The best signal was obtained after dissolving the nitrocellulose in 40μL of matrix solution, giving a final NC concentration in the solution of 0.1 mm2/μL. Hence, this concentration was selected for further experiments.
Determination of the Molecular Weight of Intact Membrane Proteins
After failing to obtain a discernable signal using 100% acetone in the matrix solution (data not shown), the optimized matrix conditions were used to determine the molecular weights of two SDS-PAGE separated membrane proteins: bovine uroplakin II (UPII) and III (UPIII),24–26 as described in the Experimental Section. MALDI MS spectra were collected in linear mode as a sum of 200 laser shots. Singly and doubly charged peaks were detected for both proteins, allowing for a reasonably accurate measurement of their molecular weights. Previously, we had been unable to measure the molecular weight of either protein by mass spectrometry after SDS-PAGE, which suggested a rough molecular mass estimation of 15 kDa and 47 kDa for UPII and UPIII, respectively.24,25 The singly charged peak observed for UPII (Figure 3a; 10,582 Da) corresponds very well to the amino acid sequence-based, predicted mass of 10,584 Da. UPIII provided a singly charged peak at 37,157 Da (Figure 3b), which is ~6.5 kDa larger than the sequence-based, predicted mass of 30,757 Da. This suggests that UPIII is glycosylated, consistent with the broad UPIII peak shapes observed in the MALDI-MS spectrum (Figure 3b).
Figure 3.
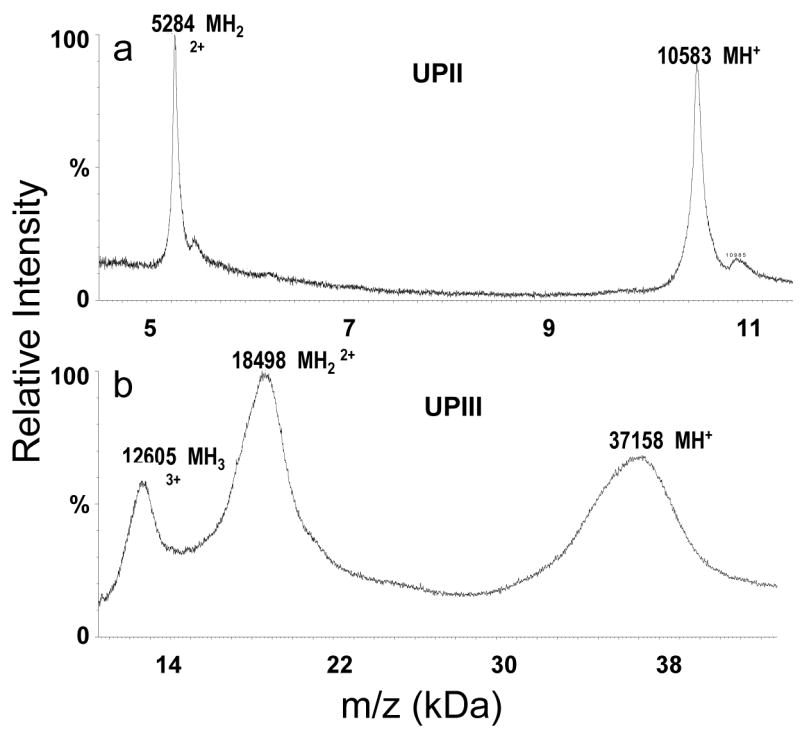
MALDI MS spectra (200 scans) obtained from (a) 10 pmol of bovine uroplakin II and (b) 3 pmol of bovine uroplakin III loaded on a gel, separated, electroblotted onto a NC membrane and dissolved in a MALDI matrix solution prepared in 70% acetonitrile and 30% methanol.
On-membrane vs. In-Gel Digestion
We compared the optimized on-membrane digestion protocol with in-gel digestion in terms of time, efficiency of the digestion, and protein coverage. Two soluble proteins, horse myoglobin and bovine carbonic anhydrase II, were digested for different times following either the in-gel (Figure 4a) or the on-membrane (Figure 4b) digestion procedure (see Experimental Section). There are two additional steps in the on-membrane digestion procedure that would seem to decrease the efficiency of the procedure: (i) the transfer of the proteins from the gel to the NC membrane and (ii) the blocking of the free NC sites to prevent adsorption of the trypsin to the nitrocellulose. Despite these extra steps, the on-membrane digestion procedure takes less time than in-gel digestion. The peptide extraction step is eliminated in the on-membrane approach since the nitrocellulose, and thus the peptides, are directly dissolved in the MALDI matrix solution. Moreover, the staining/destaining of a NC membrane with either Ponceau-S or MemCode takes no more than 25 min, instead of several hours (typically more than six) when using either Coomassie or silver staining.
Figure 4.
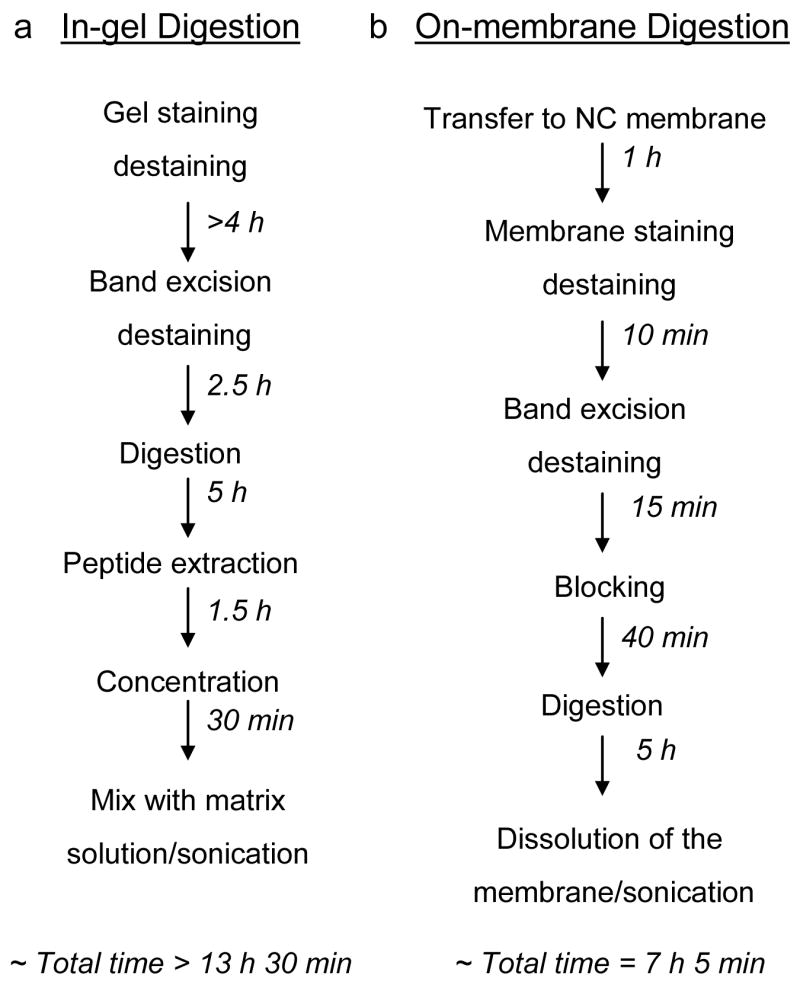
Time and steps required for the (a) in-gel and (b) on-membrane protein digestion approaches.
Different trypsin digestion times ranging from 30 min to 16 hours were tested using both methods. In general, the time needed for complete on-membrane digestion was half of that required for in-gel digestion (Figure 4). After an overnight (16 h) on-membrane digestion of carbonic anhydrase II (Figure 5a) and myoglobin (Figure 5b), one and no missed cleavage peptides were obtained, respectively. In the case of in-gel digestion, six and three missed cleavage peptides from carbonic anhydrase II and myoglobin, respectively, were detected after 16 hours of incubation. Because in-gel digestion led to more missed cleavage peptides than on-membrane digestion, we concluded that on-membrane digestion is more efficient than in-gel digestion. For both proteins and independent of the digestion time, the number of missed cleavage peptides detected was always higher after in-gel digestion, with no increase in protein sequence coverage by the observed peptides. More efficient cleavage by on-membrane digestion may be due to better accessibility of trypsin to the proteins binding onto the surface of the NC membrane as compared with the proteins immobilized in the gel. We expect that the advantage of access to protein substrates using on-membrane digestion would be even greater for proteases with higher molecular weight than that of trypsin (MW~27 kDa).
Figure 5.
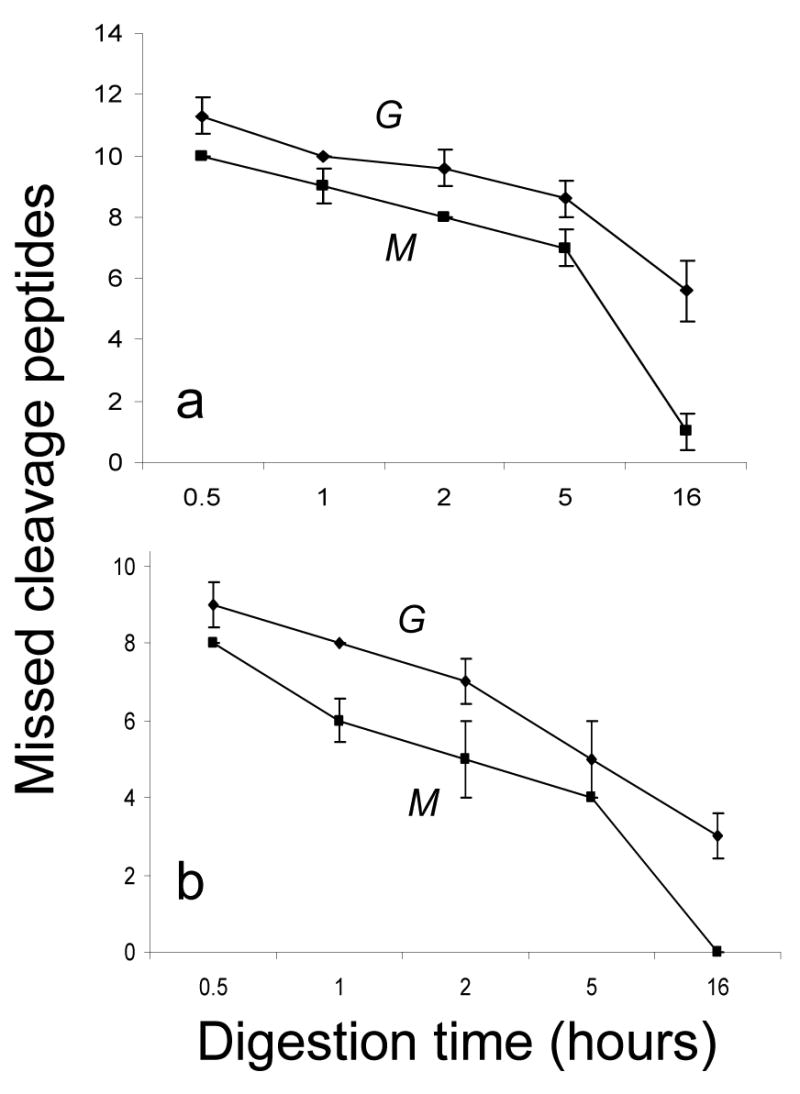
Comparison of the number of missed cleavage peptides obtained from (a) 4 pmol of carbonic anhydrase II and (b) 7 pmol of myoglobin after various in-gel (G) and on-membrane (M) digestion times. The numbers shown are the average values obtained from three experiments.
Compatibility of On-membrane Digestion and MS with MemCode Protein Staining
The new MemCode reversible protein stain was designed specifically for staining nitrocellulose membranes; however, as far as we know, it has not been shown to be compatible with on-membrane proteolytic digestion or mass spectrometry. This new dye offers several advantages over the widely used Ponceau-S: (i) improved avidity and higher sensitivity with a detection limit of 25 ng of protein vs. approximately 250 ng in the case of Ponceau-S and 50 ng for Coomassie blue in gels; (ii) provides turquoise bands that are easily photographed and do not fade over time, but can be easily removed; and (iii) requires a shorter staining time of 30 seconds vs. typically 5 min for Ponceau-S. Based on these considerations, we decided to test its compatibility with both mass spectrometry and on-membrane digestion.
The molecular weights of intact bovine carbonic anhydrase II and horse myoglobin were measured by MALDI-MS after the nitrocellulose bound proteins were visualized with Ponceau-S or MemCode. Nearly identical protein masses and peak widths were observed after MemCode staining and Ponceau-S. In addition, identical protein coverage by on-membrane tryptic digestion followed by MS was obtained after NC-bound carbonic anhydrase II and myoglobin were stained with Ponceau-S or MemCode. No adducts due to the MemCode stain were observed in any of the mass spectra. These results demonstrated that the MemCode stain is compatible with on-membrane digestion as well as MALDI MS analysis.
Application of On-membrane Digestion to Membrane Proteins
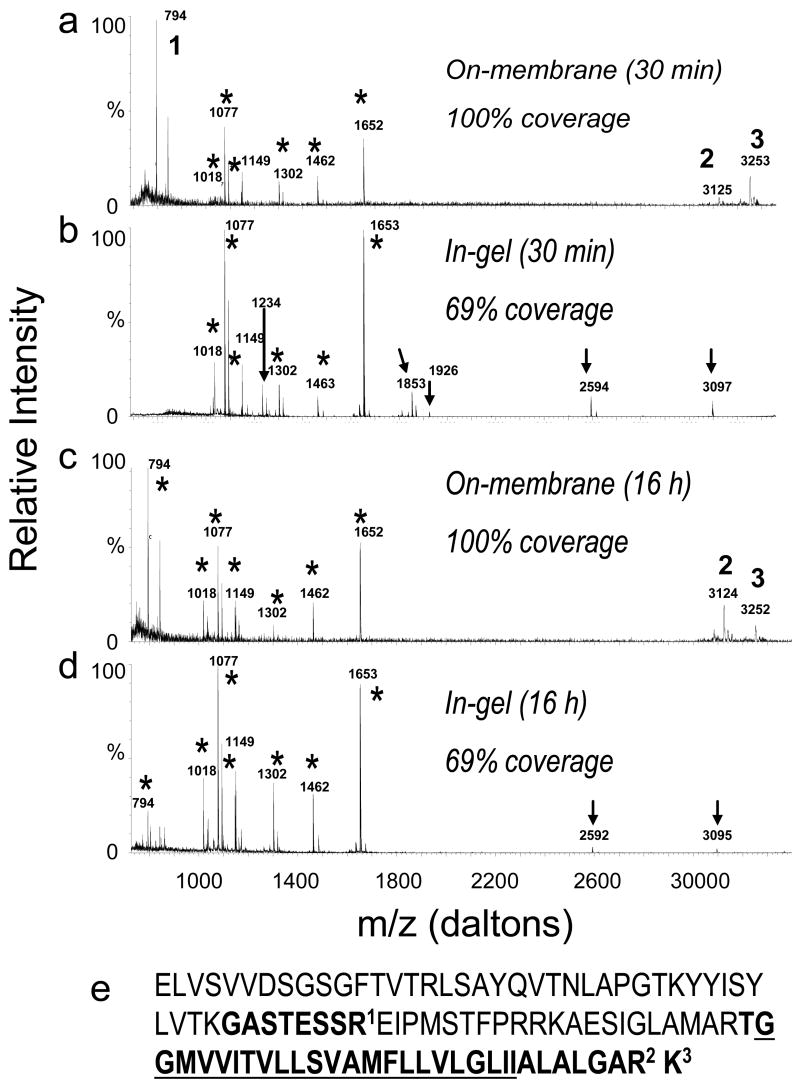
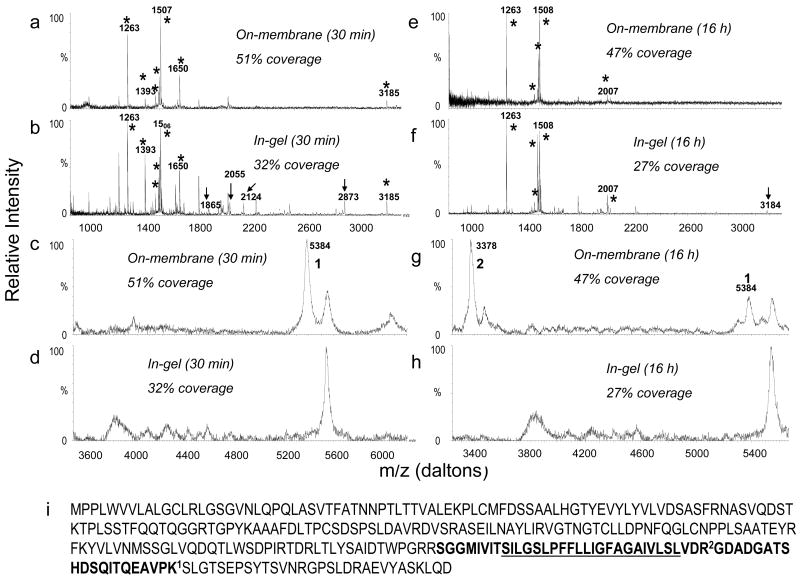
We next subjected bovine uroplakins II and III to the improved on-membrane protocol and in-gel tryptic digestion for 30 min and 16 hours to compare their abilities to enable detection of hydrophobic peptides, commonly present in integral membrane proteins and which cannot usually be extracted efficiently from the gel after in-gel digestion. In-gel tryptic digestion of UPII enabled sequence coverage of only 69% after 30 min (Figure 6a) or 16 h (Figure 6d) digestion time. Not surprisingly, two of the missing peptides of UPII after in-gel digestion (2 and 3 in Figures 6a and 6c) correspond to the C-terminal, transmembrane domain of UPII (Figure 6e). In contrast, even 30 min of on–membrane tryptic digestion of UPII yielded 100% sequence coverage (Figures 6a and 6c). Similar results were obtained in the case of UPIII (Figure 7). In-gel digestion yielded 32% percent sequence coverage (Figures 7b and 7d) which was not improved by prolonged incubation (Figures 7f and 7h). However, on-membrane digestion (both 30 min and 16 hr incubation; Figures 7e and 7g) gave protein coverage of 51% which was almost twice that of in-gel digestion. Again, the additional peptides seen after in-gel digestion did not increase protein coverage because they were missed cleavage peptides whose sequences were already covered by canonical tryptic peptides. The additional UPIII peptides detected only after on-membrane digestion (1 and 2 in Figure 7g) again correspond to the transmembrane domain of UPIII (Figure 7i). The fact that the protein coverage of UPIII was only about 50% even after on-membrane digestion is most likely due to glycosylation and potentially other posttranslational modifications of this protein. These two examples showed that on-membrane digestion is especially useful when dealing with membrane proteins, and allows the detection of large hydrophobic peptides usually undetected by MS after in-gel digestion.
Figure 6.
Comparison of MALDI MS spectra obtained from 10 pmol of uroplakin II (UPII) after (a) 30 min on-membrane digestion, (b) 30 min in-gel digestion, (c) 16 h on-membrane digestion and (d) 16 h in-gel digestion. (e) Amino acid sequence of bovine mature UPII sequence. The underlined amino acids correspond to the transmembrane domain of the protein. In the spectra, the stars indicate UPII peptides detected after both in-gel and on-membrane digestion, arrows indicate missed cleavage peptides that appear only after in-gel digestion, and the numbers indicate peptides from the UPII sequence shown in (e) detected only after on-membrane digestion.
Figure 7.
Comparison of MALDI MS spectra obtained from 3 pmol bovine uroplakin III (UPIII) after (a, c) 30 min on-membrane digestion, (b, d) 30 min in-gel digestion, (e, g) 16 h on-membrane digestion and (f, h) 16 h in-gel digestion. (i) Bovine UPIII sequence. The underlined amino acids correspond to the transmembrane domain of the protein. In the spectra, the stars indicate UPIII peptides detected after both in-gel and on-membrane digestion; arrows indicate missed cleavage peptides that appear only after in-gel digestion and the numbers indicate peptides detected only after on-membrane digestion. Spectra (a) (b) (e) and (f) were collected in reflectron mode and spectra (c) (d) (g) and (h) in linear mode.
CONCLUSIONS
We have presented an improved method for protein characterization by MALDI-MS after electroblotting of SDS-PAGE-separated proteins onto NC membranes. The improved approach allowed the determination of the molecular weight of intact proteins with higher sensitivity (as little as 200 fmol of myoglobin) than that of previously published methods, due to the use of a solution of 70% acetonitrile and 30% methanol instead of acetone to dissolve the NC in the MALDI matrix solution, thus minimizing protein loss most likely due to precipitation. We have been able to use this improved protocol to determine the molecular weights of two intact, integral membrane proteins, the uroplakins UPII and UPIII, with an error of less than 0.01% for UPII. We also demonstrated that the rapid and sensitive MemCode stain was compatible with MALDI-MS for the analysis of both intact and on-membrane digested proteins. Experiments with two soluble proteins, myoglobin and carbonic anhydrase II, showed a significant reduction in the number of missed cleavage peptides obtained after on-membrane digestion compared with in-gel digestion. Protein sequence coverage after on-membrane digestion was almost twice that of in-gel digestion for two integral membrane proteins, UPII and UPIII. Significantly, the large hydrophobic tryptic peptides containing the transmembrane domains of UPII and UPIII were detected only after on-membrane digestion. The total time required for the on-membrane digestion protocol described here is less than half of that needed for in-gel digestion. Our method for on-membrane digestion provides a fast and sensitive approach for characterization by MS of both soluble and integral membrane proteins.
Acknowledgments
We acknowledge support from NIH grants P30 NS050276, S10 RR14662, and S10 RR 017990 (T.A.N.), RO1DK39753 (T.T.S. and T.A.N.), DK52206, and DK66491 (T. T. S.), and the Consejeria de Educacion y Ciencia (Junta de Andalucia, Spain) for support to J.L.L.G.
References
- 1.Christman MF, Morgan RW, Jacobson FS, Ames BN. Cell. 1985;41:753–762. doi: 10.1016/s0092-8674(85)80056-8. [DOI] [PubMed] [Google Scholar]
- 2.Pandey A, Mann M. Nature. 2000;405:837–846. doi: 10.1038/35015709. [DOI] [PubMed] [Google Scholar]
- 3.Creighton TE. Proteins: Structures and Molecular Principles. W.H. Freeman; New York: 1984. pp. 33–34. [Google Scholar]
- 4.Karas M, Hillenkamp F. Anal Chem. 1988;60:2299–2301. doi: 10.1021/ac00171a028. [DOI] [PubMed] [Google Scholar]
- 5.Patterson SD, Aebersold R. Electrophoresis. 1995;16:1791–1814. doi: 10.1002/elps.11501601299. [DOI] [PubMed] [Google Scholar]
- 6.Beavis RC, Chait BT. Proc Natl Acad Sci USA. 1990;87:6873–6877. doi: 10.1073/pnas.87.17.6873. [DOI] [PMC free article] [PubMed] [Google Scholar]
- 7.Shevchenko A, Wilm M, Vorm O, Mann M. Anal Chem. 1996;68:850–858. doi: 10.1021/ac950914h. [DOI] [PubMed] [Google Scholar]
- 8.Van Montfort BA, Doeven MK, Canas B, Veenhoff LM, Poolman B, Robillard GT. Biochim Biophys Acta. 2002;1555:111–115. doi: 10.1016/s0005-2728(02)00264-5. [DOI] [PubMed] [Google Scholar]
- 9.Jonsson AP, Aissouni Y, Palmberg C, Percipalle P, Nordling E, Daneholt B, Jornvall H, Bergman T. Anal Chem. 2001;73:5370–5377. doi: 10.1021/ac010486h. [DOI] [PubMed] [Google Scholar]
- 10.Haebel S, Jensen C, Andersen SO, Roepstorff P. Protein Sci. 1995;4:394–404. doi: 10.1002/pro.5560040306. [DOI] [PMC free article] [PubMed] [Google Scholar]
- 11.Claverol S, Burlet-Schiltz O, Gairin JE, Monsarrat B. Mol Cell Proteomics. 2003;2:483–493. doi: 10.1074/mcp.T300003-MCP200. [DOI] [PubMed] [Google Scholar]
- 12.Cohen SL, Chait BT. Anal Biochem. 1997;247:257–267. doi: 10.1006/abio.1997.2072. [DOI] [PubMed] [Google Scholar]
- 13.Puchades EK, Westman A, Blennow K, Davidsson P. Rapid Commun Mass Spectrom. 1999;13:344–349. doi: 10.1002/(SICI)1097-0231(19990315)13:5<344::AID-RCM489>3.0.CO;2-V. [DOI] [PubMed] [Google Scholar]
- 14.Aebersold RH, Leavitt J, Saavedra RA, Hood LE, Kent SBH. Proc Natl Acad Sci USA. 1987;84:6970–6974. doi: 10.1073/pnas.84.20.6970. [DOI] [PMC free article] [PubMed] [Google Scholar]
- 15.Erdjument-Bromage H, Lui M, Sabatini DM, Snyder SH, Tempst P. Protein Science. 1994;3:2435–2446. doi: 10.1002/pro.5560031227. [DOI] [PMC free article] [PubMed] [Google Scholar]
- 16.Dukan S, Turlin E, Biville F, Bolbach G, Touati D, Tabet JC, Blais JC. Anal Chem. 1998;70:4433–4440. doi: 10.1021/ac980132z. [DOI] [PubMed] [Google Scholar]
- 17.Bai J, Qian MG, Liu Y, Liang X, Lubman DM. Anal Chem. 1995;67:1705–1710. doi: 10.1021/ac00115a017. [DOI] [PubMed] [Google Scholar]
- 18.Bunai K, Nozaki M, Hamano M, Ogane S, Inoue T, Nemoto T, Nakanishi H, Yamane K. Proteomics. 2003;3:1738–1749. doi: 10.1002/pmic.200300529. [DOI] [PubMed] [Google Scholar]
- 19.Jorgensen CS, Jagd M, Sorensen BK, McGuire J, Barkholt V, Hojrup P, Houen G. Anal Biochem. 2004;330:87–97. doi: 10.1016/j.ab.2004.03.012. [DOI] [PubMed] [Google Scholar]
- 20.Schleuder D, Hillenkamp F, Strupat K. Anal Chem. 1999;71:3238–3247. doi: 10.1021/ac9810720. [DOI] [PubMed] [Google Scholar]
- 21.Strupat K, Karas M, Hillenkamp F, Eckerson C, Lottspelch F. Anal Chem. 1994;66:464–470. [Google Scholar]
- 22.Vestling MM, Fenselau C. Anal Chem. 1994;66:471–477. [Google Scholar]
- 23.Liang X, Bai J, Liu Y-H, Lubman DM. Anal Chem. 1996;68:1012–1018. doi: 10.1021/ac950685z. [DOI] [PubMed] [Google Scholar]
- 24.Wu XR, Manabe M, Yu J, Sun TT. J Biol Chem. 1990;265:19170–19179. [PubMed] [Google Scholar]
- 25.Wu XR, Lin JH, Walz T, Haner M, Yu J, Aebi U, Sun TT. J Biol Chem. 1994;269:13716–13724. [PubMed] [Google Scholar]
- 26.Yu J, Lin JH, Wu XR, Sun TT. J Cell Biol. 1994;125:171–82. doi: 10.1083/jcb.125.1.171. [DOI] [PMC free article] [PubMed] [Google Scholar]
- 27.Kachar B, Liang F, Lins U, Ding M, Wu XR, Stoffler D, Aebi U, Sun TT. J Mol Biol. 1999;285:595–608. doi: 10.1006/jmbi.1998.2304. [DOI] [PubMed] [Google Scholar]
- 28.Sun TT, Liang FX, Wu XR. Adv Exp Med Biol. 1999;462:7–18. doi: 10.1007/978-1-4615-4737-2_1. [DOI] [PubMed] [Google Scholar]
- 29.Wu XR, Medina JJ, Sun TT. J Biol Chem. 1995;270:29752–29759. doi: 10.1074/jbc.270.50.29752. [DOI] [PubMed] [Google Scholar]
- 30.Liang F, Kachar B, Ding M, Zhai Z, Wu XR, Sun TT. Differentiation. 1999;65:59–69. doi: 10.1046/j.1432-0436.1999.6510059.x. [DOI] [PubMed] [Google Scholar]
- 31.Laemmli UK. Nature. 1970;227:680–685. doi: 10.1038/227680a0. [DOI] [PubMed] [Google Scholar]
- 32.Shevchenko A, WilmMVorm O, Mann M. Anal Chem. 1996;68:850–858. doi: 10.1021/ac950914h. [DOI] [PubMed] [Google Scholar]


