

Abstract
Individuals with major depressive disorder (MDD) often exhibit impaired executive function, particularly in experimental tasks that involve response conflict and require adaptive behavioral adjustments. Prior research suggests that these deficits might be due to dysfunction within frontocingulate pathways implicated in response conflict monitoring and the recruitment of cognitive control. However, the temporal unfolding of conflict monitoring impairments in MDD remains poorly understood. To address this issue, we recorded 128-channel event-related potentials while 20 unmedicated participants with MDD and 20 demographically matched, healthy controls performed a Stroop task. Compared to healthy controls, MDD subjects showed larger Stroop interference effects and reduced N2 and N450 amplitudes. Source localization analyses at the time of maximal N450 activity revealed that MDD subjects had significantly reduced dorsal anterior cingulate cortex (dACC; Brodmann area 24/32) and left dorsolateral prefrontal cortex (Brodmann area 10/46) activation to incongruent relative to congruent trials. Consistent with the heterogeneous nature of depression, follow-up analyses revealed that depressed participants with the lowest level of conflict-related dACC activation 620 ms post-stimulus were characterized by the largest Stroop interference effects (relatively increased slowing and reduced accuracy for incongruent trials). Conversely, MDD participants with relatively stronger dACC recruitment did not differ from controls in terms of interference effects. These findings suggest that for some, but not all individuals, MDD is associated with impaired performance in trials involving competition among different response options, and reduced recruitment of frontocingulate pathways implicated in conflict monitoring and cognitive control.
Keywords: Depression, Action Monitoring, Anterior Cingulate Cortex, Dorsolateral Prefrontal Cortex, Cognitive Control, Executive Function
1. Introduction
Major depressive disorder (MDD) is characterized by impairments in executive function, particularly in situations requiring behavioral adjustments and adaptive action monitoring (Austin, Mitchell, & Goodwin, 2001; Nitschke & Mackiewicz, 2005; Paradiso, Lamberty, Garvey, & Robinson, 1997; Porter, Gallagher, Thompson, & Young, 2003). For example, MDD has been associated with increased sensitivity to mistakes in performance (e.g., Beats, Sahakian, & Levy, 1996; Holmes & Pizzagalli, 2008; Steffens, Wagner, Levy, Horn, & Krishnan, 2001) and negative feedback (e.g., Elliott, Sahakian, Herrod, Robbins, & Paykel, 1997). These deficits might be related to symptoms of indecisiveness or diminished ability to concentrate, which characterize the clinical presentation of MDD subjects (American Psychiatric Association, 1994).
In addition to hyper-responsiveness to errors and negative feedback, evidence indicates that depressed subjects might display conflict monitoring dysregulation in paradigms generating competition among response options (see Ottowitz, Dougherty, & Savage, 2002 for review). Studies using the Stroop tasks, for example, in which the prepotent tendency to read a word competes with the task demand of naming the color, have described impaired performance in depressed subjects (i.e., increased slowing and reduced accuracy during response conflict; Ottowitz et al., 2002; Lemelin, Baruch, Vincent, Everett, & Vincent, 1997; Moritz et al., 2002; Paradiso et al., 1997; Trichard et al., 1995; but see Austin et al., 1999). Notably, these deficits predicted poor treatment outcome (Sneed et al., 2007), persisted after symptom remission (Trichard et al., 1995), and were seen in individuals with subclinical depressive symptomatology (Holmes & Pizzagalli, 2007), indicating that conflict monitoring dysfunctions are a promising marker of dysfunctional executive function in depression.
This hypothesis is further strengthened by recent neuroimaging findings showing that depressed subjects display abnormal activation within prefrontal cortex (PFC) and anterior cingulate cortex (ACC) during tasks involving conflict monitoring (e.g., George et al., 1997; Mitterschiffthaler et al., 2007; Wagner et al., 2006; for review see Davidson, Pizzagalli, Nitschke, & Putnam, 2002; Nitschke, & Mackiewicz, 2005; Rogers et al., 2004). These findings are intriguing since theories regarding the nature of the action monitoring system have proposed a distributed executive control system, primarily centered on the ACC and PFC (Botvinick, 2007; Gehring & Willoughby, 2002; Holroyd & Coles, 2002). According to these theories, one role of this system is the implementation of the cognitive control necessary to monitor and adjust for the occurrence of response conflict (Carter & van Veen, 2007). In line with this assumption, research indicates that (1) the dorsolateral PFC (DLPFC) is critical for the implementation of top-down attentional control (Vanderhasselt, De Raedt, Baeken, Leyman, & D'haenen, 2006; MacDonald, Cohen, Stenger, & Carter, 2000; Miller & Cohen, 2001); and (2) ACC activity during response conflict predicts DLPFC recruitment and subsequent behavioral adjustments (Kerns et al., 2004). Together, these findings suggest that conflict monitoring impairments in depression might be linked to dysfunctions within frontocingulate pathways. This assumption is further supported by computational modeling of depressed participant's Stroop task performance, which has shown that these deficits can be accounted for by disrupted prefrontal/ACC activity and associated decrease in cognitive control (Siegle, Steinhauer, & Thase, 2004).
While MDD has been linked to reduced conflict monitoring performance and dysregulated frontocingulate activation in tasks probing cognitive control, relatively little is known about the temporal unfolding of brain mechanisms implicated in these dysfunctions, which in turn may offer important insights into the source of executive impairments in depression. Event-related potential (ERP) techniques are ideally suited for investigating this important issue. Specifically, prior studies using the Stroop or related tasks have described two ERP components – N2 and N450 – that appear to be related to conflict monitoring processes. The N450 component, in particular, a negative voltage deflection beginning ∼400 ms following the presentation of an incongruent trial, has been consistently linked to the Stroop interference effect and is assumed to index conflict detection, most likely at the response stage (Hanslmayr et al., 2008; Rebai, Bernard, & Lannou, 1997; West & Alain, 2000b; West, 2003; West, Jakubek, Wymbs, Perry, & Moore, 2005). The N2, a negative frontocentral deflection showing greater amplitudes for incongruent than congruent trials in interference task (e.g., Gehring, Gratton, Coles, & Donchin, 1992; Kopp, Mattler, Goertz, & Rist, 1996), has been also associated with conflict detection, although not as consistently as the N450 component (West, Krompinger, Bowry, & Doll, 2004; West et al., 2005). In agreement with the conflict monitoring theory of ACC functioning (Botvinick, Cohen, & Carter, 2004; Ridderinkhof, Ullsperger, Crone, & Nieuwenhuis, 2004), source localization analyses have identified regions within the ACC as the potential generator of both the N2 (van Veen & Carter, 2002) and N450 (West et al., 2000b). In addition, recent ERP studies have highlighted the role of PFC regions (Markela-Lerenc et al., 2004) and functional coupling between ACC and PFC regions (Hanslmayr et al., 2008) during response conflict.
Based on prior literature we hypothesized that, relative to healthy control subjects, unmedicated participants with MDD would show reduced conflict monitoring abilities, which would be manifested as (1) decreased performance in incongruent (i.e., high-conflict), but not congruent, trials; (2) decreased scalp N2 and N450 amplitudes; and (3) reduced ACC and DLPFC activation following incongruent trials. Because the N450 has been more strongly associated with the Stroop interference effects than the N2 (e.g., West et al., 2005), the primary hypotheses focused on the N450 component. To test these hypotheses, we performed novel analyses on a recently published dataset, in which we previously investigated error processing dysfunction in depression (Holmes & Pizzagalli, 2008). While our prior analyses focused on response-locked ERPs and error processing, the current study considers ERPs time-locked to the Stroop stimuli, giving us the opportunity to investigate conflict monitoring dysfunction in depression, a topic not explored in our prior work.
2. Materials and Methods
2.1. Participants
The participant recruitment, assessment, and clinical characterization of this sample have been previously described in detail (Holmes & Pizzagalli, 2008). Briefly, 45 right-handed participants between the age of 18 and 55 years and with normal or corrected vision were recruited from the Boston area. For MDD subjects, inclusion criteria included: meeting DSM-IV diagnosis for current MDD (American Psychiatric Association, 1994), as established by a Structured Clinical Interview for DSM-IV, Patient Edition (SCID-I/P; First, Spitzer, Gibbon, & Williams, 2002); absence of any other Axis I comorbidity, with the exception of anxiety disorders (simple phobia n = 1); absence of psychotropic medication usage within 2 weeks of the initial session (4 weeks for neuroleptics and benzodiazepines, 6 weeks for fluoxetine, and 6 months for dopaminergic drugs); no evidence of current or past psychotic symptomatology; and no history of electroconvulsive therapy, seizures, and/or head injures resulting in loss of consciousness. Healthy comparison participants were included if they had no current or past psychopathology, neurological disorders, and/or head injures. Five participants were lost due to discovery of exclusionary criteria at the SCID interview (n = 4) or non-compliance (n = 1). The final sample consisted of 20 MDD subjects and 20 healthy controls. MDD and control subjects did not differ with respect to gender [% females: 35% vs. 50%; χ2(1)=0.92, p>0.34], age [30.60±12.16 vs. 28.80±9.87 years; t(18)=0.51, p>0.15], ethnicity [% Caucasian: 80% vs. 70%; χ2(1)=0.53, p>0.46], or education [15.65±1.87 vs. 15.65±1.93 years; t(38)=0.001, p>0.99] As expected the MDD participants reported significantly increased levels of depressive symptoms, as assessed by the Beck Depression Inventory-II score (BDI-II; Beck, Ward, Mendelson, Mock, & Erbaugh, 1961) [22.55±9.23 vs. 2.45±3.31; t(38)=9.17, p<0.005].
After receiving a detailed study description, participants provided written informed consent to a research protocol approved by the Committee on the Use of Human Subjects at Harvard University. Participants were compensated $10/hr for their participation.
2.2. Task and procedure
After study eligibility was assessed, participants were invited for an experimental session that occurred within one week of the clinical interview and involved collection of behavioral and electrophysiological data while participants performed a modified Stroop task. The task involved pseudo-random presentations of three words (RED, GREEN, and BLUE) printed in one of three colors of ink (red, green, and blue). Trials were either congruent (i.e., the word and the color matched) or incongruent. Participants were instructed to use their index, middle, and ring fingers of their right hand to respond through a button press, as quickly and accurately as possible, to each probe's ink color. Trials began with the presentation of a fixation cross (250 ms), followed by a Stroop probe (150 ms) and a jittered inter-trial interval (ITI; 1850-1950 ms).
Before the task participants completed two practice blocks (24 trials each). Reaction times (RT) from the second practice block were used to determine a threshold for late responses (see below). For the actual task, feedback regarding performance was added to reduce potential confounds related to group differences in error awareness. When participants responded correctly within the individually titrated response window (equal to 85% of each participant's mean RT during the second practice block), positive feedback (a schematic smiling face) was presented for 250 ms. Negative feedback (a schematic frowning face) was presented for 250 ms if participants responded outside of the response window and/or made an incorrect response. To account for possible performance changes over time, the response window threshold was recalculated at the middle and end of each block. To reduce the likelihood that physiological activity associated with the previous trial would interfere with the conflict-related ERPs, feedback was presented 1850-1950 ms after the Stroop probe, followed by a 900-1100 ms ITI.
Over the course of the experiment, participants performed six blocks (total duration: 37:48 min), which were separated by a brief rest. To induce more errors, 35.5% of the trials in each block were incongruent (98 congruent and 54 incongruent trials). RT and accuracy measures were collected throughout the task.
2.3. Apparatus
The task was presented with Eprime software (Psychology Software Tools, Inc., Pittsburgh, PA). Participants' responses were recorded through a button box. 128-channel ERPs were recorded using the Geodesic Sensor Net system (Electrical Geodesic, Inc, OR). Impedances were kept below 50 KΩ and a 250-Hz sampling rate (bandwidth: 0.01-100 Hz) was used with the vertex electrode (Cz) as the recording reference.
2.4. Data Reduction
2.4.1. Behavioral data
Only trials in which participants made a response were considered. To reduce the potential effect of outliers, trials with RTs (after ln transformation) beyond individual mean ±3SD for each trial type were excluded (on average, 0.28±0.24%).
The main analyses focused on behavioral adjustments related to the occurrence of response-conflict. To this end, the Stroop and Gratton effects were calculated. The Stroop effect is a measurement of interference elicited by the incongruent trials, relative to congruent. It is calculated as: [RTIncongruent trials − RTCongruent trials] and [AccuracyCongruent trials − AccuracyIncongruent trials] with higher scores indicating increased interference effects and putative impairments in cognitive control. The Gratton effect (Gratton, Coles, & Donchin, 1992) is a measure of post-conflict behavioral adjustments, and is calculated as: [RTIncongruent trials following congruent trials − RTIncongruent trials following incongruent trials] and [AccuracyIncongruent trials following incongruent trials − AccuracyIncongruent trials following congruent trials], with higher scores being indicative of increased cognitive control. As in prior studies (Pizzagalli, Peccoralo, Davidson, & Cohen, 2006), analyses assessing post-conflict adjustments were restricted to trials following correct responses so that post-conflict and post-error adjustment effects are not confounded.
2.4.2. ERP data
Data were analyzed with Brain Vision software (Brain Products GmbH, Gilching, Germany). Artifacts were removed through independent components analysis (Jung et al., 2000). Individual channels with corrupted signal were replaced through spatially weighted linear interpolations. Subsequent semi-automatic artifact detection was performed to identify remaining artifacts (maximal amplitude: ±75 μV; within-segment absolute amplitude difference: 150 μV; gradients: 50 μV). Stimulus-locked ERPs were computed 200 ms prior to and 924 ms following the presentation of a Stroop probe. Mirroring the behavioral data analyses, ERPs were computed only for trials in which participants made a correct response. Data were then band-pass filtered (0-30 Hz, 12 dB/octave), baseline-corrected (−200 ms to −100 ms pre-probe onset), and re-derived to an average reference. Grandmean ERP waveforms were calculated by averaging data across conditions and groups.
Based on prior studies using the Stroop or related tasks, analyses focused on the N2 and, particularly, N450 component, which were empirically defined using a space-oriented bootstrapping segmentation procedure (Koenig & Lehmann, 1996). This procedure was used to define the start and end points of “microstates”, which are periods of stable field configurations assumed to index specific brain functions. This was accomplished by calculating, at each time frame, the Global Map Dissimilarity (GMD) index. GMD is a reference-free, single-value variable that assesses the difference in field configuration between two successive maps (Lehmann & Skrandies, 1984), whose values can vary between 0 (when two successive maps are identical) and 2 (when two maps have identical topography but reversed polarity). The resulting dissimilarity peaks were used to locate the occurrence of a new microstate. For each microstate, Global Field Power (GFP) peaks were then identified. GFP is computed as the average standard deviation within a given surface map (Lehmann & Skrandies, 1984); GFP peaks are hypothesized to represent points of maximal neuronal activity, and thus offer optimal signal-to-noise ratio.
The resulting microstates were confirmed through visual inspection of the surface data. Next, N2 and N450 amplitudes and latencies were extracted from sensors showing maximal deflections (FC1, FCz, FC2, C1, Cz, C2, Cp1, CPz, and Cp2). The N2 and N450 amplitudes were calculated as the average voltage amplitude 136-240 ms (N2) and 340-692 ms (N450), respectively, following a congruent and incongruent trial. This choice was based on prior recommendations suggesting the use of mean amplitudes to characterize ERP waveforms, particularly those showing sustained unfolding (Luck, 2005, pp. 234-235). The MDD and control group did not differ in the number of segments available for the ERP analyses [incongruent: 239.25±40.43 vs. 253.9±29.42, t(38)=1.31, p>0.19; congruent: 467.10±61.28 vs. 467.65±53.82, t(38)=0.52, p>0.60].
2.4.3. LORETA data
In case of significant scalp group differences, Low-Resolution Electromagnetic Tomography (LORETA; Pascual-Marqui, Michel, & Lehmann, 1994; Pascual-Marqui et al., 1999) was used to estimate the three-dimensional intracerebral current density at the times of maximal response-conflict activity (see Pizzagalli, 2007 for a review of the theoretical assumptions, mathematical implementation, and cross-modal validation of the LORETA algorithm against hemodynamic neuroimaging techniques). For each participant and condition, LORETA solutions were computed within the solution space (2,394 voxels with a 7-mm3 resolution) at the times of maximal Global Field Power (GFP; Lehmann & Skrandies, 1984) within the N2 and N450 time windows. Prior to statistical analyses LORETA activity was normalized to a total current density of 1 and log-transformed.
2.5. Statistical Analyses
2.5.1. Behavioral data
Exploratory analyses revealed no significant effects of gender or ethnicity; therefore, these variables were not further considered. For accuracy and RT scores, a separate mixed 2 × 2 analysis of variance (ANOVA) with Group (MDD subjects, controls) as a between-subject factor and Condition (incongruent, congruent) as repeated measure was conducted to investigate Stroop effects. For the Gratton effect, the performance for incongruent trials following a congruent relative to incongruent trial was entered. As stated above, only trials following correct trials were considered.
2.5.2. Scalp ERP data
For the N2, a mixed 2 × 2 × 3 × 3 ANOVA with Group, Condition (incongruent, congruent), Caudality (Fc, C, Cp) and Laterality (left, central, right) as factors was run on mean amplitude (averaged across 136-240 ms post-stimulus). For the N450, an identical ANOVA considering the mean amplitude between 340 and 692 ms was performed.
For both the behavioral and scalp ERP ANOVAs, the Greenhouse-Geisser correction was applied when applicable [adjusted p- and epsilon (ε) values are reported]. Post-hoc Newman-Keuls tests were performed in case of significant ANOVA findings. Effect sizes are reported in the form of partial eta squared (η2) values.
2.5.3. LORETA data
Source localization analyses were conducted to follow-up significant findings from the scalp analyses. Two sets of analyses were performed. In the first set, analyses focused on activation at the time of GFP peaks, which yield optimal signal-to-noise ratio. For each identified GFP peak (N2: 212 ms; N450: 388 and 620 ms), voxelwise 2 × 2 ANOVAs with Group and Condition (incongruent, congruent) were performed on current density values using in-house matlab software. The output was thresholded at p<0.01, uncorrected for multiple comparisons with a minimum cluster size of 5 contiguous voxels. To further avoid Type I errors, only findings involving hypothesized regions (i.e., ACC, DLPFC) were considered. In the second set, LORETA analyses were repeated using extended time windows identical to the ones used for the scalp data.
3. Results
3.1. Behavioral data
3.1.1. Stroop effects
For accuracy, the main effect of Condition was significant [F(1,38)=44.17, p<0.001; partial η2=0.54], due to the expected higher accuracy for congruent (0.93±0.05) relative to incongruent (0.86±0.08) trials. The main effect of Group [F(1,38)=0.81, p>0.37; partial η2=0.02] and the Group × Condition [F(1,38)=2.61, p>0.12; partial η2=0.06] interaction were not significant. Accordingly, MDD (0.89±0.06) and comparison subjects (0.90±0.06) did not differ in their overall accuracy, confirming that a comparable number of data were available for the ERP computation between the groups.
For RT scores, the main effect of Condition was significant [F(1,38)=61.42, p<0.001; partial η2=0.62], due to the expected shorter RT for congruent (467.37±56.48 ms) than incongruent (536.44±102.44 ms) trials. Of primary importance for the current hypotheses, this effect was qualified by a significant Group × Condition interaction [F(1,38)=6.01, p<0.02; partial η2=0.14]. Post-hoc Newman-Keuls tests clarified that this interaction was due to significantly longer RT for MDD relative to control subjects for incongruent (p<0.001), but not congruent (p>0.60), trials (Table 1A). Although both groups showed a significant Stroop effect (incongruent > congruent; ps<0.002), the significant interaction indicates that MDD subjects had significantly larger Stroop effects compared to control subjects [90.67±70.29 ms vs. 47.47±35.69; t(38)=2.45, p<0.03]. The main effect of Group was not significant [F(1,38)=1.33, p>0.25; partial η2=0.03], strengthening the interpretation of selective deficits in MDD participants.
Table 1.
Summary of behavioral, ERP, and LORETA findings for control (n=20) and depressed (n=20) subjects.
| Control Subjects | MDD Subjects | p-value | |
|---|---|---|---|
| A. Behavioral performance | |||
| Accuracy incongruent | 0.88±0.05 | 0.85±0.09 | n.s. |
| Accuracy congruent | 0.93±0.05 | 0.93±0.06 | n.s. |
| Stroop effect accuracy | −0.05±0.029 | −0.08±0.079 | n.s. |
| RT incongruent | 511.61±69.50 | 561.27±124.15 | <0.001 |
| RT congruent | 464.14±47.23 | 470.60±65.54 | n.s. |
| Stroop effect RT | 47.47±35.69 | 90.67±70.29 | <0.02 |
| B. Scalp ERP data | |||
| N2 incongruent | 0.29±0.89 | 1.31±1.76 | <0.001 |
| N2 congruent | 0.46±0.93 | 1.28±1.67 | <0.001 |
| N450 incongruent | 2.38±1.67 | 2.91±2.20 | <0.001 |
| N450 congruent | 2.91±1.60 | 3.13±2.14 | <0.05 |
| C. LORETA data (620 ms) | |||
| dACC incongruent | −3.70±0.17 | −3.76±0.15 | <0.07 |
| dACC congruent | −3.75±0.19 | −3.70±0.10 | n.s. |
| Δ(dACC)* | 0.05±0.11 | −0.06±0.11 | <0.005 |
| Left DLPFC incongruent | −3.31±0.17 | −3.49±0.28 | <0.001 |
| Left DLPFC congruent | −3.36±0.18 | −3.39±0.21 | n.s. |
| Δ(left DLPFC)* | 0.50±0.13 | −0.10±0.18 | <0.005 |
The difference score (incongruent - congruent) was calculated at the time of maximal GFP (620 ms) within the N450 time window peak; n.s. = non-significant
3.1.2. Conflict-adaptation (Gratton) effects
For both RT and accuracy, the main effect of Condition was significant [RT: F(1,38)=22.91, p<0.001; partial η2=0.38; accuracy: F (1,38)=6.10, p<0.02; partial η2=0.14], with participants responding less accurately and more slowly for incongruent trials following congruent trials (RT: 349.35±71.25 ms; accuracy: 0.90±0.05) than incongruent trials following incongruent trials (RT: 331.23±69.43 ms; accuracy: 0.91±0.06). No other effects emerged. Taken together, the behavioral findings indicate that the current paradigm elicited the intended behavioral effects, and highlight RT slowing in MDD subjects specific to high-conflict (incongruent) trials.
3.2. Scalp ERP analyses
3.2.1. N2
Table 1B summarizes all significant effects emerging from the Group × Condition × Laterality × Caudality ANOVA considering averaged N2 amplitudes. For the sake of brevity, only effects involving Group and Condition will be presented in detail (other findings are available upon request). Briefly, the main effect of Group [F(1,38)=4.88, p<0.035; partial η2=0.114] was significant, due to overall more negative N2 amplitudes for control (−0.05±0.40 μV) than MDD (0.86±0.46 μV) subjects. This effect was qualified by significant Group × Condition × Laterality [F(2,76)=3.70, p<0.038; partial η2=0.089] and Group × Laterality × Caudality [F(4,152)=2.81, p<0.045; partial η2=0.069] interactions. Lower-order ANOVAs were performed to clarify these effects.
For the Group × Condition × Laterality interaction, follow-up Group × Condition ANOVAs revealed that the main effect of Group was significant for left, central, and right sensors (all ps<0.05), whereas the Group × Condition interaction emerged only for the right hemisphere [F(1,38)=4.77, p<0.035; partial η2=0.112]. Post-hoc Newman-Keuls tests revealed that this interaction was due to more negative N2 to incongruent than congruent stimuli for control (p<0.013) but not MDD (p>0.63) subjects (Table 1B). Moreover, for either stimulus, controls had significantly larger N2 than MDD subjects (ps<0.0002; Fig. 1A). For the Group × Laterality × Caudality interaction, separate Group × Caudality ANOVAs performed on N2 value for each laterality level revealed no effects involving Group or Condition.
Fig. 1.

Stimulus-locked grandmean waveforms for congruent and incongruent probes. In (A) the waveforms were averaged across electrodes FC2, C2, Cp2 to reflect the N2 ANOVA findings. In (B) waveforms were averaged across FC1, FCz, FC2, C1, Cz, C2, Cp1, CPz, and Cp2 to reflect the N450 ANOVA findings.
3.2.2. N450
Table 2B lists all significant effects emerging from the Group × Condition × Laterality × Caudality ANOVA on the N450 amplitudes. As above, only effects involving Group and Condition are reported. Findings of interest include a main effect of Condition [F(1,38)=25.60, p<0.001; partial η2=0.403] due to more negative N450 amplitude for incongruent (2.64±1.41 μV) than congruent (3.02±1.38 μV) trials, a significant Group × Condition interaction [F(1,38)=4.13, p<0.05; partial η2=0.098], and a significant Group × Laterality × Caudality interaction [F(4,152)=3.29, p<0.021; partial η2=0.080].
Table 2.
Summary of ANOVA findings for the (A) N2 and the (B) N450 component.
| A. N2 | ||||
|---|---|---|---|---|
| Contrast* | F | df | p-value | partial η2 |
| Grp | 4.881 | 1,38 | 0.033 | 0.114 |
| Cond | 3.826 | 1,38 | 0.058 | 0.091 |
| Lat | 23.170 | 2,76 | 0.001 | 0.379 |
| Grp × Lat × Cond | 3.702 | 2,76 | 0.038 | 0.089 |
| Grp × Lat × Caud | 2.810 | 4,152 | 0.043 | 0.069 |
| B. N450 | ||||
| Contrast | F | df | p-value | partial η2 |
| Cond | 25.601 | 1,38 | 0.001 | 0.403 |
| Lat | 25.601 | 1,38 | 0.001 | 0.403 |
| Caud | 19.89 | 2,76 | 0.001 | 0.344 |
| Grp × Cond | 4.131 | 1,38 | 0.05 | 0.098 |
| Con × Lat | 3.494 | 2,76 | 0.04 | 0.084 |
| Lat × Caud | 4.127 | 4,152 | 0.007 | 0.098 |
| Grp × Lat × Caud | 3.292 | 4,152 | 0.013 | 0.080 |
Grp = Group, Caud = Caudality, Lat = Laterality, Cond = Condition.
For the Group × Condition interaction, post-hoc tests revealed that, consistent with the N2 findings, MDD subjects failed to show differentiation between conditions (p>0.09), whereas controls showed more negative N450 waveforms for incongruent than congruent trials (p<0.001). Moreover, for both congruent (p<0.045) and incongruent (p<0.001) trials, control subjects had significantly more negative N450 than MDD subjects (Table 1B), an effect that was particularly evident for the incongruent condition (Fig. 1B).
For the Group × Laterality × Caudality interaction, lower-order Group × Laterality ANOVAs were performed for each level of Caudality level separately. However, no further significant effects involving Group emerged.
A closer evaluation of the ERP waveforms reveals that two peaks were present within the N450 microstates (Fig. 1B). Based on this observation, scalp analyses were repeated within an “early” and “late” N450 window. The early window (340-436 ms) was anchored (± 48 ms) around the first GFP peak (388 ms), whereas the late window encompassed the remaining time period (436-692 ms). For the earlier N450 peak, no effects involving Group emerged (all Fs<1.76, allps>0.18). For the later N450 peak, the Group × Condition interaction was replicated [F(1,38)=4.19, p<0.048].
3.3. LORETA data
3.3.1. N2
No effects involving Group emerged from a priori regions when performing voxel-by-voxel Group × Condition ANOVA on current density computed at the time of the maximal N2 GFP peaks (212 ms). Similarly, no significant effects emerged when considering the extended N2 time window used for the surface scalp analyses (136-240 ms).
3.3.2. N450
As above, no effects involving Group emerged from a priori regions when considering the early N450 GFP peak (388 ms). However, consistent with our hypothesis, the analysis for the later GFP peak (620 ms) revealed a significant Group × Condition effect within the dACC [BA24/32; 10 voxels; F(1,38)=9.54, p<0.004; partial η2=0.20; Fig. 2A], indicating that the two groups differed significantly in their activation to incongruent relative to congruent trials. Post-hoc testing confirmed that the MDD and control groups showed opposite patterns of dACC activation. As shown in Fig. 2A, controls showed a trend for higher current density for incongruent than congruent trials (p<0.06), whereas MDD subjects showed a trend in the opposite direction (p<0.09). Moreover, compared to controls, MDD subjects displayed decreased dACC current density for incongruent (p<0.07), but not congruent (p>0.11) trials (Table 1C).
Fig. 2.
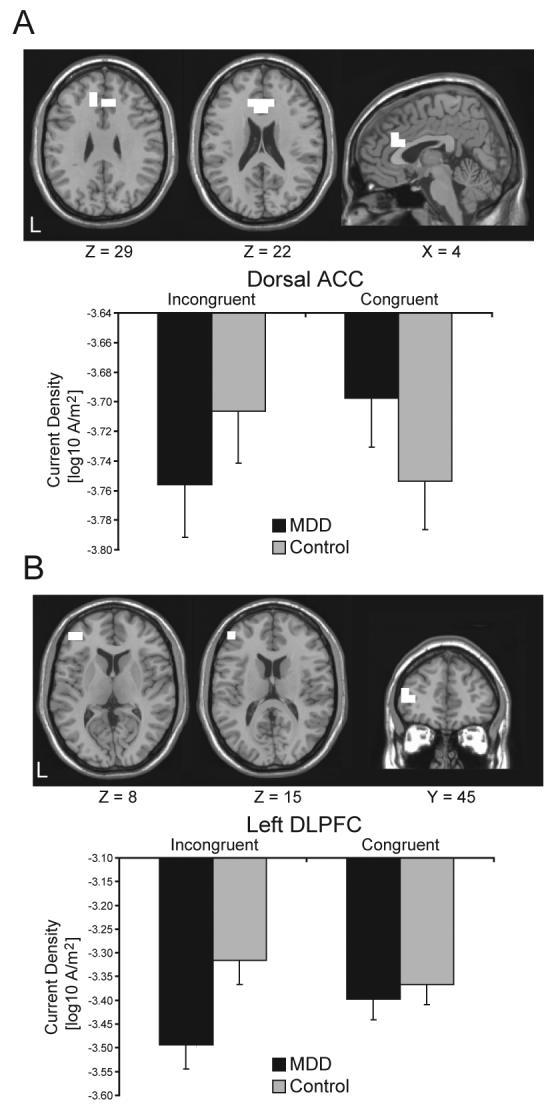
(A) dACC cluster [BA24/32; 10 voxels; peak voxel MNI coordinates: x=−10, y=31, z=29; F(1,38)=9.54, p<0.004; partial η2=0.20], and (B) left DLPFC cluster [BA10/46; 3 voxels; peak voxel MNI coordinates: x=−45, y=45, z=15; F(1,38)=8.79, p<0.0006; partial η2=0.18] emerging from the Group × Condition interaction 620 ms following the presentation of the Stroop Probe. Mean (and SE) current density within the ROI is shown for the MDD (n=20) and control (n=20) participants.
The only other finding emerging was a highly significant Group × Condition interaction in a left DLPFC cluster [BA10/46; F(1,38)=8.79, p<0.006; partial η2=0.18; Fig. 2B], which however included only 3 voxels, and thus missed the cluster threshold. While this finding should be interpreted tentatively due to the limited cluster size, this region-of-interest (ROI) was explored further in light of a priori hypotheses concerning DLPFC dysfunction in depression. Post-hoc tests revealed that this effect was due to significantly lower current density in response to incongruent trials for MDD compared to control subjects (p<0.001; Fig. 2B). Moreover, unlike controls, MDD subjects showed an unexpected pattern of significantly increased current density for the congruent than incongruent trials (p<0.009). To test the specificity of these findings in terms of laterality, we extracted current density from the homologous right DLPFC region, and performed a Group × Condition × Hemisphere ANOVA. This omnibus ANOVA confirmed a significant Group × Condition interaction [F(1,38)=11.78, p<0.001], which was driven by a left hemispheric current density reduction in the MDD group for incongruent trials. Although no significant effects involving Group emerged when considering the right DLPFC cluster (all Fs<2.59, all ps>0.12), it is important to emphasize that the Group × Condition × Hemisphere was not significant [F(1,38)=0.93, p>0.34], indicating that the DLPFC findings were not specific to the left hemisphere.
Finally, to ensure that the N450 LORETA findings were not confounded by potential group differences in N450 latency and to maximize comparability between the scalp and LORETA analyses, control analyses were performed using the time frame utilized in the scalp analyses. Mirroring null findings for the early GFP peak, no significant clusters emerged for the early N450 window period (340-432 ms). When considering the late N450 window (436-692 ms), however, the Condition × Group effect was confirmed for both the dorsal ACC [F(1,38)=6.49, p<0.015; partial η2=0.15] and DLPFC [F(1,38)=9.91, p<0.003; partial η2=0.21].
3.4. Correlation between behavioral and LORETA data
For controls, dACC current density to incongruent stimuli correlated with incongruent accuracy (Pearson r=0.619, p<0.004; Fig. 3A), suggesting that stronger dACC recruitment was associated with better performance on high-conflict trials. For the MDD group, this correlation was not significant (Pearson r=0.239, p>0.31; Fig. 3B), although a Fisher test revealed that correlations between groups were not significantly different (z=1.40; p>0.05). No correlations emerged when considering the left DLPFC cluster for either group.
Fig. 3.
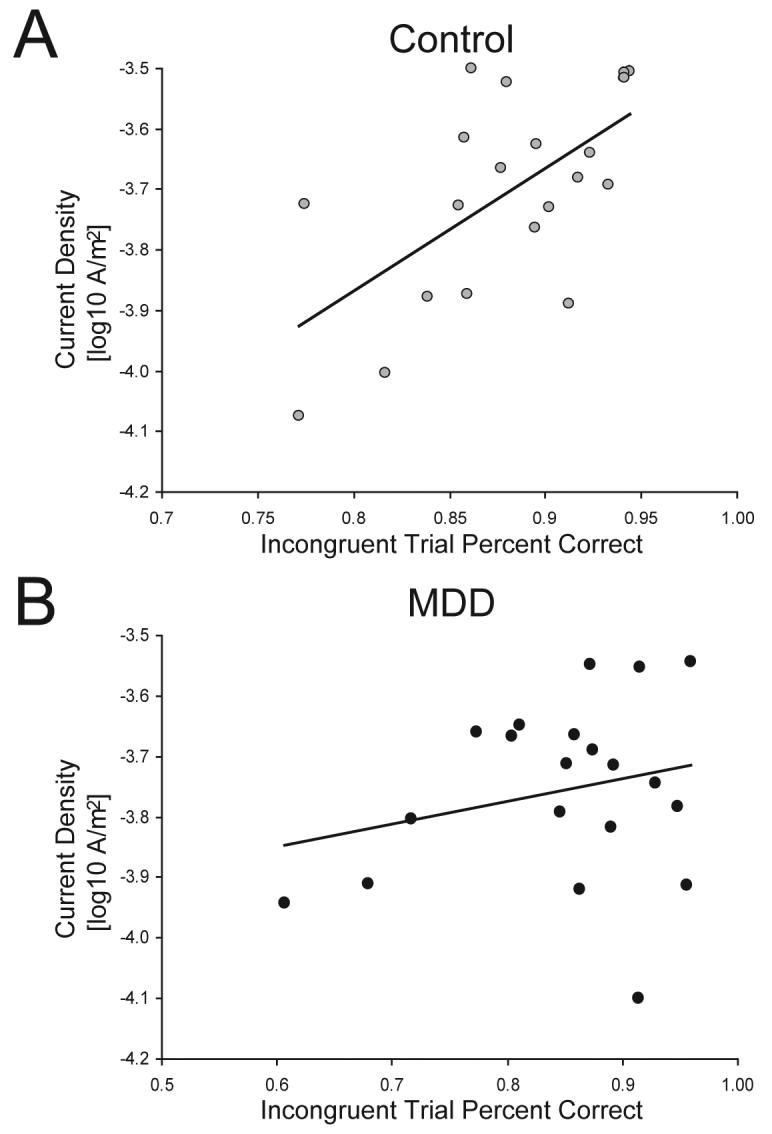
Scatter plot between the current density (averaged across voxels) within the dACC cluster 620 ms following the presentation of an incongruent probe and incongruent trial accuracy for the (A) control subjects (r=0.619, p<0.004) and (B) MDD subjects (r=0.239, p>0.31).
3.5. Behavioral performance as a function of dACC activation
Based on the current ERP and prior fMRI findings indicating that ACC activation during high-conflict trials is associated with adaptive behavioral adjustments (Kerns et al., 2004), we reasoned that participants with MDD showing the strongest dACC activation 620 ms post-conflict would display the smallest conflict monitoring deficit. To test this hypothesis, difference scores were calculated for the dACC ROI emerging from the N450 GFP peak (incongruent - congruent). A median-split procedure was then applied to identify control and MDD participants who displayed the highest and lowest dACC activation (MDD low: −0.14±0.07; MDD high: 0.03±0.05; Control low: −0.05±0.05; Control high: 0.14±0.06). Next, independent sample t-tests were conducted to compare the Stroop interference effects [RT: (RTIncongruent trials – RTCongruent trials); Accuracy: (AccuracyCongruent trials – AccuracyIncongruent trials)] between these sub-groups (see Fig. 4 and Table 2).
Fig. 4.
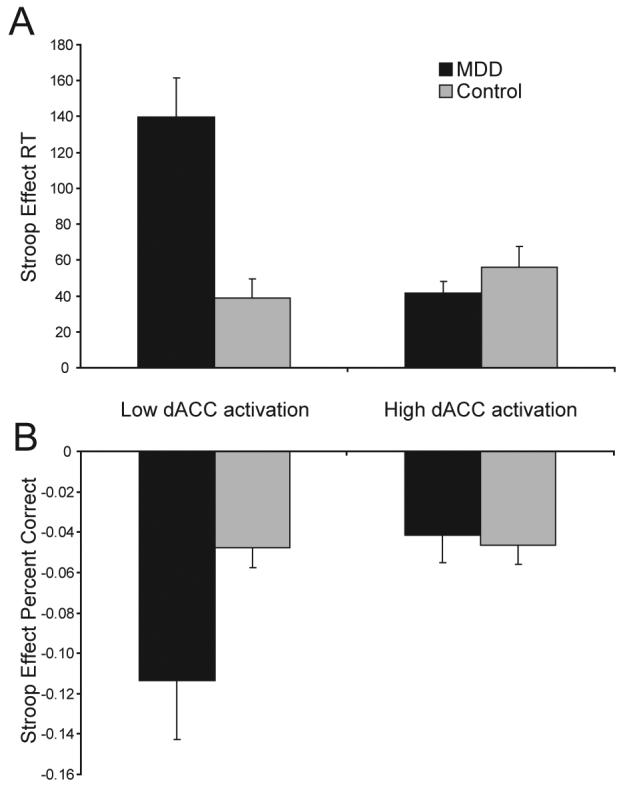
Mean (and SE) Stroop Effect scores for MDD and control sub-groups with low dACC vs. high dACC activation. (A) RT interference effects (RTIncongruent trials – RTCongruent trials); and (B) Accuracy interference effects (AccuracyCongruent trials – AccuracyIncongruent trials).
For RT, MDD subjects with the lowest dACC activation displayed a significantly higher Stroop interference relative to MDD subjects with high dACC activation [t(18)=4.38, p<0.001; Fig. 4A]. These low dACC MDD participants also showed significantly higher interference effect compared to both control sub-groups [low dACC: t(18)=4.21, p<0.003; high dACC: t(18)=3.44, p<0.003; Fig. 4A], which did not differ from each other [t(18)=1.09, p>0.29]. Interestingly, MDD subjects showing the highest dACC activation 620 ms post-conflict did not differ from either the high [t(18)=1.08, p>0.30] or low [t(18)=0.21, p>0.84] dACC control sub-groups.
Similar findings emerged when accuracy was considered. MDD subjects with low dACC activation displayed a significantly higher Stroop effect relative to the MDD subjects with high dACC activation [t(18)=2.24, p<0.04; Fig. 4B], as well as both control sub-groups [low dACC: t(18)=2.14; high dACC: t(18)=2.19, ps<0.05; Fig. 4B). As above, MDD subjects with high dACC activation did not differ from either the high [t(18)=0.31, p>0.76] or low [t(18)=0.38, p>0.71] dACC control sub-group. Finally, no differences emerged between the high and low dACC control sub-groups [t(18)=0.09, p>0.93]. Importantly, these effects were not due to differences in depression severity, since the high and low dACC MDD groups did not differ in their BDI scores [21.30±7.50 vs. 23.80±3.31; t(18)=0.60, p>0.56].
4. Discussion
The goal of the present study was to examine behavioral and electrophysiological correlates of response conflict deficit in unmedicated subjects with major depression. The following findings emerged. First, depressed subjects were characterized by significantly increased RT interference effects. Additional analyses clarified that this impairment was due to RT slowing specific to incongruent trials, and emerged in the context of no group differences in accuracy. Thus, depressed subjects had slowed performance exclusively in high-conflict trials featuring the presence of competing response tendencies. The present behavioral findings join prior observations highlighting increased interference effects in MDD for both emotional (Mitterschiffthaler et al., 2007) and non-emotional (Ottowitz et al., 2002) Stroop tasks.
Second, unlike controls, MDD subjects failed to show larger negative deflections for incongruent than congruent trials at both early (N2) and later (N450) stages of the information processing flow. In fact, patients showed no differentiation between incongruent and congruent trials, and were characterized by significantly reduced N2 and N450 amplitudes, relative to controls, suggesting that response conflict in depression might be impaired at both the stimulus processing (N2) and response stages (N450).1 These findings are intriguing, particularly since prior ERP studies have shown that the N2 and N450 are attenuated in populations where the ability to inhibit competing word information on incongruent trials is compromised (West & Alain, 2000a; McNeely, West, Christensen, & Alain, 2003; Mayes, Molfese, Key, & Hunter, 2005). Moreover, since in healthy controls the amplitude of the N450 varies as a function of task difficulty (West et al., 2000b), the present data might reflect a failure on the part of the MDD group to adequately recruit the cognitive control necessary to account for changing task contingencies.
Third, consistent with current conceptualizations of executive control system implicated in the detection of and adjustments to response conflict (Carter et al., 2007), and in line with previous fMRI and ERP research (e.g., Hanslmayr et al., 2008; Kerns et al., 2004; Liotti, Woldorff, Perez, & Mayberg, 2000), source localization analyses indicated that MDD subjects had reduced activation within dACC and left DLPFC regions 620 ms after stimulus presentation. Follow-up analyses suggested that this relative difference was driven by reduced activation for MDD subjects in response to incongruent trials. Reduced recruitment of dACC and left DLPFC regions 620 ms after presentation of a Stroop stimulus is interesting, particularly in light of recent findings of increased functional coupling between the ACC and left PFC ∼600 ms following the presentation of incongruent Stroop stimuli in healthy controls (Hanslmayr et al., 2008). In the present study, stronger dorsal ACC recruitment 620 ms after presentation of incongruent trials correlated with better performance in control subjects, a pattern that was absent in patients (correlations for control and MDD subjects were, however, not significantly different). Because the mean RT for control subjects was 487.87 ms, it is likely that dACC activation at the N450 time point reflected sustained recruitment needed to successfully respond during high-conflict-trials.
Finally, MDD subjects showing the lowest level of relative dACC activation to incongruent trials were characterized by the largest Stroop interference effects (relatively increased slowing and decreased accuracy for incongruent trials). Notably, MDD subjects with relatively stronger dACC recruitment did not differ from controls in terms of their interference effects.2 These findings are interesting, particularly since the two MDD subgroups had very similar depression severity (BDI) scores (high dACC: 21.30±7.50; low dACC: 23.80±3.31), and did not differ on any other self-report, clinical (e.g., number of prior episodes, duration of current episode), or demographic measure. Altogether, these data support the hypothesis that major depression is characterized by reduced response conflict abilities, likely coupled with impaired recruitment of cognitive control, and dysfunction within frontocingulate pathways implicated in action monitoring and executive functioning. Moreover, initial evidence indicates that response conflict dysfunctions might be restricted to a sub-group of MDD subjects showing the most pronounced response conflict related dACC blunting. Although the present data highlight the heterogeneous nature of MDD, further research will be necessary to examine what aspects of depressive symptomatology might differentiate these subgroups.
While the findings emerging from the current analyses are consistent with prior neuroimaging studies that have described decreased dACC and left DLPFC activation during various executive tasks in depressed subjects (Elliott et al., 1997; Okada et al., 2003; George et al., 1997; for review see Davidson et al., 2002), it is important to emphasize that depression has been associated with both frontocingulate hypo- as well as hyperactivity during executive tasks. A closer look at prior findings reveals, however, that the direction of frontocingulate dysfunction might be related to task performance. Specifically, studies reporting higher activation in the left DLPFC (Harvey et al., 2005; Matsuo et al., 2007; Wagner et al., 2006; Walter, Wolf, Spitzer, & Vasic, 2007) and dACC (Harvey et al., 2005; Mitterschiffthaler et al., 2007; Rose, Simonotto, & Ebmeier, 2006; Wagner et al., 2006) in depression did not find any group differences in behavioral performance. Accordingly, it is possible that greater recruitment of frontocingulate regions is required to achieve behavioral performance equivalent to control subjects (Killgore, Gruber, & Yurgelun-Todd, 2007; Wagner et al., 2006). Conversely, decreased frontocingulate activation has emerged in studies, in which depressed subjects showed impaired performance (the present study; Audenaert et al., 2002; Elliott et al., 1997; Okada, Okamoto, Morinobu, Yamawaki, & Yokota, 2003; but see Harvey et al., 2005; Hugdahl et al., 2004).
While these data provide evidence for a dysregulated conflict monitoring system in MDD, several limitations should be noted. First, although groups differed in their Stroop effects, no differences emerged when considering the Gratton effects. One explanation for this null finding is that the presentation of task-relevant feedback interfered with the temporally sensitive nature of this effect. Second, due to the small size of the present sample and the fact that all patients were unmedicated, we were unable to address the potential effect of depression subtypes and/or psychotropic medication usage on the action monitoring. Since there have been inconsistent findings of action monitoring deficits in MDD, possibly due to the diagnostic heterogeneity and/or pharmacological treatment effects (Markela-Lerenc, Kaiser, Fiedler, Weisbrod, & Mundt, 2006), further studies in this area will be necessary. Finally, it is important to emphasize that while the DLPFC finding was consistent with the hypotheses, the resulting region was smaller than the minimum cluster threshold and a formal laterality test revealed that DLPFC dysfunctions in MDD were not specific to the left hemisphere. Thus, caution should be exerted in interpreting these findings and replications in future studies are warranted.
In spite of these limitations, the present behavioral and electrophysiological findings confirm that depression is characterized by executive dysfunction and dysregulation within frontocingulate pathways critically implicated in conflict monitoring and cognitive control. Of note, prior analyses of this dataset revealed hyperactivation in rostral ACC regions to errors in depressed subjects (Holmes & Pizzagalli, 2008), emphasizing the presence of a multi-faceted dysfunction of action monitoring system in depression, as well as dissociable roles for the rostral and dorsal subdivisions of the cingulate (Bush, Luu, & Posner, 2000). Understanding relations among clinical phenomenology, executive function, and functional/structural integrity of frontocingulate pathways should remain an important goal of future studies.
Table 3.
Summary of unpaired t-tests assessing behavioral performance in subjects with relatively low vs. high dACC activation 620 ms post-conflict. For the dACC cluster, a difference score was calculated (incongruent - congruent). Stroop effects were calculated as: (RTIncongruent trials – RTCongruent trials) and (AccuracyCongruent trials – AccuracyIncongruent trials).
| Stroop Effect RT |
Stroop Effect Accuracy |
|
|---|---|---|
| MDD subjects | ||
| Low ACC (n = 10) | 139.86±67.73a,b,c | −0.11±0.09d,e,f |
| High ACC (n = 10) | 41.49±21.65a | −0.04±0.04d |
| Control subjects | ||
| Low ACC (n = 10) | 38.86±34.19b | −0.05±0.03e |
| High ACC (n = 10) | 56.09±36.81c | −0.05±0.03f |
Sub-groups differ at:
p<0.001
p<0.003
p<0.003
p<0.04
p<0.05
p<0.05
Acknowledgments
Supported by a Sackler Scholar in Psychobiology Research Grant, a National Institute of Health Training Grant 1 F31MH078346 (AJH), and NIMH Research Grant R01MH68376 (DAP). The authors wish to thank Trinity Urban, Daniel G. Dillon, Diane L. Santesso, Ryan Bogdan, and Christen M. Deveney for their contributions and assistance with various aspects of this research.
Footnotes
Publisher's Disclaimer: This is a PDF file of an unedited manuscript that has been accepted for publication. As a service to our customers we are providing this early version of the manuscript. The manuscript will undergo copyediting, typesetting, and review of the resulting proof before it is published in its final citable form. Please note that during the production process errors may be discovered which could affect the content, and all legal disclaimers that apply to the journal pertain.
Previous presentation
The data in this paper were presented in preliminary form at the 47th annual meeting of the Society for Psychophysiological Research, Savannah GA, October 17-21 2007.
In light of the paucity of ERP studies investigating conflict monitoring in MDD, scalp analyses focused on the ERP components that have been most consistently implicated in conflict monitoring – N2 and N450. To test whether group differences were indeed relatively specific to these components, exploratory analyses based on a topographic analysis of variance (TANOVA) approach were conducted. The TANOVA method is a randomization procedure that can be used to test for group differences in scalp topography (Pascual-Marqui, Michel, & Lehmann, 1995; see also Hubl et al., 2007). At each of 5,000 permutations, two randomly selected groups of 20 subjects were compared in their ERP difference waveform (incongruent – congruent) under the null hypothesis of no group topographic differences. For each time frame, the TANOVA code calculated an exact probability of finding group differences in scalp configuration. Findings from this analysis revealed that the first group difference emerged in proximity of the N2 microstate (72 ms), but not earlier. Conversely, analyses confirmed group differences within the N2, early N450, and late N450 windows. Interestingly, no single time frame between the N2 and N450 (i.e., 240-340 ms) showed significant group differences, highlighting further specificity with respect to the main ERP components of interest.
Surprisingly, no performance differences emerged between controls with relatively low vs. high dACC recruitment. In light of recent findings highlighting the role of functional connectivity within frontocingulate pathways in adaptive behavioral adjustments (Holmes and Pizzagalli, 2008; Kerns et al., 2004), future studies might benefit from evaluating interactions within a network of interconnected regions implicated in executive control.
Reference List
- American Psychiatric Association . Diagnostic and Statistical Manual of Mental Disorders. 4th Ed. (4 ed.) American Psychiatric Press; Washington, D.C.: 1994. [Google Scholar]
- Audenaert K, Goethals I, Van Laere K, Lahorte P, Brans B, Versijpt J, et al. SPECT neuropsychological activation procedure with the Verbal Fluency Test in attempted suicide patients. Nuclear Medicine Communications. 2002;23:907–916. doi: 10.1097/00006231-200209000-00015. [DOI] [PubMed] [Google Scholar]
- Austin MP, Mitchell P, Goodwin GM. Cognitive deficits in depression: possible implications for functional neuropathology. British Journal of Psychiatry. 2001;178:200–206. doi: 10.1192/bjp.178.3.200. [DOI] [PubMed] [Google Scholar]
- Austin MP, Mitchell P, Wilhelm K, Parker G, Hickie I, Brodaty H, et al. Cognitive function in depression: a distinct pattern of frontal impairment in melancholia? Psychological Medicine. 1999;29:73–85. doi: 10.1017/s0033291798007788. [DOI] [PubMed] [Google Scholar]
- Beats BC, Sahakian BJ, Levy R. Cognitive performance in tests sensitive to frontal lobe dysfunction in the elderly depressed. Psychological Medicine. 1996;26:591–603. doi: 10.1017/s0033291700035662. [DOI] [PubMed] [Google Scholar]
- Beck AT, Ward CH, Mendelson M, Mock J, Erbaugh J. An inventory for measuring depression. Archives of General Psychiatry. 1961;4:53–63. doi: 10.1001/archpsyc.1961.01710120031004. [DOI] [PubMed] [Google Scholar]
- Botvinick MM. Conflict monitoring and decision making: reconciling two perspectives on anterior cingulate function. Cognitive, Affective, and Behavioral Neuroscience. 2007;7:356–366. doi: 10.3758/cabn.7.4.356. [DOI] [PubMed] [Google Scholar]
- Botvinick MM, Cohen JD, Carter CS. Conflict monitoring and anterior cingulate cortex: an update. Trends in Cognitive Sciences. 2004;8:539–546. doi: 10.1016/j.tics.2004.10.003. [DOI] [PubMed] [Google Scholar]
- Bush G, Luu P, Posner MI. Cognitive and emotional influences in anterior cingulate cortex. Trends in Cognitive Sciences. 2000;4:215–222. doi: 10.1016/s1364-6613(00)01483-2. [DOI] [PubMed] [Google Scholar]
- Carter CS, van Veen V. Anterior cingulate cortex and conflict detection: an update of theory and data. Cognitive, Affective, and Behavioral Neuroscience. 2007;7:367–379. doi: 10.3758/cabn.7.4.367. [DOI] [PubMed] [Google Scholar]
- Davidson RJ, Pizzagalli D, Nitschke JB, Putnam K. Depression: perspectives from affective neuroscience. Annual Review of Psychology. 2002;53:545–574. doi: 10.1146/annurev.psych.53.100901.135148. [DOI] [PubMed] [Google Scholar]
- Elliott R, Baker SC, Rogers RD, O'Leary DA, Paykel ES, Frith CD, et al. Prefrontal dysfunction in depressed patients performing a complex planning task: a study using positron emission tomography. Psychological Medicine. 1997;27:931–942. doi: 10.1017/s0033291797005187. [DOI] [PubMed] [Google Scholar]
- Elliott R, Sahakian BJ, Herrod JJ, Robbins TW, Paykel ES. Abnormal response to negative feedback in unipolar depression: evidence for a diagnosis specific impairment. Journal of Neurology, Neurosurgery and Psychiatry. 1997;63:74–82. doi: 10.1136/jnnp.63.1.74. [DOI] [PMC free article] [PubMed] [Google Scholar]
- First MB, Spitzer RL, Gibbon M, Williams J. Structured Clinical Interview for DSM-IV-TR Axis I Disorders -Patient Edition (SCID-I/P, 11/2002 revision) Biometrics Research, New York State Psychiatric Institute; New York: 2002. [Google Scholar]
- Gehring WJ, Gratton G, Coles MG, Donchin E. Probability effects on stimulus evaluation and response processes. Journal of Experimental Psychology: Human Perception and Performance. 1992;18:198–216. doi: 10.1037/0096-1523.18.1.198. [DOI] [PubMed] [Google Scholar]
- Gehring WJ, Willoughby AR. The medial frontal cortex and the rapid processing of monetary gains and losses. Science. 2002;295:2279–2282. doi: 10.1126/science.1066893. [DOI] [PubMed] [Google Scholar]
- George MS, Ketter TA, Parekh PI, Rosinsky N, Ring HA, Pazzaglia PJ, et al. Blunted left cingulate activation in mood disorder subjects during a response interference task (the Stroop) Journal of Neuropsychiatry and Clinical Neurosciences. 1997;9:55–63. doi: 10.1176/jnp.9.1.55. [DOI] [PubMed] [Google Scholar]
- Gratton G, Coles MG, Donchin E. Optimizing the use of information: strategic control of activation of responses. Journal of Experimental Psychology: General. 1992;121:480–506. doi: 10.1037//0096-3445.121.4.480. [DOI] [PubMed] [Google Scholar]
- Hanslmayr S, Pastotter B, Bauml KH, Gruber S, Wimber M, Klimesch W. The electrophysiological dynamics of interference during the Stroop task. Journal of Cognitive Neuroscience. 2008;20:215–225. doi: 10.1162/jocn.2008.20020. [DOI] [PubMed] [Google Scholar]
- Harvey PO, Fossati P, Pochon JB, Levy R, Lebastard G, Lehericy S, et al. Cognitive control and brain resources in major depression: an fMRI study using the n-back task. Neuroimage. 2005;26:860–869. doi: 10.1016/j.neuroimage.2005.02.048. [DOI] [PubMed] [Google Scholar]
- Holmes AJ, Pizzagalli DA. Task feedback effects on conflict monitoring and executive control: relationship to subclinical measures of depression. Emotion. 2007;7:68–76. doi: 10.1037/1528-3542.7.1.68. [DOI] [PMC free article] [PubMed] [Google Scholar]
- Holmes AJ, Pizzagalli DA. Spatiotemporal Dynamics of Error Processing Dysfunctions in Major Depressive Disorder. Archives of General Psychiatry. 2008;65:179–188. doi: 10.1001/archgenpsychiatry.2007.19. [DOI] [PMC free article] [PubMed] [Google Scholar]
- Holroyd CB, Coles MG. The neural basis of human error processing: reinforcement learning, dopamine, and the error-related negativity. Psychological Review. 2002;109:679–709. doi: 10.1037/0033-295X.109.4.679. [DOI] [PubMed] [Google Scholar]
- Hubl D, Koenig T, Strik WK, Garcia LM, Dierks T. Competition for neuronal resources: How hallucinations make themselves heard. British Journal of Psychiatry. 2007;190:57–62. doi: 10.1192/bjp.bp.106.022954. [DOI] [PubMed] [Google Scholar]
- Hugdahl K, Rund BR, Lund A, Asbjornsen A, Egeland J, Ersland L, et al. Brain activation measured with fMRI during a mental arithmetic task in schizophrenia and major depression. American Journal of Psychiatry. 2004;161:286–293. doi: 10.1176/appi.ajp.161.2.286. [DOI] [PubMed] [Google Scholar]
- Jung TP, Makeig S, Westerfield M, Townsend J, Courchesne E, Sejnowski TJ. Removal of eye activity artifacts from visual event-related potentials in normal and clinical subjects. Clinical Neurophysiology. 2000;111:1745–1758. doi: 10.1016/s1388-2457(00)00386-2. [DOI] [PubMed] [Google Scholar]
- Kerns JG, Cohen JD, MacDonald AW, III, Cho RY, Stenger VA, Carter CS. Anterior cingulate conflict monitoring and adjustments in control. Science. 2004;303:1023–1026. doi: 10.1126/science.1089910. [DOI] [PubMed] [Google Scholar]
- Killgore WD, Gruber SA, Yurgelun-Todd DA. Depressed mood and lateralized prefrontal activity during a Stroop task in adolescent children. Neuroscience Letters. 2007;416:43–48. doi: 10.1016/j.neulet.2007.01.081. [DOI] [PMC free article] [PubMed] [Google Scholar]
- Koenig T, Lehmann D. Microstates in language-related brain potential maps show noun-verb differences. Brain and Language. 1996;53:169–182. doi: 10.1006/brln.1996.0043. [DOI] [PubMed] [Google Scholar]
- Kopp B, Mattler U, Goertz R, Rist F. N2, P3 and the lateralized readiness potential in a nogo task involving selective response priming. Electroencephalography and Clinical Neurophysiology. 1996;99:19–27. doi: 10.1016/0921-884x(96)95617-9. [DOI] [PubMed] [Google Scholar]
- Lehmann D, Skrandies W. Spatial analysis of evoked potentials in man--a review. Progress in Neurobiology. 1984;23:227–250. doi: 10.1016/0301-0082(84)90003-0. [DOI] [PubMed] [Google Scholar]
- Lemelin S, Baruch P, Vincent A, Everett J, Vincent P. Distractibility and processing resource deficit in major depression. Evidence for two deficient attentional processing models. Journal of Nervous and Mental Disorders. 1997;185:542–548. doi: 10.1097/00005053-199709000-00002. [DOI] [PubMed] [Google Scholar]
- Liotti M, Woldorff MG, Perez R, Mayberg HS. An ERP study of the temporal course of the Stroop color-word interference effect. Neuropsychologia. 2000;38:701–711. doi: 10.1016/s0028-3932(99)00106-2. [DOI] [PubMed] [Google Scholar]
- Luck SJ. An Introduction to the Event-Related Potential Technique. The MIT Press; Cambridge, Massachusetts: 2005. [Google Scholar]
- MacDonald AW, III, Cohen JD, Stenger VA, Carter CS. Dissociating the role of the dorsolateral prefrontal and anterior cingulate cortex in cognitive control. Science. 2000;288:1835–1838. doi: 10.1126/science.288.5472.1835. [DOI] [PubMed] [Google Scholar]
- Markela-Lerenc J, Ille N, Kaiser S, Fiedler P, Mundt C, Weisbrod M. Prefrontal-cingulate activation during executive control: which comes first? Brain Research Cognitive Brain Research. 2004;18:278–287. doi: 10.1016/j.cogbrainres.2003.10.013. [DOI] [PubMed] [Google Scholar]
- Markela-Lerenc J, Kaiser S, Fiedler P, Weisbrod M, Mundt C. Stroop performance in depressive patients: a preliminary report. Journal of Affective Disorders. 2006;94:261–267. doi: 10.1016/j.jad.2006.04.011. [DOI] [PubMed] [Google Scholar]
- Matsuo K, Glahn DC, Peluso MA, Hatch JP, Monkul ES, Najt P, et al. Prefrontal hyperactivation during working memory task in untreated individuals with major depressive disorder. Molecular Psychiatry. 2007;12:158–166. doi: 10.1038/sj.mp.4001894. [DOI] [PubMed] [Google Scholar]
- Mayes LC, Molfese DL, Key AP, Hunter NC. Event-related potentials in cocaine-exposed children during a Stroop task. Neurotoxicology and Teratology. 2005;27:797–813. doi: 10.1016/j.ntt.2005.05.011. [DOI] [PubMed] [Google Scholar]
- McNeely HE, West R, Christensen BK, Alain C. Neurophysiological evidence for disturbances of conflict processing in patients with schizophrenia. Journal of Abnormal Psychology. 2003;112:679–688. doi: 10.1037/0021-843X.112.4.679. [DOI] [PubMed] [Google Scholar]
- Miller EK, Cohen JD. An integrative theory of prefrontal cortex function. Annual Review of Neuroscience. 2001;24:167–202. doi: 10.1146/annurev.neuro.24.1.167. [DOI] [PubMed] [Google Scholar]
- Mitterschiffthaler MT, Williams SC, Walsh ND, Cleare AJ, Donaldson C, Scott J, et al. Neural basis of the emotional Stroop interference effect in major depression. Psychological Medicine. 2007:1–10. doi: 10.1017/S0033291707001523. [DOI] [PubMed] [Google Scholar]
- Moritz S, Birkner C, Kloss M, Jahn H, Hand I, Haasen C, et al. Executive functioning in obsessive-compulsive disorder, unipolar depression, and schizophrenia. Archives of Clinical Neuropsychology. 2002;17:477–483. [PubMed] [Google Scholar]
- Nitschke JB, Mackiewicz KL. Prefrontal and anterior cingulate contributions to volition in depression. International Review of Neurobiology. 2005;67:73–94. doi: 10.1016/S0074-7742(05)67003-1. [DOI] [PubMed] [Google Scholar]
- Okada G, Okamoto Y, Morinobu S, Yamawaki S, Yokota N. Attenuated left prefrontal activation during a verbal fluency task in patients with depression. Neuropsychobiology. 2003;47:21–26. doi: 10.1159/000068871. [DOI] [PubMed] [Google Scholar]
- Ottowitz WE, Dougherty DD, Savage CR. The neural network basis for abnormalities of attention and executive function in major depressive disorder: implications for application of the medical disease model to psychiatric disorders. Harvard Review of Psychiatry. 2002;10:86–99. doi: 10.1080/10673220216210. [DOI] [PubMed] [Google Scholar]
- Paradiso S, Lamberty GJ, Garvey MJ, Robinson RG. Cognitive impairment in the euthymic phase of chronic unipolar depression. Journal of Nervous and Mental Disorders. 1997;185:748–754. doi: 10.1097/00005053-199712000-00005. [DOI] [PubMed] [Google Scholar]
- Pascual-Marqui RD, Lehmann D, Koenig T, Kochi K, Merlo MC, Hell D, et al. Low resolution brain electromagnetic tomography (LORETA) functional imaging in acute, neuroleptic-naive, first-episode, productive schizophrenia. Psychiatry Research: Neuroimaging. 1999;90:169–179. doi: 10.1016/s0925-4927(99)00013-x. [DOI] [PubMed] [Google Scholar]
- Pascual-Marqui RD, Michel CM, Lehmann D. Low resolution electromagnetic tomography: a new method for localizing electrical activity in the brain. International Journal of Psychophysiology. 1994;18:49–65. doi: 10.1016/0167-8760(84)90014-x. [DOI] [PubMed] [Google Scholar]
- Pascual-Marqui RD, Michel CM, Lehmann D. Segmentation of brain activity into microstates: Model estimation and validation. IEEE Transactions on Biomedical Engineering. 1995;42:658–665. doi: 10.1109/10.391164. [DOI] [PubMed] [Google Scholar]
- Pizzagalli DA. Electroencephalography and High-Density Electrophysiological Source Localization. In: Cacioppo JT, Tassinaru LG, Berntson GG, editors. Handbook of Psychophysiology. 3rd ed. Cambridge University Press; Cambridge, U.K.: 2007. pp. 56–84. [Google Scholar]
- Pizzagalli DA, Peccoralo LA, Davidson RJ, Cohen JD. Resting anterior cingulate activity and abnormal responses to errors in subjects with elevated depressive symptoms: A 128-channel EEG study. Human Brain Mapping. 2006;27:185–201. doi: 10.1002/hbm.20172. [DOI] [PMC free article] [PubMed] [Google Scholar]
- Porter RJ, Gallagher P, Thompson JM, Young AH. Neurocognitive impairment in drug-free patients with major depressive disorder. British Journal of Psychiatry. 2003;182:214–220. doi: 10.1192/bjp.182.3.214. [DOI] [PubMed] [Google Scholar]
- Rebai M, Bernard C, Lannou J. The Stroop's test evokes a negative brain potential, the N400. The International Journal of Neuroscience. 1997;91:85–94. doi: 10.3109/00207459708986367. [DOI] [PubMed] [Google Scholar]
- Ridderinkhof KR, Ullsperger M, Crone EA, Nieuwenhuis S. The role of the medial frontal cortex in cognitive control. Science. 2004;306:443–447. doi: 10.1126/science.1100301. [DOI] [PubMed] [Google Scholar]
- Rogers MA, Kasai K, Koji M, Fukuda R, Iwanami A, Nakagome K, et al. Executive and prefrontal dysfunction in unipolar depression: a review of neuropsychological and imaging evidence. Neuroscience Research. 2004;50:1–11. doi: 10.1016/j.neures.2004.05.003. [DOI] [PubMed] [Google Scholar]
- Rose EJ, Simonotto E, Ebmeier KP. Limbic over-activity in depression during preserved performance on the n-back task. Neuroimage. 2006;29:203–215. doi: 10.1016/j.neuroimage.2005.07.002. [DOI] [PubMed] [Google Scholar]
- Siegle GJ, Steinhauer SR, Thase ME. Pupillary assessment and computational modeling of the Stroop task in depression. International Journal of Psychophysiology. 2004;52:63–76. doi: 10.1016/j.ijpsycho.2003.12.010. [DOI] [PubMed] [Google Scholar]
- Sneed JR, Roose SP, Keilp JG, Krishnan KR, Alexopoulos GS, Sackeim HA. Response inhibition predicts poor antidepressant treatment response in very old depressed patients. The American Journal of Geriatric Psychiatry. 2007;15:553–563. doi: 10.1097/JGP.0b013e3180302513. [DOI] [PubMed] [Google Scholar]
- Steffens DC, Wagner HR, Levy RM, Horn KA, Krishnan KR. Performance feedback deficit in geriatric depression. Biological Psychiatry. 2001;50:358–363. doi: 10.1016/s0006-3223(01)01165-9. [DOI] [PubMed] [Google Scholar]
- Trichard C, Martinot JL, Alagille M, Masure MC, Hardy P, Ginestet D, et al. Time course of prefrontal lobe dysfunction in severely depressed in-patients: a longitudinal neuropsychological study. Psychological Medicine. 1995;25:79–85. doi: 10.1017/s0033291700028105. [DOI] [PubMed] [Google Scholar]
- van Veen V, Carter CS. The timing of action-monitoring processes in the anterior cingulate cortex. Journal of Cognitive Neuroscience. 2002;14:593–602. doi: 10.1162/08989290260045837. [DOI] [PubMed] [Google Scholar]
- Vanderhasselt MA, De Raedt R, Baeken C, Leyman L, D'haenen H. The influence of rTMS over the left dorsolateral prefrontal cortex on Stroop task performance. Experimental Brain Research. 2006;169:279–282. doi: 10.1007/s00221-005-0344-z. [DOI] [PubMed] [Google Scholar]
- Wagner G, Sinsel E, Sobanski T, Kohler S, Marinou V, Mentzel HJ, et al. Cortical inefficiency in patients with unipolar depression: an event-related FMRI study with the Stroop task. Biological Psychiatry. 2006;59:958–965. doi: 10.1016/j.biopsych.2005.10.025. [DOI] [PubMed] [Google Scholar]
- Walter H, Wolf RC, Spitzer M, Vasic N. Increased left prefrontal activation in patients with unipolar depression: an event-related, parametric, performance-controlled fMRI study. Journal of Affective Disorders. 2007;101:175–185. doi: 10.1016/j.jad.2006.11.017. [DOI] [PubMed] [Google Scholar]
- West R. Neural correlates of cognitive control and conflict detection in the Stroop and digit-location tasks. Neuropsychologia. 2003;41:1122–1135. doi: 10.1016/s0028-3932(02)00297-x. [DOI] [PubMed] [Google Scholar]
- West R, Alain C. Age-related decline in inhibitory control contributes to the increased Stroop effect observed in older adults. Psychophysiology. 2000a;37:179–189. [PubMed] [Google Scholar]
- West R, Alain C. Effects of task context and fluctuations of attention on neural activity supporting performance of the stroop task. Brain Research. 2000b;873:102–111. doi: 10.1016/s0006-8993(00)02530-0. [DOI] [PubMed] [Google Scholar]
- West R, Jakubek K, Wymbs N, Perry M, Moore K. Neural correlates of conflict processing. Experimental Brain Research. 2005;167:38–48. doi: 10.1007/s00221-005-2366-y. [DOI] [PubMed] [Google Scholar]
- West R, Krompinger J, Bowry R, Doll R. Neural correlates of conflict monitoring and error processing. Brain and Cognition. 2004;54:168–170. [PubMed] [Google Scholar]