Abstract
Background
The patterns of expression of homoeologous genes in hexaploid bread wheat have been intensively studied in recent years, but the interaction between structural genes and their homoeologous regulatory genes remained unclear. The question was as to whether, in an allopolyploid, this interaction is genome-specific, or whether regulation cuts across genomes. The aim of the present study was cloning, sequence analysis, mapping and expression analysis of F3H (flavanone 3-hydroxylase – one of the key enzymes in the plant flavonoid biosynthesis pathway) homoeologues in bread wheat and study of the interaction between F3H and their regulatory genes homoeologues – Rc (red coleoptiles).
Results
PCR-based cloning of F3H sequences from hexaploid bread wheat (Triticum aestivum L.), a wild tetraploid wheat (T. timopheevii) and their putative diploid progenitors was employed to localize, physically map and analyse the expression of four distinct bread wheat F3H copies. Three of these form a homoeologous set, mapping to the chromosomes of homoeologous group 2; they are highly similar to one another at the structural and functional levels. However, the fourth copy is less homologous, and was not expressed in anthocyanin pigmented coleoptiles. The presence of dominant alleles at the Rc-1 homoeologous loci, which are responsible for anthocyanin pigmentation in the coleoptile, was correlated with F3H expression in pigmented coleoptiles. Each dominant Rc-1 allele affected the expression of the three F3H homoeologues equally, but the level of F3H expression was dependent on the identity of the dominant Rc-1 allele present. Thus, the homoeologous Rc-1 genes contribute more to functional divergence than do the structural F3H genes.
Conclusion
The lack of any genome-specific relationship between F3H-1 and Rc-1 implies an integrative evolutionary process among the three diploid genomes, following the formation of hexaploid wheat. Regulatory genes probably contribute more to the functional divergence between the wheat genomes than do the structural genes themselves. This is in line with the growing consensus which suggests that although heritable morphological traits are determined by the expression of structural genes, it is the regulatory genes which are the prime determinants of allelic identity.
Background
The flavonoid biosynthesis pathway is central to the formation of the phenolic compounds involved in many plant traits, including resistance to abiotic and biotic stresses [1-4]. One branch of the pathway is responsible for the generation of anthocyanin, which is present in various plant organs in most plant species, including the allohexaploid crop species, bread wheat (Triticum aestivum L.). Two major groups of anthocyanin pigmentation genes are present in wheat: the first includes Rc-1, Pc-1, Pan-1, Plb-1 and Pls-1 which encode the pigmentation in, respectively, the coleoptile, culm, anthers, leaf blades and leaf sheaths; while the second consists of Pp and Ra, which are expressed in, respectively, the pericarp and auricle [5]. The former genes are closely linked to one another on each of the short arms of the homoeologous group 7 chromosomes. An orthologue of maize gene c1 (which encodes a Myb-like transcriptional factor controlling tissue-specific anthocyanin biosynthesis [6]) was mapped earlier on each of the short arms of wheat homoeologous group 7 chromosomes, too [7] in positions highly comparable to those of Rc-1 (red coleoptile) genes [5,8]. Furthermore, it was shown that c1, when transferred to wheat, was able to induce anthocyanin pigmentation in non-pigmented wheat coleoptiles [9]. At the same time Rc-1 was shown to upregulate a number of wheat flavonoid biosynthesis pathway genes – DFR (dihydroflavonol-4-reductase), ANS (anthocyanidin synthase) and UFGT (UDPG flavonol 3-0-glucosyl transferase) [10,11]. Recognizing elements for c1 have also been identified in the promoter sequence of Arabidopsis thaliana F3H gene (flavanone 3-hydroxylase – one of the key enzymes involved in the biosynthesis of flavonoid compounds [12]), suggesting that Rc-1 can probably exert a regulatory role for wheat F3H, too. F3H orthologues have been isolated in barley and maize [13,14] as well as in a range of other plant species http://www.ncbi.nlm.nih.gov/Database/, but have yet to be described in wheat.
The patterns of expression of homoeologous genes in wheat have been intensively studied in recent years [15-21], but the interaction between structural genes and their homoeologous regulatory genes is unclear. The question remains as to whether, in an allopolyploid, this interaction is genome-specific, or whether regulation cuts across genomes. The Rc-1 and F3H genes are a suitable model to investigate just this issue, as the expression of Rc-1 generates a clear phenotype, and the latter are well-characterized at the molecular level. In this paper, we describe the cloning, sequence analysis, mapping and expression of F3H orthologues in bread wheat and its relatives, and the interaction between F3H and the Rc-1 homoeologues.
Results
Sequence analysis of F3H genes in wheat and its relatives
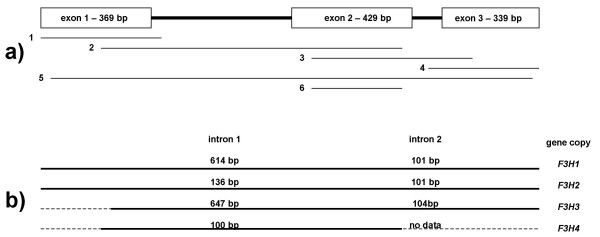
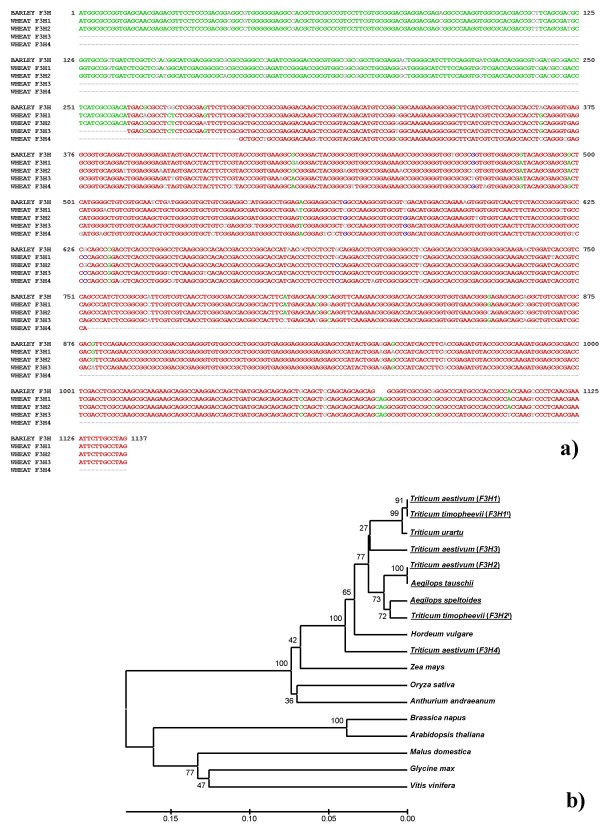
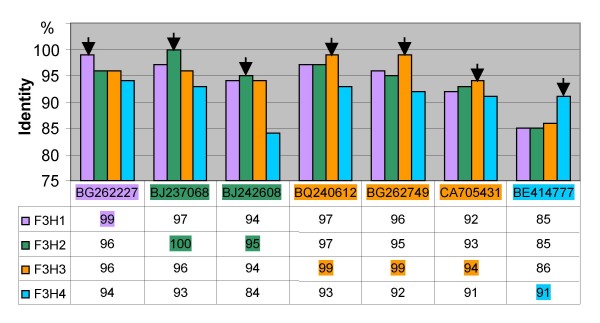
Nine F3H copies were isolated by PCR cloning from bread wheat (genome AABBDD), the tetraploid wild wheat T. timopheevii (AAGG) and the presumed diploid progenitors of the A, B/G and D genomes (A: T. urartu, B/G:Ae. speltoides, D: Ae. tauschii) (Table 1). Four of the copies were isolated from bread wheat. The length of the coding sequence, which was split into three exons, was 1137 bp, and the first intron varied in length among the homoeologues by some hundreds of base pairs (Figure 1). The sequence of the segments of the first intron of the bread wheat copies F3H1, F3H2 and F3H3 not affected by deletions/insertions shared over 80% homology, but the first intron of F3H4 was quite distinct. Sequence alignment of T. aestivum F3H sequences (coding regions) with barley F3H [13] is shown in Figure 2a. Sequence comparisons between exon 2 of the Triticum and Aegilops F3H genes (as well as other F3H sequences lodged in GenBank) are illustrated as dendrogram in Figure 2b. The F3H4 sequence departs significantly from that of the other Triticum and Aegilops copies (Figure 2). T. aestivum F3H1 and T. timopheevii F3H1t sequences are probably derived from the A genome, whereas F3H2 and F3H2t are suggested to belong to the genomes D and G, respectively (Figure 2b). F3H3 occupies an intermediate position between the two main Triticum-Aegilops clusters (Figure 2b). Patterns of sequence divergence across the structural region of wheat F3H1 and F3H2 suggest that the second exon is the most variable at the nucleotide level, but is most well conserved at the amino acid level (Figure 3, Table 2). Exon 2, intron 2 and the beginning of exon 3 (Segment 3, see Figure 1) were re-sequenced from a panel of seven diverse bread wheat genotypes, but no intraspecific variation was detected.
Table 1.
Length, Genbank accession numbers and chromosome locations for F3H nucleotide sequences determined in the present study.
| Species, gene | Length in base pairs (gene segment specification according Figure 1) | Genbank accession number | Identical wheat ESTs* | Chromosome location |
| T. aestivum, F3H1 | 1852, complete structural part of gene (Segments 1+2+3+4) | EF463100 | BG262227 | 2A |
| T. aestivum, F3H2 | 1374, complete structural part of gene (Segments 1+4+5) | DQ233636 | BJ237068 BJ242608 | 2D |
| T. aestivum, F3H3 | 1626, partial (Segments 2+3+4) | EU402957 | BQ240612 BG262749 CA705431 | 2B |
| T. aestivum, F3H4 | 562, partial (Segment 2) | EU402958 | BE414777 | 2B |
| T. timopheevii, F3H1t | 542, partial (Segment 3) | EU402959 | BG262227 | 2A |
| T. timopheevii, F3H2t | 539, partial (Segment 3) | EU402960 | - | 2G |
| T. urartu, F3H | 542, partial (Segment 3) | EU402961 | BG262227 | Suggested 2A |
| Ae. speltoides, F3H | 542, partial (Segment 3) | EU402963 | - | Suggested 2S |
| Ae. tauschii, F3H | 1326, partial (Segment 5) | DQ233637 | BJ237068 BJ242608 | Suggested 2D |
*Correspondence between F3H copies and ESTs was first determined based on identity at gene copy-specific sights, and then was confirmed by whole sequences comparison (see Figure 10).
Figure 1.
The structure of wheat F3H. Different gene segments referred in the paper text and tables are indicated in the figure part (a), length of introns of the different T. aestivum F3H gene copies are indicated in part (b); partial sequences are extended with dotted lines, whereas solid lines correspond to sequences cloned and analysed in the present study.
Figure 2.
F3H sequences comparison: (a) alignment of complete coding sequences of barley F3H [13] and wheat F3H1 and F3H2 and partial wheat F3H3 and F3H4 copies cloned in the present study (introns are not included into alignment); (b) similarity of part of F3H exon 2 (specified as segment 6 in Figure 1) from various plant species – the species from which F3H copies were cloned and analysed in the present study are underlined, others were obtained from GenBank; for species with more than one F3H gene, each copy is identified by a number in parentheses.
Figure 3.
Gene divergence between the hexaploid wheat A and D genome F3H gene copies: (a) percentage of nucleotide substitutions in exons, (b) ratio of non-synonymous (Ka) to synonymous (Ks) nucleotide substitutions.
Table 2.
Sequence homology and divergence among F3H1 and F3H2 genes.
| Part of gene | Length: F3H1/F3H2 (in bp) | Nucleotide sequences homology (%) | Ka/Ks* |
| Exon1 | 369/369 | 98 | 0.125 |
| Intron 1 | 614/136 | There are two major deletion regions, other segments have over 90% homology | - |
| Exon 2 | 429/429 | 97 | 0.000 |
| Intron 2 | 101/101 | 97 | - |
| Exon 3 | 339/339 | 98 | 0.167 |
*Ka – non-synonymous nucleotide substitutions, Ks – synonymous nucleotide substitutions.
Chromosomal assignment and physical mapping of F3H genes in hexaploid wheat
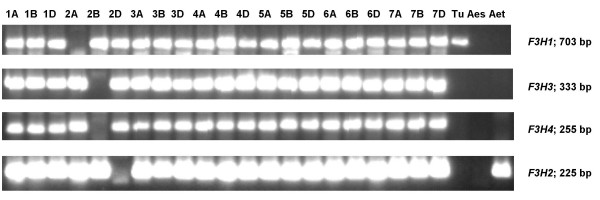
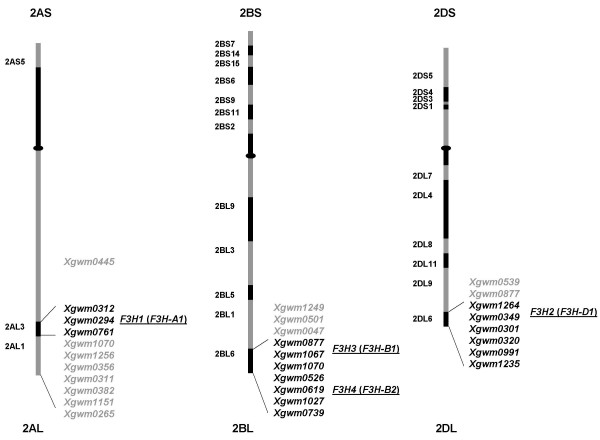
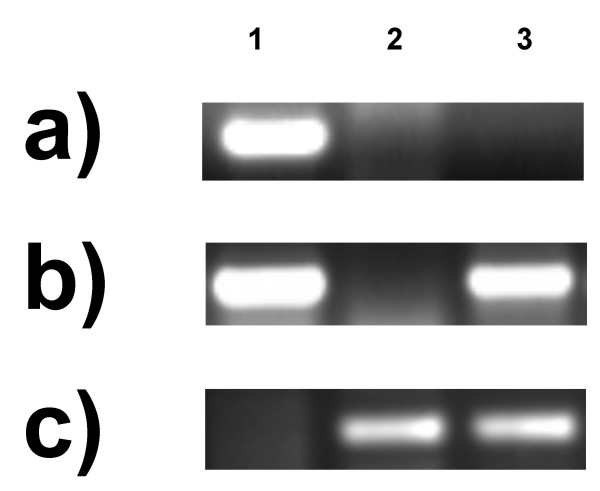
Primer pairs amplifying specifically fragments from individual F3H copies (referred further as "gene copy-specific primer pairs") were designed and used in PCR analysis of 'Chinese Spring' nulli-tetrasomic lines. It was shown that F3H1 and 2 are on, respectively, chromosomes 2A and 2D, while 3 and 4 both map to chromosome 2B (Table 1, Figure 4). A deletion line analysis was then used to define the intra-chromosomal location of F3H1 to the sub-terminal bin (2AL3) of chromosome 2AL, both F3H3 and F3H4 to the terminal bin (2BL6) of chromosome 2BL, and F3H2 to the terminal bin (2DL6) of chromosome 2DL (Figure 5). Since the location of F3H3 and F3H4 could not be distinguished by this method, an introgression line derived from the cross T. aestivum × T. timopheevii, which contains a 2BL/2GL breakpoint within chromosome bin 2BL6 between the microsatellite loci Xgwm1067 and Xgwm0526 [22], was used to show that F3H3 and -4 are discrete loci (Figure 6a and 6b, respectively). F3H3 lies proximal to the to the 2BL/2GL breakpoint, whereas F3H4 location is distal. A specific PCR assay for the T. timopheevii F3H2t sequence (Figure 6c) proved that it, like T. aestivum F3H3, too lies proximal to the 2BL/2GL breakpoint, thus suggesting that these two loci, along with F3H1 and F3H2, belong to an F3H homoeoallelic series, whereas F3H4 appears to be a non-homoelogous duplication. Accordingly, the genes were re-designated F3H-A1 (F3H1), F3H-B1 (F3H3), F3H-D1 (F3H2), F3H-G1 (F3H2t) and F3H-B2 (F3H4).
Figure 4.
PCR profiles of the 'Chinese Spring' nulli-tetrasomic lines and the diploid donors of hexaploid wheat, amplified with F3H copy-specific primers. The length of the PCR products is given in base pairs to the right. Designations '1A', '1B' etc. correspond to 'nulli' chromosome in the certain nulli-tetrasomic line; 'Tu' – T. urartu, 'Aes' – Ae. speltoides, 'Aet' – Ae. tauschii.
Figure 5.
Physical mapping of F3H loci in bread wheat performed using subset of T. aestivum cv. 'Chinese Spring' homoeologous group 2 chromosomes deletion lines. Microsatellite markers (Xgwm) designations are given to the right from each chromosome scheme, chromosome bin names are indicated to the left.
Figure 6.
PCR profiles of 'Saratovskaya 29' (1), T. timopheevii (2) and 'Saratovskaya 29'x T. timopheevii introgression line 842 (3), amplified with gene copy-specific primers for T. aestivum F3H3 (a) and F3H4 (b) and T. timopheevii F3H2t (c).
Expression analysis of F3H in lines with and without pigmented coleoptiles
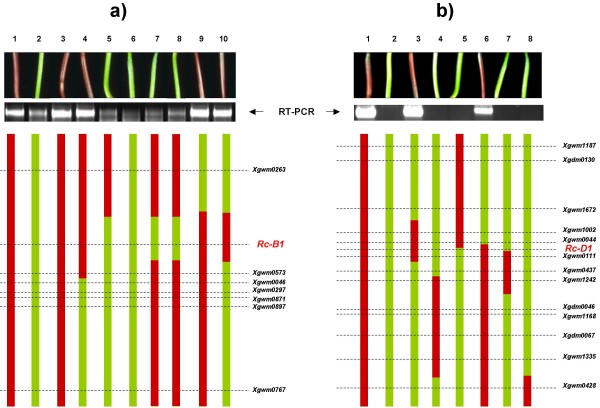
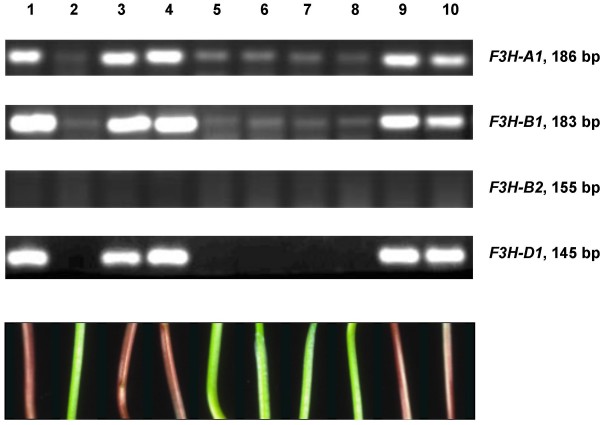
To explore the role of the Rc-1 (red coleoptile) genes as regulators for F3H expression, eight progeny from the cross 'Chinese Spring' ('Hope' 7B) × 'TRI 2732', along with a set of six different chromosome 7D introgression lines of Ae. tauschii into 'Chinese Spring', varying with respect to the dominant allele at either Rc-B1 or Rc-D1, were subjected to RT-PCR analysis from cDNA derived from four day old seedlings. The parental genotypes with pigmented coleoptiles ('Chinese Spring' ('Hope' 7B) and 'Chinese Spring (Ae. tauschii 7D) both showed a high level of F3H expression, whereas those with non-pigmented coleoptiles showed either little ('TRI 2732') or none ('Chinese Spring') (Figure 7). When this result was compared with the microsatellite-based genotype of the lines [8,23], the regulator of F3H expression on chromosome 7B was mapped between Xgwm0263 and Xgwm0573, co-segregating with Rc-B1 (Figure 7a); similarly, the equivalent locus on chromosome 7D co-segregated with Rc-D1 within the genetic interval Xgwm0044 and Xgwm0111 (Figure 7b). RT-PCR was also used to study contribution of single genes F3H-A1, F3H-B1, F3H-B2 and F3H-D1 to total F3H expression. It was shown that F3H-B2 is not expressed whether or not the coleoptiles are pigmented (Figure 8). In contrast, F3H-A1, F3H-B1 and F3H-D1 were actively expressed in lines with pigmented coleoptiles ('Chinese Spring' ('Hope' 7B) and respective recombinant lines; Figure 8, lines 1, 3, 4, 9, 10), whereas those with non-pigmented coleoptiles ('TRI 2732' and respective recombinant lines) showed a low level of expression of only F3H-A1 and F3H-B1 (Figure 8: faint bands in lines 2, 5–8, respectively).
Figure 7.
RT-PCR analysis of total F3H expression in four day old seedlings of (a) 'Chinese Spring' ('Hope' 7B) (1), 'TRI 2732' (2) and progeny of the cross 'Chinese Spring' ('Hope' 7B) × 'TRI 2732' (3–10); (b) substitution 'Chinese Spring' (Ae. tauschii 7D) (1), 'Chinese Spring' (2) and the 'Chinese Spring'/Ae. tauschii 7D introgression lines (3–8). Anthocyanin pigmentation in coleoptiles of the corresponding lines is shown above, whereas the status of chromosomes 7B (a) or 7D (b) of each line is indicated in the lower part of the panel.
Figure 8.
F3H copy-specific RT-PCR analysis from four day old seedlings of 'Chinese Spring' ('Hope' 7B) (1), 'TRI 2732' (2) and progeny of the cross 'Chinese Spring' ('Hope' 7B) × 'TRI 2732' (3–10). Anthocyanin pigmentation in coleoptiles of the corresponding lines is shown below. The length of the RT-PCR products is given in base pairs to the right.
Temporal pattern and the genome specificity of F3H expression
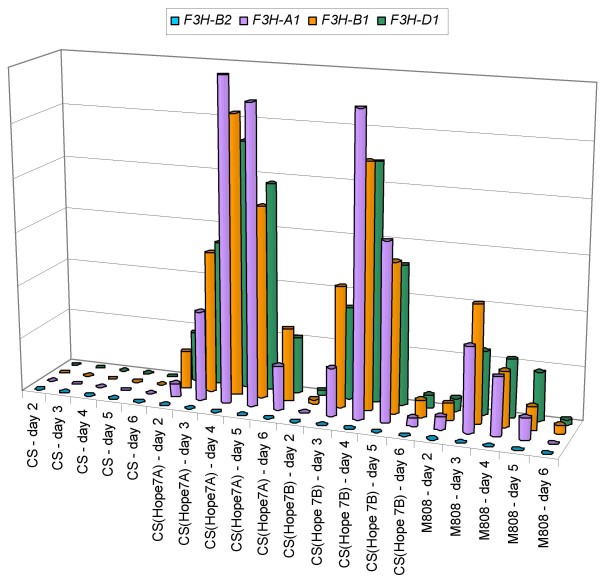
To investigate the possibility of more subtle differences between expression levels of the F3H homoeologues in presence of particular alleles of Rc-1, quantitative RT-PCR was applied to a set of cDNAs sampled from two to six day old seedlings (Figure 9). The test genotypes were 'Chinese Spring' ('Hope' 7A) [Rc-A1b], 'Chinese Spring' ('Hope' 7B) [Rc-B1b] and cv. 'Mironovskaya 808' [Rc-D1b], along with the control 'Chinese Spring' which carries the non-pigmented alleles at all three Rc-1 loci. In the latter, none of the F3H copies was expressed at any time during the sampling period. F3H-B2 was not expressed in any of three test line seedlings, but F3H-A1, F3H-B1 and F3H-D1 were all expressed in these lines. No within genotype significant difference (p = 0.05) in the expression level of the three homoeologues could be detected at any of the sampling times (Table 3). However, the overall level of F3H expression differed very significantly between each pair of lines (Table 4). The level was lowest in 'Mironovskaya 808' and highest in 'Chinese Spring' ('Hope' 7A). The highest expression level in 'Mironovskaya 808' was reached three days after germination, while in 'Chinese Spring' ('Hope' 7A) and 'Chinese Spring' ('Hope' 7B), the maximum was detected on the fourth day. In 'Chinese Spring' ('Hope' 7B), expression started later and declined more rapidly than in 'Chinese Spring' ('Hope' 7A). The delayed start and lower total level of expression in 'Chinese Spring' ('Hope' 7B) was consistent with the observed temporal development of pigmentation in the coleoptiles. Overall, therefore, each Rc-1 gene appeared to regulate the expression of the three F3H homoeologues equally, but the level of F3H expression was dependent on the identity of the dominant Rc-1 allele present.
Figure 9.
Quantitative RT-PCR analysis with respect to the various copies of F3H in 'Chinese Spring' (CS), 'Chinese Spring' ('Hope' 7A), 'Chinese Spring' ('Hope' 7B) and 'Mironovskaya 808' (M808).
Table 3.
T-values for expression levels of different F3H homoeologues in coleoptiles (p = 0.05 for all presented values).
| F3H-A1 vs F3H-B1 | F3H-A1 vs F3H-D1 | F3H-D1 vs F3H-B1 | |
| 'Chinese Spring' ('Hope' 7A) | 0.28 | 0.40 | 0.40 |
| 'Chinese Spring' ('Hope' 7B) | 0.04 | 0.48 | 1.92 |
| 'Mironovskaya 808' | 1.39 | 0.27 | 0.52 |
Table 4.
T-values for F3H expression in different wheat genotypes.
| Genotypes compared | 'Chinese Spring' ('Hope' 7A) vs 'Chinese Spring' ('Hope' 7B) | 'Chinese Spring' ('Hope' 7A) vs 'Mironovskaya 808' | 'Chinese Spring' ('Hope' 7B) vs 'Mironovskaya 808' |
| T | 6.17 | 4.29 | 2.76 |
| P > | 0.999 | 0.999 | 0.95 |
Discussion
Cloning and analysis of F3H sequences
F3H genes have been isolated from barley, maize and Arabidopsis thaliana [13,14,24] as well as from a range of other plant species http://www.ncbi.nlm.nih.gov/Database/. In wheat, only one single partial F3H sequence has been published to date [11]. The relationship between the wheat and Aegilops sp. F3H sequences reported here (with the exception of F3H-B2) and those lodged in GenBank (Figure 2) is consistent with standard taxonomic treatment [25] and with known phylogenies within the Triticum/Aegilops complex [26]. The F3H sequences of diploid progenitors of wheat were useful for the genome assignment of the homoeologous gene copies in polyploid wheat. The substantial structural divergence between F3H-B2 and that of three F3H-1 homoeologues is accompanied by a functional difference. The lack of F3H-B2 expression in pigmented coleoptiles does not reflect its complete non-functionality, since a highly identical root EST has been reported (Table 1, Figure 10). The presence of two B genome copies of F3H is not a particularly unusual result, as F3H copy number in diploids varies from one [13,14,24] to two [27,28]. Silent divergence (Ka/Ks) appears to be homogeneously distributed throughout the coding region of Arabidopsis thaliana F3H, being rarest in the second, and most frequent in the third exon [29]. A similar pattern applies to the wheat A and D genome F3H homoeologues (Figure 3, Table 2).
Figure 10.
Comparison of T. aestivum F3H copies vs homologous wheat ESTs. The highest identity value for each EST is indicated with black arrow.
A PCR-based cloning approach has been used to clone other flavonoid biosynthesis pathway genes in hexaploid wheat (Table 5), whereas in barley and other diploid species they have been isolated from cDNA libraries [13,30]. It has recently become clear that not all members of a homoeologous series in wheat are co-expressed [16,18,31], so the genomic PCR-based cloning approach is probably the more preferable strategy to capture a full set of homoeologues. Although PCR-based cloning has some disadvantages when applied in an allopolyploid (specifically in the generation of PCR chimeras – however, this problem can usually be overcome by the cloning and sequencing of several replicates), it is an effective strategy for the design of gene copy-specific primers, the chromosomal localization of genes and expression analysis.
Table 5.
Previously characterised flavonoid biosynthesis pathway genes in wheat.
| Gene cloning | Mapping | |||
| Enzyme | Cloning approach | Number of cloned copies | Genbank accessions; references | Chromosome location; references |
| PAL – phenylalanine ammonialyase | Isolation from genomic library | 2 complete | X99705[41,42] | 3A, 3B, 3D, 6A, 6B, 6D [7] |
| CHS – chalcone synthase | PCR-based cloning | 4 complete | AY286093, AY286095, AY286096, AY286097[43] | 1A, 1B, 1D, 2A, 2B, 2D [7] |
| CHI – chalcone-flavanone isomerase | PCR-based cloning | 1 partial | AB187026[11] | 5A, 5B, 5D [7] |
| F3H – flavanone 3-hydroxylase | PCR-based cloning | 1 partial | AB187027[11] | - |
| F3'5'H – flavonoid 3',5'-hydroxylase | PCR-based cloning | 1 partial | AY519468[43] | - |
| DFR – dihydroflavonol-4-reductase | PCR-based cloning | 3 complete | AB162138, AB162139, AB162140[44] | 3AL, 3BL, 3DL [44,45] |
| ANS – anthocyanidin synthase | Not described | 5 complete | AB247917, AB247918, AB247919, AB247920, AB247921[46] | 6AS (2 copies), 6BS (2 copies), 6DS [46] |
| FMT – flavonoid 7-O-methyltransferase | - | - | - | 1A, 1B, 1D [7] |
Expression of the three homoeologous F3H loci in lines with and without pigmented coleoptiles
The patterns of expression of flavanone 3-hydroxylase in lines with and without pigmented coleoptiles indicated that Rc-B1 and Rc-D1 are coincident with the genes regulating its expression (Figure 7). This is in accordance with the suggestion that Rc-1 genes exert a regulatory role for F3H genes, which could be made on the base of combined results obtained earlier [5-9,12]. The patterns of temporal expression among the F3H homoeologues in the presence of different dominant Rc-1 alleles allowed for an examination as to whether, in an allopolyploid context, there are any genome-specific relationships between the structural and regulatory genes. No such relationship was apparent, since in pigmented coleoptiles, F3H-A1, F3H-B1 and F3H-D1 were all expressed at a similar level (Figure 9). Many sets of wheat homoeologous genes are known to be equally expressed in this way [16,19,21], but in others, the expression of one or more members may be either completely [16,18,31] or partially [15,20,21] suppressed. Generally, when F3H homoeologues are expressed actively (as in pigmented coleoptiles), then they are expressed equally, but where overall F3H transcription level is low, then selective expression of F3H homoeologues could be observed (i.e. F3H-A1 and F3H-B1 were expressed in the green coleoptiles of 'TRI 2732', but F3H-D1 was not; Figure 8). These outcomes are consistent with the activity-selectivity principle [32] acting at the transcriptional level.
Functional difference between homoeologous Rc-1 genes
Whereas each dominant Rc-1 allele affects the expression of each of the three F3H homoeologues equally, overall F3H expression was dependent on the identity of which dominant Rc-1 allele was present (Figure 9). This difference was observed not only at specific time points, but also from the total amounts of F3H mRNA produced over the period of coleoptile pigmentation. The delayed start of expression and the lesser level of transcript present in 'Chinese Spring' ('Hope' 7B) compared to 'Chinese Spring' ('Hope' 7A) was consistent with the observed accumulation of pigmentation in the coleoptile, both in the present experiments and in those reported earlier [33]. In order to test for background effects on F3H expression or variability within transcriptional factors encoded by dominant Rc-1 alleles in other genotypes, it would be of interest to investigate the extent to which the profiles of F3H expression of 'Chinese Spring' ('Hope' 7A), 'Chinese Spring' ('Hope' 7B) and 'Mironovskaya 808' are typical, i.e. for instance to compare profile of 'Mironovskaya 808' to those of some other varieties carrying the same dominant allele (Rc-D1).
Conclusion
There are at least four flavanone 3-hydroxylase gene copies in the hexaploid genome of bread wheat, three of which are the homoeologues on chromosomes 2AL, 2BL and 2DL, highly similar at structural and functional level, while the fourth one represents a distinct non-homoeologous copy on chromosome 2BL with suppressed expression in red coleoptiles.
Expression of the F3H homoeologues (F3H-1) in wheat coleoptiles is determined by the presence of dominant alleles in Rc-1 (red coleoptiles) loci. Rc-1 and F3H-1 genes represent a suitable model to investigate relationship between homoeologous regulatory and homoeologous structural genes in allopolyploid wheat genome (which have never been studied before). The lack of any genome-specific relationship between F3H-1 and Rc-1 observed in the present study implies an integrative evolutionary process among the three diploid genomes, following the formation of hexaploid wheat.
Furthermore, based on F3H expression analysis it was observed for the first time that activity-selectivity principle [32] acts at the transcriptional level.
Our general conclusion is that regulatory genes probably contribute more to the functional divergence between the wheat genomes than do the structural genes themselves. This is in line with the growing consensus which suggests that although heritable morphological traits are determined by the expression of structural genes, it is the regulatory genes which are the prime determinants of allelic identity.
Methods
Plant materials and RNA extraction
The bread wheat cultivars 'Chinese Spring', 'Opata', 'Flair', 'Prinz', 'Golubka', 'Novosibirskaya 67', the synthetic hexaploid wheat 'W7984', tetraploid T. timopheevii k-38555 (AAGG) and the diploids T. urartu TMU06 (AA), Aegilops speltoides TS01 (SS) and Ae. tauschii TQ17 (DD) were used for PCR-based cloning. The complete set of 'Chinese Spring' nulli-tetrasomic lines [34], a subset of homoeologous group 2 chromosome deletion lines [35], introgression line 842 derived from the cross T. aestivum cv. 'Saratovskaya 29' × T. timopheevii [22] were exploited to establish chromosome bin locations. Eight progeny from the cross 'Chinese Spring' ('Hope' 7B) × 'TRI 2732' [8] and a set of six homozygous lines each containing a different chromosome 7D segment derived from Ae. tauschii in a 'Chinese Spring' background [23] were used for RT-PCR. Quantitative examination of F3H expression was measured in 'Chinese Spring' and 'Mironovskaya 808' and the single chromosome substitution lines 'Chinese Spring' ('Hope' 7A) and 'Chinese Spring' ('Hope' 7B). DNA was extracted from seven day old seedlings following the procedure described earlier [36]. RNA was extracted from seedlings grown at 20°C under a 12 h day/12 h night regime using the QIAGEN http://www1.qiagen.com/ Plant Rneasy Kit, followed by DNAse treatment. For RT-PCR, RNA was extracted on the fourth day after germination. For quantitative RT-PCR, RNA was extracted every 24 h from two to six day old seedlings.
PCR-based cloning and sequence analysis
The barley F3H cDNA sequence [13] was aligned with matching wheat ESTs lodged in http://www.ncbi.nlm.nih.gov/Database/, employing Multalin v5.4.1 (using absolute alignment score with gap value of 12 and gap length value of 2) [37]. Sets of primers flanking various F3H gene segments were designed using OLIGO software (Table 6) [38], with one primer pair as described earlier [11]. PCR reaction mixtures (50 μl) contained 50 ng template, 67 mM Tris HCl pH8.8, 1.8 mM MgCl2, 0.01% Tween 20, 18 mM (NH4)2SO4, 0.2 mM dNTP, 0.25 mM each primer and 1 U Taq DNA polymerase. PCR amplifications began with a 94°C/5 min incubation, followed by 45 cycles of 94°C/1 min, 60°C/2 min, 72°C/2 min, and a final extension of 72°C/10 min. PCR fragments were recovered from 1% agarose gels, purified using a QIAGEN MinElute Gel Extraction Kit, and cloned with a QIAGEN PCR Cloning Kit. Between five and ten clones per each primer combination per diploid genome were sequenced in both directions to eliminate PCR and sequencing errors or PCR-generated chimeras. Sequencing was effected using an ABI PRISM Dye Terminator Cycle Sequencing ready reaction kit ("Perkin Elmer") with pUC/M13 forward and reverse primers. Full-(or partial) length sequences of various F3H gene copies were constructed from overlapping sequences. Cluster analysis was performed on MEGA v3.1 software [39] using the UPGMA (unweighted pair-group method with arithmetic average) algorithm and 500 bootstrap trials.
Table 6.
Primers designed to amplify wheat F3H for cloning, chromosomal localization and for expression analysis.
| Purpose | Gene | Gene segment specification (according Figure 1) or former gene name | DNA/cDNA-derived PCR product length (bp) | Forward primers | Reverse primers |
| PCR-based cloning | F3H | Segment 1 | variable | atggcgccggtgagcaac | tttacgtggcatggcatgcat |
| F3H | Segment 2 | variable | atgacgcgcctctctcgcg | tggacggtgatccaggtcttg | |
| F3H | Segment 3 | variable | [11] | [11] | |
| F3H | Segment 4 | variable | tctcgatcgatcgaccaccaa | ctaggcaagaatttcgttgaggg | |
| F3H | Segment 5 | variable | ccggtgagcaacgagacgttc | ggcaagaatttcgttgagggg | |
| Chromosomal assignment and | F3H-A1 | T. aestivum F3H1 | 703/- | gccacctgcaggtatacacgcat | ccaccgcccgtagtccct |
| physical mapping | F3H-B1 | T. aestivum F3H3 | 333/- | gcgtgctgtccgaggcgc | cgatcgatcgattaaggatt |
| F3H-B2 | T. aestivum F3H4 | 255/155 | gctgcctgccgaggacaagg | aacgcccgtagtcccgtgcc | |
| F3H-D1 | T. aestivum F3H2 | 225/- | gccacctgcaggtacccacacat | ccacctcccgtagtcccg | |
| F3H-G1 | T. timopheevii F3H2t | 371/- | acgactcatggggctgtca | caattggtggtcgatcgatcag | |
| qRT-PCR, RT-PCR | F3H-A1 | T. aestivum F3H1 | 800/186 | atgacacgcctctctcgcg | ccaccgcccgtagtccct |
| F3H-B1 | T. aestivum F3H3 | 830/183 | tgacgcgcctctctcgcgag | accgcccgtagtcccgtgct | |
| F3H-B2 | T. aestivum F3H4 | 255/155 | gctgcctgccgaggacaagg | aacgcccgtagtcccgtgcc | |
| F3H-D1 | T. aestivum F3H2 | 281/145 | atcgtctccagccacctgcag | cgctgtatcgctccaccacg |
Chromosomal assignment and physical mapping of F3H
Specific primer pairs were designed to amplify each wheat F3H copy (Table 6). To obtain a unique amplification product, the 3' end of at least one of the two primers matched the copy-specific sequence. A touchdown PCR protocol was used to amplify from templates of the 'Chinese Spring' nulli-tetrasomic and deletion lines and the T. aestivum × T. timopheevii introgression line 842 in 20 μl reactions by applying a denaturing step of 94°C/2 min, 13 cycles of 94°C/15 s, 65°C/30 s (decreasing by 0.7°C/cycle), 72°C/45 s, 24 cycles of 94°C/15 s, 56/30 s, 72°C/45 s; and a final extension of 72°C/5 min. The specificity of the amplifications was confirmed by cloning and sequencing of the PCR product from 'Chinese Spring'. The microsatellite analysis of the 'Chinese Spring' deletion lines was performed using procedures described earlier [40]. The microsatellite genotypic data of the T. aestivum × T. timopheevii introgression line 842 have been published [22].
RT-PCR and qRT-PCR
Single-stranded cDNA was synthesized from 1 mg total RNA using a (dT)15 primer and the QIAGEN Omniscript Reverse Transcription kit in a 20 μl reaction mixture. RT-PCR was performed with F3H primers published earlier [11] or with F3H gene copy-specific primers (Table 6). The standardization of cDNA template was performed using ubiquitin (UBC) primers [11]. PCR products were separated by 2% agarose gel electrophoresis. F3H gene copy-specific primers were also applied for qRT-PCR, which used a QIAGEN QuantiTect SYBR Green kit. UBC and GAPDH primers were used to standardize the cDNA template. The amplifications were performed in an Applied Biosystems 7900 HT fast real time PCR system. Pre-determined amounts of cloned cDNA were used to generate standard curves. Each sample was run in three replicates. The specificity of the qRT-PCR products was confirmed by 2% agarose gel electrophoresis. Statistical significance of differences in F3H expression level either between F3H homoeologues or between different genotypes was assessed by Student's t-test for matched pairs. When F3H homoeologues were compared, T-values were calculated for each pair (F3H-A1 vs F3H-B1, etc.) in each genotype (Table 3), and 'matched pairs' were represented by expression level values obtained for respective pair of F3H homoeologues at the same day in the same genotype. When comparison was made between genotypes, T-values were calculated for each pair of genotypes ('Chinese Spring' ('Hope' 7A) vs 'Chinese Spring' ('Hope' 7B), etc.; Table 4), and 'matched pairs' were represented by expression level values obtained in respective pair of genotypes at the same day for the same F3H gene copy.
Accession numbers for sequence data
GenBank: EF463100, EU402957, EU402958, DQ233636, EU402959, EU402960, EU402961, EU402963, DQ233637.
Authors' contributions
EKK carried out the molecular genetic studies, sequence alignment, primer design and statistical analysis, she conceived of the study, participated in its design and drafted the manuscript. MSR and EAS coordinated the study, contributed to its conception and design, to interpretation of data and to revising the manuscript critically. All authors read and approved the final manuscript.
Acknowledgments
Acknowledgements
We thank Drs. A. Börner and B.S. Gill for seed of the wheat cultivars and lines, Drs. I. Leonova and E. Pestsova for providing the microsatellite genotyping data for, respectively, T. aestivum x. timopheevii and T. aestivum/Ae. tauschii introgression lines. We also thank Dr. R. Koebner for fruitful discussion and Stefanie Lück for valuable suggestions regarding qRT-PCR. This study was supported by the Russian Foundation for Basic Research (08-04-00368-a), INTAS (04-83-3786), the program "Biodiversity and Dynamics of Gene Pools" of the Presidium of the Russian Academy of Sciences, SB RAS (Lavrentjev grant and Integration Project 5.8), the Russian Science Support Foundation, Timofeeff-Ressovsky Scientific Society "Biosphere and Mankind", and a grant from the President of the Russian Federation (MK-566.2007.4). We also thank www.smartenglish.co.uk for linguistic advice in the preparation of this manuscript.
Contributor Information
Elena K Khlestkina, Email: khlest@bionet.nsc.ru.
Marion S Röder, Email: roder@ipk-gatersleben.de.
Elena A Salina, Email: salina@bionet.nsc.ru.
References
- Bogdanova ED, Sarbaev AT, Makhmudova KK. Resistance of common wheat to bunt [abstract] Proceedings of the Research Conference on Genetics: 2002; Moscow. 2002. pp. 43–44.
- Gould KS. Nature's swiss army knife: the diverse protective roles of anthocyanins in leaves. J Biomed Biotech. 2004;5:314–320. doi: 10.1155/S1110724304406147. [DOI] [PMC free article] [PubMed] [Google Scholar]
- Ryan KG, Swinny EE, Winefield C, Markham KR. Flavonoids and UV photoprotection in Arabidopsis mutants. Z Naturforsch [C] 2001;56:745–754. doi: 10.1515/znc-2001-9-1013. [DOI] [PubMed] [Google Scholar]
- Winkel-Shirley B. Biosynthesis of flavonoids and effects of stress. Cur Op Plant Biol. 2002;5:218–223. doi: 10.1016/S1369-5266(02)00256-X. [DOI] [PubMed] [Google Scholar]
- Khlestkina EK, Röder MS, Pshenichnikova TA, Simonov AV, Salina EA, Börner A. Genes for anthocyanin pigmentation in wheat: review and microsatellite-based mapping. In: Verrity JF, Abbington LE, editor. Chromosome Mapping Research Developments. New York: NOVA Science Publishers, Inc, USA; 2008. pp. 155–175.https://www.novapublishers.com/catalog/product_info.php?products_id=6838 [Google Scholar]
- Paz-Ares J, Ghosal D, Wienand U, Peterson PA, Saedler H. The regulatory c1 locus of Zea mays encodes a protein with homology to myb proto-oncogene products and with structural similarities to transcriptional activators. EMBO J. 1987;6:3553–3558. doi: 10.1002/j.1460-2075.1987.tb02684.x. [DOI] [PMC free article] [PubMed] [Google Scholar]
- Li WL, Faris JD, Chittoor JM, Leach JE, Hulbert SH, Liu DJ, Chen PD, Gill BS. Genomic mapping of defense response genes in wheat. Theor Appl Genet. 1999;98:226–233. doi: 10.1007/s001220051062. [DOI] [Google Scholar]
- Khlestkina EK, Pestsova EG, Röder MS, Börner A. Molecular mapping, phenotypic expression and geographical distribution of genes determining anthocyanin pigmentation of coleoptiles in wheat (Triticum aestivum L.) Theor Appl Genet. 2002;104:632–637. doi: 10.1007/s00122-001-0788-x. [DOI] [PubMed] [Google Scholar]
- Ahmed N, Maekawa M, Utsugi S, Himi E, Ablet H, Rikiishi K, Noda K. Transient expression of anthocyanin in developing wheat coleoptile by maize c1 and B-peru regulatory genes for anthocyanin synthesis. Breed Sci. 2003;52:29–43. doi: 10.1270/jsbbs.53.29. [DOI] [Google Scholar]
- Ahmed N, Maekawa M, Utsugi S, Rikiishi K, Ahmad A, Noda K. The wheat Rc gene for red coleoptile colour codes for a transcriptional activator of late anthocyanin biosynthesis genes. J Cereal Sci. 2006;44:54–58. doi: 10.1016/j.jcs.2006.03.002. [DOI] [Google Scholar]
- Himi E, Nisar A, Noda K. Colour genes (R and Rc) for grain and coleoptile upregulate flavonoid biosynthesis genes in wheat. Genome. 2005;48:747–754. doi: 10.1139/g05-026. [DOI] [PubMed] [Google Scholar]
- Hartmann U, Sagasser M, Mehrtens F, Stracke R, Weisshaar B. Differential combinatorial interactions of cis-acting elements recognized by R2R3-MYB, BZIP, and BHLH factors control light-responsive and tissue-specific activation of phenylpropanoid biosynthesis genes. Plant Mol Biol. 2005;57:155–171. doi: 10.1007/s11103-004-6910-0. [DOI] [PubMed] [Google Scholar]
- Meldgaard M. Expression of chalcone synthase, dihydroflavonol reductase, and flavonone-3-hydroxilase in mutants of barley deficient in anthocyanin and proanthocyanidin biosynthesis. Theor Appl Genet. 1992;83:695–706. doi: 10.1007/BF00226687. [DOI] [PubMed] [Google Scholar]
- Deboo GB, Albertsen MC, Taylor LP. Flavanone 3-hydroxylase transcripts and flavonol accumulation are temporally coordinate in maize anthers. Plant J. 1995;7:703–713. doi: 10.1046/j.1365-313X.1995.07050703.x. [DOI] [PubMed] [Google Scholar]
- Appleford NE, Evans DJ, Lenton JR, Gaskin P, Croker SJ, Devos KM, Phillips AL, Hedden P. Function and transcript analysis of gibberellin-biosynthetic enzymes in wheat. Planta. 2006;223:568–582. doi: 10.1007/s00425-005-0104-0. [DOI] [PubMed] [Google Scholar]
- Bottley A, Xia GM, Koebner RM. Homoeologous gene silencing in hexaploid wheat. Plant J. 2006;47:897–906. doi: 10.1111/j.1365-313X.2006.02841.x. [DOI] [PubMed] [Google Scholar]
- Devos KM, Beales J, Ogihara Y, Doust AN. Comparative sequence analysis of the phytochrome C gene and its upstream region in allohexaploid wheat reveals new data on the evolution of its three constituent genomes. Plant Mol Biol. 2005;58:625–641. doi: 10.1007/s11103-005-6801-z. [DOI] [PubMed] [Google Scholar]
- Kawaura K, Mochida K, Ogihara Y. Expression profile of two storage-protein gene families in hexaploid wheat revealed by large-scale analysis of expressed sequence tags. Plant Physiol. 2005;139:1870–1880. doi: 10.1104/pp.105.070722. [DOI] [PMC free article] [PubMed] [Google Scholar]
- Morimoto R, Kosugi T, Nakamura C, Takumi S. Intragenic diversity and functional conservation of the three homoeologous loci of the KN1-type homeobox gene Wknox1 in common wheat. Plant Mol Biol. 2005;57:907–924. doi: 10.1007/s11103-005-3247-2. [DOI] [PubMed] [Google Scholar]
- Nomura T, Ishihara A, Yanagita RC, Endo TR, Iwamura H. Three genomes differentially contribute to the biosynthesis of benzoxazinones in hexaploid wheat. Proc Natl Acad Sci USA. 2005;102:16490–16495. doi: 10.1073/pnas.0505156102. [DOI] [PMC free article] [PubMed] [Google Scholar]
- Shitsukawa N, Tahira C, Kassai K, Hirabayashi C, Shimizu T, Takumi S, Mochida K, Kawaura K, Ogihara Y, Murai K. Genetic and epigenetic alteration among three homoeologous genes of a class E MADS box gene in hexaploid wheat. Plant Cell. 2007;19:1723–1737. doi: 10.1105/tpc.107.051813. [DOI] [PMC free article] [PubMed] [Google Scholar]
- Leonova I, Börner A, Budashkina E, Kalinina N, Unger O, Röder M, Salina E. Identification of microsatellite markers for a leaf rust resistance gene introgressed into common wheat from Triticum timopheevii. Plant Breed. 2004;123:93–95. doi: 10.1046/j.0179-9541.2003.00906.x. [DOI] [Google Scholar]
- Pestsova EG, Röder MS, Börner A. Development and QTL assessment of Triticum aestivum-Aegilops tauschii introgression lines. Theor Appl Genet. 2006;112:634–647. doi: 10.1007/s00122-005-0166-1. [DOI] [PubMed] [Google Scholar]
- Pelletier MK, Shirley BW. Analysis of flavanone 3-hydroxylase in Arabidopsis seedlings. Coordinate regulation with chalcone synthase and chalcone isomerase. Plant Physiol. 1996;111:339–345. doi: 10.1104/pp.111.1.339. [DOI] [PMC free article] [PubMed] [Google Scholar]
- Dorofeev VF, Korovina ON, Eds . Flora of Cultivated Plants. Leningrad: Kolos; 1979. [Google Scholar]
- Feldman M. The origin of Cultivated Wheat. In: Benjean AP, Angus WJ, editor. The Wheat Book A History of Wheat Breeding. Paris: Lavoisier Publishing; 2001. pp. 3–56. [Google Scholar]
- Sparvoli F, Martin C, Scienza A, Gavazzi G, Tonelli C. Cloning and molecular analysis of structural genes involved in flavonoid and stilbene biosynthesis in grape (Vitis vinifera L.) Plant Mol Biol. 1994;24:743–755. doi: 10.1007/BF00029856. [DOI] [PubMed] [Google Scholar]
- Xu B-B, Tang Z-L, Chen L, Li J-N, Chai Y-R. Cloning of two flavanone 3-hydroxylase (F3H) genes from oilseed rape (Brassica napus) and their differential expression between black- and yellow-seeded lines. GenBank. 2007. http://www.ncbi.nlm.nih.gov/sites/entrez?term=xu%20tang%20chen%20chai&cmd=Search&db=nuccore&QueryKey=13
- Aguade M. Nucleotide sequence variation at two genes of the phenylpropanoid pathway, the FAH1 and F3H genes, in Arabidopsis thaliana. Mol Biol Evol. 2001;18:1–9. doi: 10.1093/oxfordjournals.molbev.a003714. [DOI] [PubMed] [Google Scholar]
- Gregersen L, Christensen AB, Sommer-Knudsen J, Collinge DB. A putative O-methyltransferase from barley is induced by fungal pathogens and UV light. Plant Mol Biol. 1994;26:1797–1806. doi: 10.1007/BF00019493. [DOI] [PubMed] [Google Scholar]
- Kashkush K, Feldman M, Levy AA. Gene loss, silencing and activation in a newly synthesized wheat allotetraploid. Genetics. 2002;160:1651–1659. doi: 10.1093/genetics/160.4.1651. [DOI] [PMC free article] [PubMed] [Google Scholar]
- Smit WA, Bochkov AF, Caple R. Organic synthesis The science behind the art. Cambridge: The Royal Society of Chemistry Press; 1998. [Google Scholar]
- Gale MD, Flavell RB. The genetic control of anthocyanin biosythesis by homoeologous chromosomes in wheat. Genet Res Camb. 1971;18:237–244. [Google Scholar]
- Sears ER. Nullisomic analysis in common wheat. Amer Nat. 1953;87:245–252. doi: 10.1086/281780. [DOI] [Google Scholar]
- Endo TR, Gill BS. The deletion stocks of common wheat. J Hered. 1996;87:295–307. [Google Scholar]
- Plaschke J, Ganal MW, Röder MS. Detection of genetic diversity in closely related bread wheat using microsatellite markers. Theor Appl Genet. 1995;91:1001–1007. doi: 10.1007/BF00223912. [DOI] [PubMed] [Google Scholar]
- Corpet F. Multiple sequence alignment with hierarchical clustering. Nucl Acids Res. 1988;16:10881–10890. doi: 10.1093/nar/16.22.10881. [DOI] [PMC free article] [PubMed] [Google Scholar]
- Rychlik W, Rhoads RE. A computer program for choosing optimal oligonucleotides for filter hybridization, sequencing and in vitro amplification of DNA. Nucl Acids Res. 1989;17:8543–8551. doi: 10.1093/nar/17.21.8543. [DOI] [PMC free article] [PubMed] [Google Scholar]
- Kumar S, Tamura K, Nei M. MEGA3: integrated software for Molecular Evolutionary Genetics Analysis and sequence alignment. Briefings in Bioinformatics. 2004;5:150–163. doi: 10.1093/bib/5.2.150. [DOI] [PubMed] [Google Scholar]
- Röder MS, Korzun V, Wendehake K, Plaschke J, Tixier M-H, Leroy P, Ganal MW. A microsatellite map of wheat. Genetics. 1998;149:2007–2023. doi: 10.1093/genetics/149.4.2007. [DOI] [PMC free article] [PubMed] [Google Scholar]
- Liao YC, Li HP, Kreuzaler F, Fischer R. Nucleotide sequence of one of two tandem genes encoding phenylalanine ammonia-lyase in Triticum aestivum. Plant Physiol. 1996;112:1398–1398. [Google Scholar]
- Li HP, Liao YC. Isolation and characterization of two closely linked phenylalanine ammonia-lyase genes from wheat. Yi Chuan Xue Bao. 2003;30:907–912. (paper in Chinese). [PubMed] [Google Scholar]
- Yang G, Li B, Gao J, Liu J, Zhao X, Zheng Q, Tong Y, Li Z. Cloning and expression of two chalcone synthase and a flavonoid 3'5'-Hydroxylase 3'-end cDNAs from developing seeds of blue-grained wheat involved in anthocyanin biosynthetic pathway. J Integr Plant Biol. 2004;46:588–594. [Google Scholar]
- Himi E, Noda K. Isolation and location of three homoeologous dihydroflavonol-4-reductase (DFR) genes of wheat and their tissue-dependent expression. J Exp Bot. 2004;55:365–375. doi: 10.1093/jxb/erh046. [DOI] [PubMed] [Google Scholar]
- Munkvold JD, Greene RA, Bermudez-Kandianis CE, La Rota CM, Edwards H, Sorrells SF, Dake T, Benscher D, Kantety R, Linkiewicz AM, Dubcovsky J, Akhunov ED, Dvorák J, Miftahudin , Gustafson JP, Pathan MS, Nguyen HT, Matthews DE, Chao S, Lazo GR, Hummel DD, Anderson OD, Anderson JA, Gonzalez-Hernandez JL, Peng JH, Lapitan N, Qi LL, Echalier B, Gill BS, Hossain KG, Kalavacharla V, Kianian SF, Sandhu D, Erayman M, Gill KS, McGuire PE, Qualset CO, Sorrells ME. Group 3 chromosome bin maps of wheat and their relationship to rice chromosome 1. Genetics. 2004;168:639–650. doi: 10.1534/genetics.104.034819. [DOI] [PMC free article] [PubMed] [Google Scholar]
- Himi E, Osaka T, Noda K. Isolation and characterization of wheat ANS genes. GenBank. 2006. http://www.ncbi.nlm.nih.gov/sites/entrez?term=himi%20osaka%20noda&cmd=Search&db=nuccore&QueryKey=4


