

Abstract
The recent proliferation of novel mass spectrometers such as Fourier-Transform, Qtof and OrbiTrap marks a transition into the era of precision mass spectrometry, providing a two orders of magnitude boost to the mass resolution, as compared to low precision ion-trap detectors. We investigate peptide de novo sequencing by precision mass spectrometry and explore some of the differences when compared to analysis of low precision data. We demonstrate how the dramatically improved performance of de novo sequencing with precision mass spectrometry paves the way for novel approaches to peptide identification that are based on direct sequence lookups, rather than comparisons of spectra to a database. With the direct sequence lookup it is not only possible to search a database very efficiently, but it is also opens the possibility for using the database in novel ways, such as searching for products of alternative splicing or products of fusion proteins in cancer. Our de novo sequencing software is available for download at http://peptide.ucsd.edu/.
Keywords: precision MS, MS/MS, de novo, database search, pattern matching, filtration, FTMS, FT-ICR, LTQ-FT
1 Introduction
In the last decade, tandem mass spectrometry (MS/MS) has emerged as a technology of choice for high-throughput proteomics. The precision and resolution of mass spectrometers are key parameters that draw a line between what is possible and what is impossible in MS/MS-based proteomics today. Instruments like the Quadruple Time-of-flight (QTOF) mass spectrometers are capable of accuracy in the range of a few parts-per-million [1]. Continuous efforts to improve mass resolution recently resulted in the breakthrough development of Fourier transform MS techniques, including magnet-based ion cyclotron resonance (ICR) instruments [2] and electrostatic FT traps (Orbitraps) [3], that improve resolution by two to three orders of magnitude as compared to conventional mass spectrometers. Emergence of precision mass spectrometry heralds a new era in proteomics and makes it possible to address the problems that were previously beyond the reach of traditional MS techniques.
Traditionally, there have been two approaches to peptide interpretation: the database search [4, 5, 6, 7] and de novo sequencing [8, 9, 10, 11, 12, 13, 14, 15, 16, 17, 18, 19]. However, this separation is somewhat artificial since the de novo search can be viewed as a search in the very large database of all possible peptides. In recent years the boundaries between these two methods have started to blur with de novo sequencing being used to generate tags for database filtration [20, 21, 22, 23, 24] and for homology based BLAST like searches [25, 26, 27]. However, using de novo sequencing directly for peptide identification is not widely practiced; low resolution, incomplete fragmentation, and homeometric peptides (which we define below) make de novo approaches less accurate than the database search. Currently even the leading de novo algorithms correctly call only 70-75% of the amino acids [16, 17, 18], with only approximately 30% of all peptides identified without errors (as benchmarked for Lutefisk [8], SHERENGA [9], Peaks [15], and PepNovo in ref. [16]).
With its significantly higher accuracy and resolution, precision mass spectrometry offers the opportunity for superior sequencing performance. However, since precision mass spectrometry is a relatively new area, there is still a shortage of publicly available FT-ICR and OrbiTrap datasets and computational tools geared toward these new instruments. Moreover, accurate de novo sequencing with precison mass-spectrometry remains a challenge. Indeed, previous sequencing approaches for precision mass spectrometry data required particular experimental setups, such as the use of dual fragmentation pathways (CAD/ECD) for de novo sequencing [28, 19]. Other approaches are based on computing amino acid composition [29, 30], thus making them accurate, but rather slow for high-throughput sequencing. Also, these algorithms did not take advantage of the spectrum graphs, the key computational technique behind de novo peptide sequencing. In this paper we apply the powerful spectrum graph techniques to precision mass spectrometry and argue that precision mass spectrometry calls for development of new computational ideas for peptide identification. In particular, we show that the percentage of error-free peptide identifications increases from approximately 30% for traditional MS instruments to 90% for precision mass-spectrometry. Recently, Savitski et al., 2005 [31, 19], proposed a de novo algorithm for a special experimental setup for FT based on complementary fragmentation methods (ECD and CAD). In this work they were able to overcome the problems associated with the incomplete fragmentation of stand-alone CAD and produce accurate peptide reconstructions. Our approach achieves similar accuracy in the standard spectral acquisition mode that is well amenable to high-throughput analysis.
With the current methodology, an MS/MS database search compares every mass spectrum against every peptide in a database (within a specified precursor mass tolerance) so the running time typically scales linearly with the database size and exponentially with the number of post translational modifications (PTMs) considered. This makes comparison of millions of spectra against many peptides computationally prohibitive. Recently developed MS/MS database search tools such as X! Tandem [6] and InsPecT [7] achieve orders of magnitude reduction in the running time of peptide identification by using filtration methods. Using precision mass spectrometry can greatly reduce the computational cost of database searches by taking advantage of the accurate precursor mass measurements to eliminate a larger proportion of the database peptides from consideration.
In this work we demonstrate the feasibility of a different approach to database search, which delivers fast and accurate peptide identification. Our algorithm capitalizes on precision mass spectrometry to generate accurate de novo sequences for each query mass spectrum. These sequences are compared to the database using fast pattern matching (e.g., hash table lookup), as opposed to slow spectra matching. The bulk of our algorithm's analysis is performed by de novo sequencing (that is very fast), so the running time is practically independent of the database size. The difference between the traditional approach and our de novo based approach is illustrated in Figure 1.
Figure 1.

Two approaches to peptide identification. The traditional approach based on comparing spectra to the database (red) vs. our approach based on de novo sequencing and fast database lookup (blue).
Having running time independent of the database size is an important advantage over the traditional MS/MS database search algorithms. However, this advantage is less crucial for traditional database searches with precision MS/MS since the accurate precursor mass serves as a filter to reduce the number of explored variants. More important is an ability to analyze peptides that are not in the database, e.g., alternatively spliced variants, fusion proteins, programmed frame shifts, etc. While traditional database search often fails in such cases (the effective database size in such applications is too high to be explicitly generated), our approach opens a possibility to address them with combinatorial pattern matching algorithms. For example, Tanner et al., 2006 [32] recently succeeded in identifying new alternatively spliced genes via MS/MS analysis. However, the database in this case includes all putative (potentially overlapping) exons in human genome and all putative splice junctions. With our approach, the search for alternative splicing can be reduced to a simple version of spliced alignment problem, a well studied problem in genomics.
2 Methods
2.1 Homeometric Peptides
We first introduce the concept of homeometric peptides that are different peptides with similar theoretical MS/MS spectra, which can induce sequencing errors both with de novo and database search algorithms. We show that homeometric peptides are abundant making it inherently impossible to design an accurate de novo sequencing algorithm that outputs a single peptide as a solution. We therefore argue that peptide sequencing algorithms should output multiple solutions and show how to design such algorithms.
For a peptide P of length k, let be the set of all prefix masses of P, and let be the set of all suffix masses of P plus a mass of 18 Da1. Given a mass tolerance threshold ε and two sets of masses X = {x1,…, xn}, Y = {y1,…, yn}, we say that X ≈ Y, if |xi − yi| < ε for 1 ≤ i ≤ n. We say that a set X does not explain a mass y if |x − y| > ε for every x ∈ X. The distance between sets X and Y is defined as the number of elements in Y not explained by X plus the number of elements in X not explained by Y. Peptides P and Q are called homeometric if i.e., if P's and Q's theoretical spectra are the same (up to a mass tolerance threshold ε). Peptides P and Q are called δ-homeometric if the distance between and , is less than δ, i.e., P's and Q's theoretical spectra are the same up to a mass tolerance threshold ε, except for δ mismatched peaks.
Homeometric peptides are ubiquitous in low precision settings. For instance, there is over a 30% chance that an arbitrary peptide of length 10 has a homeometric peptide (see Figure 3). These percentages grow if we loosen the requirements and consider δ-homeometric peptides for small δ. A simple way to generate δ-homeometric peptides (for δ = 2) is to swap adjacent amino acids in the peptide. However, more subtle instances of homeometric peptides can be created by switching between prefix and suffix vertices in the spectrum graph (see Section 2.2 for a definition of spectrum graphs). Figure 2 (a) shows an illustration of a mass spectrum for the peptide DHGMPF, and part (b) depicts the spectrum graph created from the b- and y-ions of that peptide. The graph contains two paths, the path of prefix masses (blue), and the reverse path of suffix masses (red). However in addition to these paths, there exists a path DFMGSF representing a homeometric peptide that “mixes and matches” prefix and suffix paths. Figure 2 (c) shows a rearranged version of the spectrum graph that gives a better understanding how the path for the homeometric peptide is obtained: The path for the peptide DFMGSF starts at the prefix path, crosses over to the suffix path (using amino acid F), traverses the suffix path (amino acids MG), returns to prefix path (using amino acid S) and continues along the prefix path.
Figure 3.

Probability of homeometric peptides. Random peptides of lengths 5-25 were generated and tested for the possibility of having at least one homeometric peptide (this test was done by generating their spectrum graphs and searching for multiple paths in the spectrum graph). Two mass tolerance settings were tested: 0.5 Da for low resolution and 0.0075 for high resolution.
Figure 2.
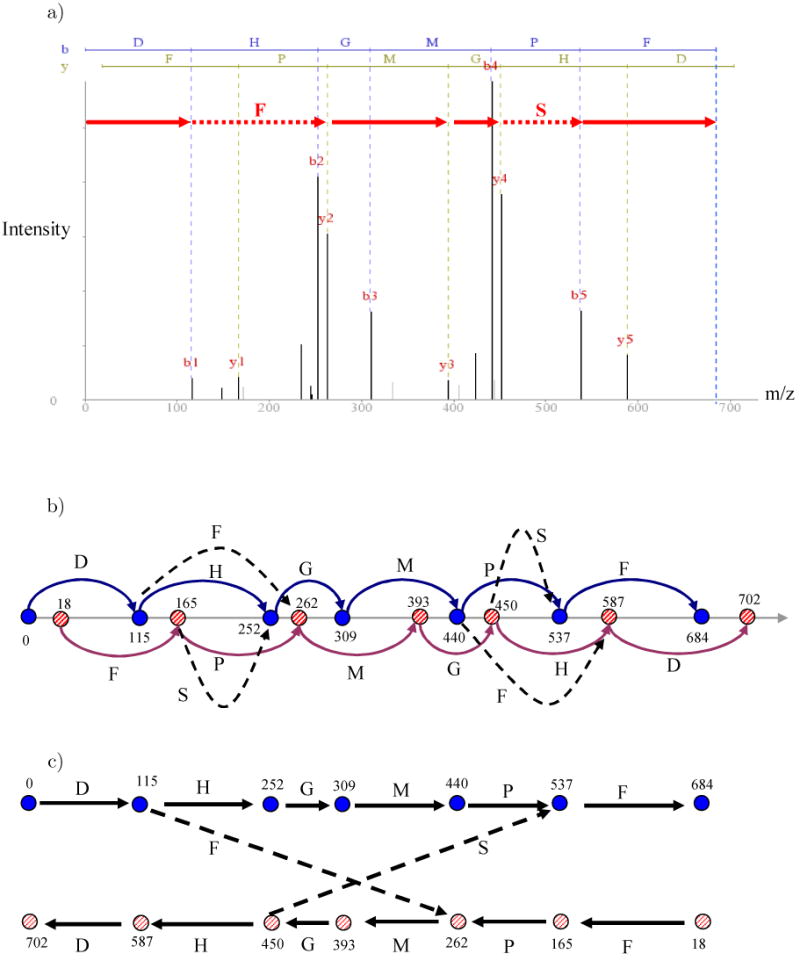
a) Illustration of mass spectrum of DHGMPF, the red path shows the derivation of the peptide DFMGSF which starts with by using b1, crossing over to the y– ladder using y2,y3, and y4, and then returning to the b–ions to b5. b) The spectrum graph derived from the mass spectrum of DHGMPF. c) The same spectrum graph with vertices rearranged to show the relationship between the paths of the homeometric peptides DHGMPF and DFMGSF. The top path (0,115,252,…) represents prefix masses while the bottom path represents suffix masses of DHGMPF (the masses are rounded off to integer values).
Figure 2 illustrates that the key for having homeometric peptides is a pair of crossover edges between the prefix and suffix paths' vertices (these crossover edges also lead to symmetric paths for which the antisymmetric peptide sequencing algorithms were developed [12].) As observed by Budnik et al., 2002 [33], the crossover edges are quite common, making the confident de novo sequencing of many peptides impossible.
2.2 De novo Peptide Sequencing With Precision Mass Spectrometry
De novo peptide sequencing is a fast alternative to the database search (although in most cases it produces less accurate results [16]). Most de novo algorithms model all possible peptides as paths in a spectrum graph, a directed acyclic graph with vertices corresponding to putative prefix masses (cleavage sites) of the peptide [34, 9]. Two vertices are connected by a directed edge from the vertex with the lower mass to the one with a higher mass if the difference between them equals the mass of an amino acid. Dancik et al., 1999 [9] describe in detail the construction and scoring of the spectrum graph. Since peptide fragmentation is often incomplete, the spectrum graph may be disconnected. For this reason we add edges corresponding to masses of pairs (triples, etc.) of amino acids. With the high resolution of FTMS we can use edges of up to three amino acids (which compensate for up to two consecutive missing backbone cleavages) without significant increase in computational complexity.
De novo algorithms attempt to find a peptide P that maximizes the probability of generating the query spectrum (under a certain probabilistic model). Dancik scoring [9] is based on a rigorous probabilistic model for computing this probability from fragment ion propensities defined in Table 2. The model we use implements two simple extensions to their basic scoring model. The first extension incorporates peak ranks into the scoring model. The second extension is to add the modeling of dependencies between fragments using the probabilistic model of the PepNovo algorithm [16].
Table 2.
Information on ion types learned form 376 FT-ICR spectra of doubly charged peptides using the offset frequency function [9]. Note that the probability of observing a peak at random is 0.001. (a) the offset is relative to the mass of the respective prefix or suffix peptide (for doubly charged fragments, the offset is relative to half the mass of the prefix or suffix peptides). (b) the mass difference between the offset determined by the offset frequency function and the true mass of the fragment. (c) the number of observed fragment peaks vs. the number of possible positions at which the fragments could be detected. (d) the number of spectra which have at least 1 occurrence of the peak (maximal number 376). (e) These are “phantom” fragments due to harmonics of intense peaks [35].
| Ion | Offset (a) | Δ (b) | # Peaks (c) | # Spectra (d) | Probability |
|---|---|---|---|---|---|
| y | 19.020 | 0.002 | 2245/2792 | 376 | 0.804 |
| b | 1.006 | -0.002 | 1934/2806 | 374 | 0.689 |
| b − H2O | -17.005 | -0.002 | 777/2744 | 264 | 0.283 |
| y/2 (e) | 9.508 | -0.001 | 508/2359 | 293 | 0.215 |
| y − H2O | 1.005 | -0.003 | 312/2360 | 211 | 0.132 |
| y+2 | 10.012 | -0.001 | 316/2448 | 215 | 0.129 |
| b − NH3 | -16.021 | -0.002 | 253/2746 | 119 | 0.092 |
| a | -26.988 | -0.001 | 205/2706 | 144 | 0.076 |
| [y − H2O]+2 | 1.006 | -0.002 | 156/2246 | 127 | 0.070 |
| [y − H2O − H2O]+2 | -7.998 | 0.000 | 142/2189 | 134 | 0.065 |
| b − H2O − H2O | -35.015 | -0.002 | 119/2661 | 60 | 0.045 |
| y − NH3 | 1.989 | -0.003 | 110/2689 | 79 | 0.041 |
| [y − H2O − NH3]+2 | -7.507 | -0.001 | 75/2192 | 73 | 0.034 |
| b/2 (e) | 0.503 | -0.001 | 64/2139 | 42 | 0.030 |
| b − H2O − NH3 | -34.031 | -0.002 | 71/2663 | 42 | 0.027 |
| a − NH3 | -44.015 | -0.002 | 42/2652 | 38 | 0.016 |
| a − H2O | -44.999 | -0.001 | 32/2650 | 25 | 0.012 |
| [y − NH3]+2 | 1.498 | -0.001 | 23/2248 | 20 | 0.010 |
| b+2 | 1.006 | -0.002 | 14/2146 | 12 | 0.007 |
| b − NH3 − NH3 | -33.047 | -0.002 | 17/2664 | 11 | 0.006 |
| y − H2O − H2O | -17.007 | -0.004 | 12/2673 | 11 | 0.005 |
| y − H2O − NH3 | -16.022 | -0.003 | 10/2676 | 10 | 0.004 |
|
| |||||
| Internal+H | 1.005 | -0.003 | 227/10841 | 144 | 0.021 |
| Internal+H − H2O | -17.005 | -0.002 | 125/10345 | 84 | 0.012 |
| Internal+NH2 + H2O | 34.027 | 0.002 | 112/11633 | 92 | 0.010 |
Considering peak intensities improves scoring, since high intensity peaks are likely to represent y and b ion fragments. However, large variance in the absolute peak intensities exhibited in mass spectra makes it difficult to account for them in a framework of a rigorous probabilistic model. For this reason, peak intensities need to be normalized before being scored. From our experience, using the peaks' relative ranks in the spectrum, rather than their actual absolute intensities, gave optimal results in the scoring we used (compare to Tanner et al., 2005 [7]). We incorporated the peak ranks into the Dancik scoring using the distribution of peak ranks according to the fragment types as defined in Table 1 (see Section 3.1 for further details on the selection of these fragment types).
Table 1.
Distribution of peak ranks according to fragment ions. Statistics were collected from 376 FT-ICR spectra of unique doubly charged peptides. We grouped peak ranks into a small set of 8 rank levels as follows: I) the peak ranked 1, II) ranks 2-3, III) ranks 4-7, IV) ranks 8-12, V) ranks 13-20, VI) ranks 21-30, VII) ranks 31-55, VIII) ranks 56-∞.
| Ion | Peak Ranks | |||||||
|---|---|---|---|---|---|---|---|---|
| 1 | 2-3 | 4-7 | 8-12 | 13-20 | 21-30 | 31 - 55 | 56 - ∞ | |
| y | 0.838 | 0.702 | 0.365 | 0.187 | 0.100 | 0.060 | 0.040 | 0.010 |
| b | 0.066 | 0.102 | 0.265 | 0.300 | 0.181 | 0.098 | 0.066 | 0.020 |
| b − H2O | 0.005 | 0.019 | 0.047 | 0.063 | 0.088 | 0.089 | 0.061 | 0.010 |
| y/2 | 0.000 | 0.008 | 0.033 | 0.029 | 0.050 | 0.067 | 0.054 | 0.061 |
| y − H2O | 0.003 | 0.007 | 0.021 | 0.030 | 0.043 | 0.045 | 0.035 | 0.040 |
| y+2 | 0.019 | 0.040 | 0.035 | 0.029 | 0.029 | 0.024 | 0.015 | 0.020 |
| b − NH3 | 0.000 | 0.003 | 0.013 | 0.024 | 0.027 | 0.026 | 0.029 | 0.020 |
| a | 0.000 | 0.004 | 0.007 | 0.020 | 0.023 | 0.020 | 0.023 | 0.030 |
| [y − H2O]+2 | 0.003 | 0.004 | 0.015 | 0.016 | 0.014 | 0.016 | 0.014 | 0.030 |
| [y − H2O − H2O]+2 | 0.005 | 0.009 | 0.013 | 0.014 | 0.016 | 0.013 | 0.007 | 0.020 |
| b − H2O − H2O | 0.000 | 0.003 | 0.004 | 0.005 | 0.009 | 0.015 | 0.025 | 0.020 |
| y − NH3 | 0.000 | 0.003 | 0.003 | 0.010 | 0.014 | 0.009 | 0.015 | 0.010 |
| [y − H2O]+2 | 0.000 | 0.003 | 0.005 | 0.011 | 0.009 | 0.005 | 0.004 | 0.000 |
| b/2 | 0.000 | 0.000 | 0.001 | 0.004 | 0.004 | 0.008 | 0.015 | 0.020 |
| b − NH3 − H2O | 0.000 | 0.000 | 0.001 | 0.002 | 0.007 | 0.010 | 0.014 | 0.000 |
| a − NH3 | 0.000 | 0.000 | 0.003 | 0.002 | 0.004 | 0.006 | 0.007 | 0.010 |
| a − H2O | 0.000 | 0.001 | 0.000 | 0.003 | 0.004 | 0.004 | 0.005 | 0.000 |
| [y − NH3]+2 | 0.000 | 0.000 | 0.001 | 0.002 | 0.003 | 0.003 | 0.004 | 0.000 |
| b − NH3 − NH3 | 0.000 | 0.001 | 0.000 | 0.002 | 0.001 | 0.003 | 0.003 | 0.000 |
| b+2 | 0.003 | 0.003 | 0.002 | 0.003 | 0.003 | 0.005 | 0.004 | 0.010 |
| y − H2O −NH3 | 0.000 | 0.000 | 0.000 | 0.003 | 0.002 | 0.001 | 0.004 | 0.000 |
| y − H2O − H2O | 0.000 | 0.000 | 0.002 | 0.001 | 0.001 | 0.004 | 0.001 | 0.000 |
| Unexplained | 0.059 | 0.089 | 0.164 | 0.241 | 0.365 | 0.470 | 0.552 | 0.667 |
|
| ||||||||
| Total | 1.0000 | 1.0000 | 1.0000 | 1.0000 | 1.0000 | 1.0000 | 1.0000 | 1.0000 |
The Dancik scoring models different fragment ions as independent random variables. In practice, this assumption is often violated, for example, the variables corresponding to b- and y-ions are highly correlated. We used the probabilistic network structure of the PepNovo algorithm [16] to incorporate such fragment correlations into our scoring model.
Our de novo sequencing algorithm finds the highest scoring path in the spectrum graph in time linear in the number of edges2. Since the path may contain double and triple edges we define it as a correct reconstruction if all vertices in the path correspond to correct cleavages in the peptide. As a result our reconstruction represent amino acid sequences with gaps corresponding to masses of double and triple edges in the spectrum graph.
The gapped peptide P found by our algorithm is correct for 90% of spectra (see Table 3). However, in most of the remaining 10% of spectra the optimal path uses a single incorrect vertex, thus indicating that the optimal path usually comes close to the path representing the correct solution and represents a δ-homeometric peptides for a small δ. Since the difference in score between the optimal path and the correct solution is usually small, we advocate the search for suboptimal paths in the spectrum graph as potential peptide reconstructions. We empirically found a bound σ for the maximal score difference between the highest scoring optimal path and the correct suboptimal path (σ was set to the maximum score difference found in our training data). Using this threshold, we can remove all vertices from the spectrum graph that do not participate in any σ–suboptimal path. These vertices are found in linear time by using dynamic programming to compute the highest scoring paths from the source vertex (vertex corresponding to mass 0) to each vertex v and from each vertex v to the sink (vertex corresponding to the precursor mass). After summing up these values and removing vertices for which the resulting score is deficient by more than σ, we are left with very small spectrum graphs (typically 50% of vertices are removed, leaving about 20 vertices per 1000 Da of mass). These filtered graphs contain a smaller number of paths, that can be generated by a depth-first search that prunes paths that cannot lead to σ–suboptimal solutions.
Table 3.
Correctness of De novo paths and number of generated peptides. The highest scoring de novo paths were generated for 376 mass spectra of doubly charged tryptic peptides, de novo path were generated. The table contains the percentage of spectra for which at least one of the k highest scoring paths (k = 1, 5, 10) is correct along with the number of unique peptides that were generated from those paths for the database lookup. The statistics are given for paths derived from spectrum graphs without PTMs, and for graphs containing 10 types of PTMs with the paths allowed to include only 1 or 2 PTM instances.
| # De Novo Paths Used | No PTMs | 10 PTMs / 1 allowed | 10 PTMs / 2 allowed | |||
|---|---|---|---|---|---|---|
| % Correct | # Peptides | % Correct | # Peptides | % Correct | # Peptides | |
| 1 | 90.4 | 4.4 | 86.2 | 7.9 | 85.9 | 10.7 |
| 5 | 97.3 | 33.7 | 96.0 | 58.0 | 96.0 | 76.9 |
| 10 | 98.4 | 74.4 | 97.1 | 119.9 | 97.1 | 162.2 |
2.3 Peptide identification Using De Novo Sequences
Most database search algorithms follow a canonical approach in which the query spectrum is compared to every database peptide (within a given mass tolerance). Precision mass spectrometry offers the opportunity to forgo this (potentially) time-consuming approach. We show how de novo sequencing enables a fast database search program that does not involve comparison of spectra to database peptides and has running time that is practically independent of the database size and the number of PTMs being searched.
In a sense, the approach we present below extends the idea of filtration [24, 7], by capitalizing on the high precision of FT-ICR to create longer and more accurate gapped tags. Our algorithm consists of two stages. In the first stage, we generate de novo peptide reconstructions which are used in the second stage, the database lookup.
Our algorithm works as follows. Given a query spectrum, we generate the top k de novo reconstructions (gapped peptides), as described in Section 2.2. Typically a value of k = 10 will suffice to have a 98% retrieval rate from the database (see Table 3). We then proceed to use the gapped de novo peptide reconstructions for the database lookup. While searching the database with a gapped peptide P is already much faster than the spectrum vs. database scan performed by algorithms such as Sequest [4] or Mascot [5], we further speed up the search and forgo the database scan altogether. This is achieved by filling gaps in P with all possible combinations of amino acids and further searching database with the resulting set P* of continuous amino acid strings. This can be done instantly if the database is preprocessed, such as using a hash table or suffix tree (checking if P* is present in a hash table typically requires a single read to memory). Note that these indexed database need to be created only once, and this too can be done relatively quickly (creating a hash table for a large sequence file takes only several seconds).
In practice it does not make sense to query the database with peptides longer than 8 amino acids since spurious database hits of such length have negligent probability. Therefore if P* contains sequences longer than 8 amino acids, we include in P* sequences of length 8 that are generated from the sub-path of P with the minimal number of possibilities to fill its gaps. When the generated sequences do not span the entire mass range of the original peptide, we take note of the distance from the N –terminal to mass of the vertex at the beginning of the sequences' path, and the distance from the end of the path to the C –terminal similarly to InsPecT algorithm [7]. These mass offsets are very useful for filtering spurious database hits since most random hits to the database will not have flanking sequences that can lead to a successful extension to the correct N- and C-terminal masses.
2.4 MS/MS Data
Our data set contains 376 MS/MS spectra of doubly charged tryptic peptides that were generated by an Agilent 1100 nanoflow system coupled to a 7-tesla hybrid linear ion trap Fourier transform mass spectrometer (LTQ-FT, Thermo Electron Corp., Bremen, Germany), see ref [31] for further details on the experimental protocol. The spectra were pre-processed to remove isotopic peaks, and have relatively few noise peaks (the average peak density was 30 peaks per 1000 Da of mass). All spectra were identified by Mascot [5] with high confidence, and had sufficient fragmentation to support a gapped peptide of at least 6 amino acids. The spectra belonged to peptides with lengths in the range 6-25 amino acids, with an average length of 11.1. Since the mass resolution of FT-ICR is very high, we used a mass tolerance of 0.0075 Da (i.e., we identify a peak if it falls within margin of 0.0075 Da from its expected position). Even with such a narrow tolerance 95% of the b– and y– ions that are present in the spectrum are identified. Such a narrow tolerance represents almost one hundred-fold improvement in resolution compared to regular ion-trap LTQ.
3 Results
3.1 Fourier Transform Mass Spectrometry and Peptide Fragmentation
An investigation of our dataset reveals that FT-ICR can be used to gain new insights into peptide fragmentation. Since collision-activated dissociation (CAD) was performed by an LTQ mass spectrometer we expect to find the typical abundant fragments such as y– and b–peaks and their derivatives [9, 36, 37, 16]. However, with FT-ICR it is possible to detect rare ion-fragments, which could not be identified with lower resolution instruments since they would be indistinguishable from noise (see for example analysis on similar data with low resolution instruments [38]). Therefore, instead of analyzing the data in the validation mode, where one tests whether the already known ion fragments are present in MS/MS spectra, we first analyzed our dataset in the discovery mode that allows one to discover new unsuspected fragment ions and evaluate their propensities. We used the offset frequency function [9], which finds recurring mass offsets in the spectra which help to identify the types of ion fragments that are present.
Table 2 lists fragment ions present in FT-ICR mass spectra and highlights the advantages of precision mass spectrometry: some of fragment ions in Table 2 are not detectable on standard instruments due to low signal-to-noise ratio. With such instruments the probability of observing a random noise peak is approximately 0.1 so most peaks would be virtually indistinguishable from the noise. All offsets included in the table have a probability which is much greater than the probability 0.001 of observing a noisy peak3, so these offsets are likely to represent fragmentation products. We emphasize that all these ion-fragments can contribute to the ability of de novo algorithms to recover the correct sequence. Even phantom fragments4 can help by identifying the charge states of their singly charged counterparts. Additional information on the relative intensity rank of the fragment ions is relayed in Table 1.
Due to the data's high accuracy and resolution, we were able to identify many internal fragments in addition to the standard single fragmentation ion products. We can also use FT-ICR to automatically derive the “fragmentation rules” for internal ion fragments (e.g., N–terminal of Proline and Glycine turned out to be preferred cleavage sites involved in the formation of internal fragments.) Such fragments, which cannot be reliably identified by low resolution instruments, can play a role in the scoring and validation of peptide identifications.
3.2 Homeometric Peptides
We ran several experiments to evaluate the phenomenon of homeometric peptides. Figure 3 shows the results of an experiment in which 10000 random peptides of various lengths were generated and tested to see if they have homeometric peptides. Two mass tolerance settings were tested: 0.5 Da. which is typical for low resolution ion-trap instruments, and a narrower tolerance of 0.0075 Da. used with high resolution FT-ICR. Figure 3 shows that the larger the tolerance, the more likely the occurrence of homeometric peptides. Thus, while homeometric peptides are quite common with a large mass tolerance of 0.5 Da., Figure 3 shows an average 20-fold reduction in the number of homeometric peptides when the tolerance is narrowed to 0.0075 Da.
Homeometric peptides do not only complicate de novo sequencing, they also limit the ability of database searches to make confident identifications. We conducted simulations to test how homeometric peptides affect database searches (Homo Sapiens protein sequences from NCBI release 35 with 16.8M amino acids) under low and high precision settings (mass tolerances 0.5 and 0.0075 Da., respectively). We examined randomly selected peptides of various lengths and determined their distance from the other peptides in the database. Each peptide was compared with all other peptides in the database whose precursor mass was within a specified margin from the precursor mass of the original peptide. For the tolerance of 0.5 we used a precursor mass margin of 1 Da, which yielded on average 300000 database peptides, and with the tolerance of 0.0075 we used a precursor mass tolerance of 0.015 Da yielding an average of 4500 database peptides. Since in practice the mass spectra of a peptide P does not contain peaks from all the peptide's expected cleavages, we also report results for the peptide distances when the peaks of randomly selected cleavages were removed from P's set of expected masses (we report results for 0-4 missing cleavages).
Figure 4 presents the results for peptides of lengths 7, 14, and 21 amino acids. The top portion of the figure shows the results for low precision (tolerance 0.5 Da), and the bottom portion shows the results for high precision (tolerance 0.075 Da). Short peptides often have δ-homeometric peptides in the database for small δ (especially when the larger tolerance is used). The probability of having a homeometric peptide grows dramatically when some of the cleavages are missing. This explains scenarios in which database search tools cannot make conclusive identifications because there are several likely candidates (e.g., when Sequest [4] has several peptides with a high Xcorr, but the resulting ΔCn is low). Every pair of homeometric peptides creates a pair of “black holes” in the database - peptides that cannot be reliably identified even from high quality spectra. The probabilities of homeometric peptides in the high precision setting are significantly smaller. There are several reasons why this happens. First, the narrower tolerance restricts the creation of random spurious edges in the spectrum graph. In addition, using a narrow tolerance helps to resolve ambiguities due to the possible overlap of the integer masses of b- and y-ions, including overlap of their isotopic distributions. For instance, if monoisotopic masses are different by 1 or 2 Da, the overlap will still occur in low-resolution instruments, and the two ions will not be resolved. Finally, the narrower precursor mass tolerance means there are much fewer peptides in the database that have the potential to be homeometric (the number of these drops from 300000 with the precursor mass tolerance of 1 Da to 4500).
Figure 4.

Probability that a database contains homeometric peptides. Random peptides were selected from a sequence database of 16.8 million amino acids and searched against the entire database to detect their closest δ-homeometric counterparts. Two tolerance settings where used: the top shows results for a tolerance of 0.5 Da, which models low precision data, the bottom shows results for a tolerance of 0.0075 Da, which models high precision data. The results are shown for random peptides of lengths 7, 14, and 21, and for various numbers of missing cleavages.
3.3 De Novo Sequencing with Precision MS
We ran de novo benchmark tests on our dataset of 376 spectra in order to evaluate our de novo algorithm's performance. Table 3 shows the probability that the set of k highest-scoring suboptimal paths contains the correct path. By considering more than a single path, the probability that a correct path was extracted grows from 90.4% using a single path, to 98.4% using 10 paths. The table contains statistics both for regular spectrum graphs (20 amino acids) and spectrum graphs that were constructed using 10 simulated PTMs (which effectively raises the number of amino acids used to construct the graph to 30). As customary [39, 6, 7] we restrict the number of PTMs in a peptide to either 1 or 2.
With the spectrum graphs that were constructed with 10 PTMs there are slightly lower success rates due to the larger number of edges that lead to more spurious paths. Naturally, there is a cost for considering more than a single de novo path and the tradeoff is an increase in the number of candidate peptides that need to be looked up in the database (the larger the number of peptides that are used, the bigger the chance of having a spurious database hit.) While a single path, on average, generates 4.4 continuous peptide sequences, 10 paths generate 74.4 peptides. The number of peptides generated for paths from spectrum graphs with PTMs is higher since the PTMs offer more possibilities to fill the gapped paths. We remark that verifying 100 peptides against a database hardly leads to any increase in the overall running time as compared to matching a single peptide since the database is pre-indexed (e.g., with a hash table) and such matching takes a very small fraction of the overall running time.
It is worth mentioning that when compared to the results in Table 3, using our de novo approach on data from lower resolution ion-trap mass spectrometers (with a tolerance of 0.5 Da.), the results were much inferior. In a benchmark on a test set of ion-trap spectra of tryptic peptides [16] that did not consider PTMs, the top de novo path was only correct for 30% of the spectra, while the probability that one of the top 10 scoring paths was correct was only 52%. Such low accuracy would cause many missed identifications and therefore precludes the application of our novel peptide identification approach on data from low resolution instruments.
Table 4 shows all peptides for which the set of the top 10 highest scoring paths in the spectrum graph did not contain a correct path. These peptides point to a somewhat less reliable Mascot scores or even potential errors in original Mascot identifications. For instance, for peptide SIAVSIPR (first row), the top de novo reconstruction VATVSLPR, which comes from the protease trypsin, “explains” the spectrum significantly better than the Mascot database hit (de novo reconstruction explains 20 out of 43 spectrum peaks, whereas the Mascot identification explains only 17 out of 43 peaks).
Table 4.
Peptides which were not covered by the 10 highest scoring paths. The table displays the true peptides, and the peptides corresponding to the highest scoring paths in the spectrum graphs, along with the number of their supporting peaks in the spectrum. The “.” symbol represents a cleavage which has supporting peaks in the spectrum.
| Mascot Peptide | Top Ranked Path | |||
|---|---|---|---|---|
| # | Peptide | # Peaks | Peptide | # Peaks |
|
| ||||
| 1 | SI.A.V.S.L.PR | 17/43 | V.A.T.V.S.L.PR | 20/43 |
| 2 | GSL.GGG.FSS.G.G.F.S.G.GS.FSR | 29/38 | [314.17] .G.G.F.S.S.G.W.S.G. [1136.49] | 27/38 |
| 3 | RID.IT.L.S.S.V.K | 10/37 | [198.16] A.A.L.DMV.S.V.K | 9/37 |
| 4 | LAPITSD.P.TE.AT.A.V.G.A.V.EASFK | 20/46 | [394.27] .T.S.D.Q.HHP.A.V.Q.QT.LYR | 13/46 |
| 5 | IR.E.E.Y.PD.R | 9/26 | R.L.E.E.S.NSS.R | 10/26 |
| 6 | FNIS.N.G.G.PA.PE.AITDK | 19/48 | [373.21] .S.D.G.G.QKW.H.T. [1369.66] | 21/48 |
3.4 Random database hits and extensions
We first wanted to determine the feasibility of using de novo sequences for direct lookup in a database, in particular we wanted to determine how likely we are to have random database hits and successful extensions of the sequence to the N- and C-terminals. We tested our approach on the set of 376 test spectra described above. While these test spectra did not contain PTMs, we simulated searches that consider PTMs by adding the PTM edges to the spectrum graphs. Table 5 contains statistics on the tendency to have random hits and successful extensions with a large 50M database. When the spectrum contains peaks from a peptide that fragmented well and the generated de novo paths are quite long (≥ 8 amino acids), the chances of a random database hit become very low. The situation is different when the candidate sequences are short; they can generate several database hits for consideration. When such a hit is found, we attempt to extend it to a full match by finding in the database flanking sequences which match the prefix and suffix masses. Given the narrow mass margins that are tolerated with our data, it is unlikely that an incorrect database hit can be extended correctly.
Table 5.
Expected number of random database hits and successful extensions. The table shows the expected number of times in which a single peptide sequence has a random database hit and a random hit that is successfully extended to obtain a complete peptide match. The experiments were run using a sequence database of 50 million amino acids. Data was collected for peptides of lengths 6-8 amino acids, and under two types of de novo searches, the regular search, and a search that considered 10 PTMs. The data was collected on a training set of 376 mass spectra of doubly charged tryptic peptides.
| DB
Size |
Sequence
Length |
No PTMs | 10 PTMs 1 allowed | 10 PTMs 2 allowed | |||
|---|---|---|---|---|---|---|---|
| E[ #hits ] | E[ #ext ] | E[ #hits ] | E[ #ext ] | E[ #hits ] | E[ #ext ] | ||
| 50 M | 6 | 2.1 | 0.0075 | 2.37 | 0.017 | 2.44 | 0.024 |
| 7 | 0.139 | 0.0025 | 0.164 | 0.0054 | 0.174 | 0.0076 | |
| 8 | 0.012 | 0.0003 | 0.016 | 0.0007 | 0.018 | 0.0011 | |
Table 5 shows an approximate reduction of two orders of magnitude between the probability of a database hit and the probability of a successful extension of that hit (the reduction is higher for shorter peptides because they have a higher rate of extensions occurring simultaneously towards the N–terminal and the C–terminal.) When PTMs are involved in the search, they offer more opportunities both for database hits and especially, many more possibilities to form correct extensions which is why the searches with PTMs have higher rates of false matches.
Table 5 also highlights some of the complications that occur dealing with short peptides (length 6-7 amino acids). Even with precision mass spectrometry, many algorithms cannot confidently identify them when searching a large database without using additional information (such as knowing that the protein in question had previous identifications with other mass spectra). In such cases it is advisable to minimize the probability of the algorithm returning a false identification. This can be done by either reducing the database size, using a small number of de novo reconstructions (possibly one), or limiting the search to non modified peptides.
3.5 Database search
For the sake of simplicity we used a slightly naïve approach towards the implementation and testing of the database search. For each mass spectrum we used our de novo algorithm to generate a set P* of amino acid sequences (as described in Section 2.3). The sequences P* were sorted in a decreasing order of their de novo scores and submitted for database lookup in that order. The first sequence that had a database hit and could be successfully extended to the N– and C– terminals, was returned by the algorithm as the spectrum's identification (and the search terminated). If no such peptide was found, the algorithm terminated indicating that it could not find a peptide for the spectrum in the database.
Table 6 contains results of our benchmark experiments in which we applied the afore-mentioned procedure to our set of 376 spectra5. As could be expected, the more de novo reconstructions are used, the larger the proportion of correct identifications (true positives) since the set of de novo reconstructions is more likely to contain a correct sequence (see Table 3). Note that in any case, even a small set of 5 de novo reconstructions is sufficient for identifying correctly over 97% of the spectra. Since the database is searched with relatively long peptide sequences, there are very few spurious hits. However, the larger the database being searched, the larger the proportion of false positives we observe. This increase is due to spurious database hits of de novo reconstructions with a higher score than the correct sequence's score. It is likely that a less naïve approach that implements validation of the results via a scoring function would eliminate many of these false positives.
Table 6.
Peptide identification results for 376 mass spectra. The experiments measured the success rate of our algorithm under different conditions: various sequence database sizes (0.5 million, 5 million, and 50 million amino acids), different numbers of de novo paths (1,5,10), and three types of searches (without PTMs, a search that simultaneously considers 10 types of PTMs but allows at most one modified amino acid in the peptide, and a search that considers 10 PTMs but allows up to two modified amino acids). The results are shown in terms of: TP - true positives (correct identifications made by the algorithm), FP - false positives (erroneous peptide identifications made the algorithm), and FN - false negatives (instances in which the algorithm did not return any peptide identification).
| Decoy DB Size | # De Novo Paths | No PTMs | 10 PTMs / 1 allowed | 10 PTMs / 2 allowed | ||||||
|---|---|---|---|---|---|---|---|---|---|---|
| % TP | % FP | % FN | % TP | % FP | % FN | % TP | % FP | % FN | ||
| 0.5 M | 1 | 0.904 | 0 | 0.096 | 0.862 | 0 | 0.138 | 0.859 | 0 | 0.141 |
| 5 | 0.973 | 0 | 0.027 | 0.960 | 0.003 | 0.037 | 0.960 | 0.003 | 0.037 | |
| 10 | 0.984 | 0 | 0.016 | 0.971 | 0.003 | 0.026 | 0.971 | 0.003 | 0.026 | |
|
| ||||||||||
| 5M | 1 | 0.904 | 0 | 0.096 | 0.857 | 0.005 | 0.138 | 0.854 | 0.005 | 0.141 |
| 5 | 0.971 | 0.003 | 0.026 | 0.952 | 0.013 | 0.035 | 0.949 | 0.016 | 0.035 | |
| 10 | 0.981 | 0.003 | 0.016 | 0.960 | 0.013 | 0.026 | 0.955 | 0.019 | 0.026 | |
|
| ||||||||||
| 50 M | 1 | 0.888 | 0.019 | 0.093 | 0.862 | 0.045 | 0.093 | 0.851 | 0.045 | 0.104 |
| 5 | 0.952 | 0.021 | 0.027 | 0.920 | 0.059 | 0.021 | 0.915 | 0.056 | 0.029 | |
| 10 | 0.963 | 0.021 | 0.016 | 0.920 | 0.059 | 0.021 | 0.920 | 0.059 | 0.021 | |
4 Conclusion
Precision mass spectrometry, such as FT-ICR, opens the door to improved proteomics analysis and novel algorithms. For instance, with the increased mass resolution of FT-ICR we were able to detect many more types of fragment ions that would typically be statistically indistinguishable from noise with lower resolution ion-trap instruments. Even more important is the fact that precision MS helps to eliminate problems that hinder the analysis of data from low resolution instruments. We explored the phenomenon of homeometric peptides (different peptides with nearly identical sets of b– and y–peaks) that severely limits de novo sequencing with low precision data. With high precision data homeometric peptides are extremely rare, making peptide sequencing accurate. There have been recent computational techniques that can solve the problem of homeometric peptides by separating b- and y- ladders using a combination methods such as correlating between MS2 and MS3 spectra (Zhang and McElvain, 2000 [10]), or using complementary fragmentation techniques, such as CAD and ECD (Savitski et al., 2005 [31].) Bern and Goldberg, 2005 [17] used an optimization approach aimed at achieving this separation, while Bandeira et al., 2006 [40] used pairs of spectra (e.g., from a modified and unmodified version of the same peptide) to separate b- and y-ladders. Our analysis above shows that in most cases the high accuracy and resolution of FT-ICR alone can eliminate most of the problems caused by homeometric peptides, without the need for additional data required by previous approaches [10, 31, 40].
In this work we demonstrated the feasibility of a new approach to database search which relies on direct lookup of sequences in the database, as opposed to the standard methodology that compares a query mass spectra to peptides from a database. Even using a naïve approach to validation of search results, our method was bale to identify correctly 96% of the test spectra when searching a 50MB database. Our algorithm uses rapid de novo sequencing and replaces the traditional database scan with a direct sequence lookup in a pre-indexed database. It is capable of rapidly identifying peptides even when searching large databases and considering PTMs. The high precision of FT-ICR is necessary for our method's success, since de novo peptide sequencing with low precision data is not accurate enough.
Our approach can be viewed as an extremely efficient database filtration method. Previous filtration approaches to MS/MS database search used only short sequence tags (typically 3 amino acids long), so they need to consider many database hits and select the best one [20, 21, 22, 23, 24]. However, our predicted de novo sequences are much longer, so they have very few spurious hits in the database. Thus most of the database comparison in our method amounts to the evaluation of a single database hash hit since typically only the de novo sequence representing the correct peptide will have a database match. Our benchmark results demonstrate the feasibility of using de novo sequencing of precision MS data as the key component for a database search. The high accuracy of the de novo sequencing leads to a very small fraction of missed identifications. Since there is a very low rate of spurious database hits, there will not be many false database hits competing with the correct hit, which can simplify the task of a scoring function to determine the single correct hit.
The idea of peptide identification by means of sequence lookup can be expanded to scenarios that are not addressed adequately with the current database search tools, such as identifying peptides that are products of alternative splicing or fused genes. A simple method for identifying such peptides could be to split each de novo sequence S = s1s2 … sn into pairs of the form S′ = s1… sk and S″ = sk+1… sn, and to lookup S′ and S″ in the database. Finding hits for S′ and S″ in different proteins can raise the possibility that the query spectrum belongs to a peptide that is a product of fused genes, while finding hits for S′ and S″ in the same protein can indicate that the peptide is a product of alternative splicing.
Our de novo sequencing algorithm typically requires 0.05 seconds per spectrum. Since the peptide identification relies heavily on the de novo stage, its runtime scales well when the database size is increased and PTMs are added to the search. For instance, while searching against a 0.5M database without considering PTMs takes about 0.06 seconds per spectrum, this grows to approximately 0.2 seconds per spectrum when searching against a 50M database and considering 10 different PTMS. This 3-fold increase in run-time is much smaller than the more than 100-fold increase that would be incurred by traditional database search programs, whose runtime typically increases linearly with the increase in database size and exponentially with the number of PTMs simultaneously considered. Having run-time that is practically independent of database size is essential for an efficient implementation of the advanced database searches such as the ones described above. The effective database size being searched can grow dramatically if one wants to consider all possible peptides that could be products of alternative splicing or fusion proteins (the latter effectively squares the number of peptides that need to be considered). The traditional approaches which compare spectra to database sequences would incur a hefty increase to the run-time due the extreme growth in the effective database size, while our novel approach which relies on hash table sequence lookups would be much more resilient.
Error tolerant homology searches [25, 41, 26, 27] are another avenue through which we can benefit from the high performance of de novo sequencing of precision mass spectrometry data. Due to the high rate of de novo sequencing errors encountered with low precision data, there are many cases in which matches are missed by such algorithms because the de novo sequences vary too much from the spectrum's correct peptide, even though that peptide (or a close homologue) are present in the searched database.
The accurate de novo sequencing of precision mass spectrometry data can also be used to flag spectra for further investigation. For instance, if a spectrum returns no database hit but has high scoring de novo reconstructions, it is very likely that the spectrum belongs to a real peptide that is not present in the database. In this case, we can use the set of de novo sequences, which with a very high probability contain a variant that is completely correct, to look for alternative explanations for the source of the spectrum (e.g., instances of alternative splicing or fusion proteins, as described above).
Acknowledgments
This project was supported by NIH grant NIGMS 1-R01-RR16522.
Footnotes
The prefix masses correspond to the N –terminal b–ion series and the suffix masses correspond to the C–terminal y–ion series.
Note that we ignore the problem of symmetric paths since they are very rare with precision MS data (symmetric paths are formed when single peaks are used with multiple interpretations, e.g., a peak appears in one of the path's nodes as a b–ion and in another node as a y–ion). However, if solution paths are required to be anti-symmetric, the method of Chen et al., 2001 [12] can be used (it runs in time proportional to the product of the number of edges and the number of vertices in the spectrum graph.)
The probability of observing a noisy peak is approximated by .
FT-ICR detects some “phantom” fragments that appear due to harmonics. These fragments that appear as double (or higher) charged fragments are an artifact of lower charged intense peaks [35].
The benchmark experiments were conducted on a desktop PC with a 2.8 GHz Pentium D processor and 2 GB of RAM.
References
- 1.Siuzdak G. The expanding role of mass spectrometry in biotechnology. MCC Press; 2003. [Google Scholar]
- 2.Marshall AG, Hendrickson CL. Fourier transform ion cyclotron resonance detection: Principles and experimental configurations. Int J Mass Spectrom. 2002;215:59–75. [Google Scholar]
- 3.Olsen JV, de Godoy LMF, Li G, Macek B, Mortensen P, Pesch R, Makarov A, Lange O, Horning S, Mann M. Parts per million mass accuracy on an orbitrap mass spectrometer via lock mass injection into a C-trap. Mol Cell Proteomics. 2005;4:2010–2021. doi: 10.1074/mcp.T500030-MCP200. [DOI] [PubMed] [Google Scholar]
- 4.Eng JK, McCormack AL, Yates JR. An Approach to Correlate Tandem Mass-Spectral Data of Peptides with Amino Acid Sequences in a Protein Database. Journal Of The American Society For Mass Spectrometry. 1994;5:976–989. doi: 10.1016/1044-0305(94)80016-2. [DOI] [PubMed] [Google Scholar]
- 5.Perkins DN, Pappin DJ, Creasy DM, Cottrell JS. Probability-based protein identification by searching sequence databases using mass spectrometry data. Electrophoresis. 1999;20:3551–3567. doi: 10.1002/(SICI)1522-2683(19991201)20:18<3551::AID-ELPS3551>3.0.CO;2-2. [DOI] [PubMed] [Google Scholar]
- 6.Craig R, Beavis RC. TANDEM: matching proteins with tandem mass spectra. Bioinformatics. 2004;20:1466–1467. doi: 10.1093/bioinformatics/bth092. [DOI] [PubMed] [Google Scholar]
- 7.Tanner S, Shu H, Frank A, Mumby M, Pevzner P, Bafna V. Inspect: Fast and accurate identification of post-translationally modified peptides from tandem mass spectra. Anal Chem. 2005;77:4626–4639. doi: 10.1021/ac050102d. [DOI] [PubMed] [Google Scholar]
- 8.Taylor JA, Johnson RS. Sequence database searches via de novo peptide sequencing by tandem mass spectrometry. Rapid Commun Mass Spectrom. 1997;11:1067–1075. doi: 10.1002/(SICI)1097-0231(19970615)11:9<1067::AID-RCM953>3.0.CO;2-L. [DOI] [PubMed] [Google Scholar]
- 9.Dancík V, Addona TA, Clauser KR, Vath JE, Pevzner PA. De novo peptide sequencing via tandem mass spectrometry. J Comput Biol. 1999;6:327–342. doi: 10.1089/106652799318300. [DOI] [PubMed] [Google Scholar]
- 10.Zhang Z, McElvain JS. De Novo Peptide Sequencing by Two-Dimensional Fragment Correlation Mass Spectrometry. Anal Chem. 2000;72:2337–2350. doi: 10.1021/ac000226k. [DOI] [PubMed] [Google Scholar]
- 11.Taylor JA, Johnson RS. Implementation and uses of automated de novo peptide sequencing by tandem mass spectrometry. Anal Chem. 2001;73:2594–2604. doi: 10.1021/ac001196o. [DOI] [PubMed] [Google Scholar]
- 12.Chen T, Kao MY, Tepel M, Rush J, Church GM. A dynamic programming approach to de novo peptide sequencing via tandem mass spectrometry. J Comput Biol. 2001;8:325–337. doi: 10.1089/10665270152530872. [DOI] [PubMed] [Google Scholar]
- 13.Lubeck O, Sewell C, Gu S, Chen X, Cai D. New computational approaches for de novo peptide sequencing from MS/MS experiments. IEEE Proc on Challenges in Biomedical Informatics. 2002;90:1868–1874. [Google Scholar]
- 14.Bafna V, Edwards N. On de-novo interpretation of tandem mass spectra for peptide identification. Proceedings of the Seventh Annual International Conference on Computational Molecular Biology; 2003. pp. 9–18. [Google Scholar]
- 15.Ma B, Zhang K, Hendrie C, Liang C, Li M, Doherty-Kirby A, Lajoie G. PEAKS: powerful software for peptide de novo sequencing by tandem mass spectrometry. Rapid Commun Mass Spectrom. 2003;17:2337–2342. doi: 10.1002/rcm.1196. [DOI] [PubMed] [Google Scholar]
- 16.Frank A, Pevzner P. Pepnovo: De novo peptide sequencing via probabilistic network modeling. Anal Chem. 2005;77:964–973. doi: 10.1021/ac048788h. [DOI] [PubMed] [Google Scholar]
- 17.Bern MW, Goldberg D. EigenMS: De novo analysis of peptide tandem mass spectra by spectral graph partitioning. Proceedings of the Ninth annual International Conference on Research in Computational Molecular Bilogy (RECOMB 2005); 2005. pp. 357–372. [DOI] [PubMed] [Google Scholar]
- 18.Fischer B, Roth V, Roos F, Grossmann J, Baginsky S, Widmayer P, Gruissem W, Buhmann JM. NovoHMM: A Hidden Markov Model for de novo peptide sequencing. Anal Chem. 2005;77:7265–7273. doi: 10.1021/ac0508853. [DOI] [PubMed] [Google Scholar]
- 19.Savitski MM, Nielsen ML, Kjeldsen F, Zubarev RA. Proteomics-grade de novo sequencing approach. J Proteome Res. 2005;4:2348–2354. doi: 10.1021/pr050288x. [DOI] [PubMed] [Google Scholar]
- 20.Mann M, Wilm M. Error-tolerant identification of peptides in sequence databases by peptide sequence tags. Anal Chem. 1994;66:4390–4399. doi: 10.1021/ac00096a002. [DOI] [PubMed] [Google Scholar]
- 21.Mørtz E, O'Connor PB, Roepstorff P, Kelleher NL, Wood TD, McLafferty FW, Mann M. Sequence tag identification of intact proteins by matching tandem mass spectral data against sequence data bases. PNAS. 1996;93:8264–8267. doi: 10.1073/pnas.93.16.8264. [DOI] [PMC free article] [PubMed] [Google Scholar]
- 22.Clauser KR, Baker PR, Burlingame AL. Role of accurate mass measurement (+/- 10 ppm) in protein identication strategies employing ms or ms/ms and database searching. Anal Chem. 1999;71:2871–2882. doi: 10.1021/ac9810516. [DOI] [PubMed] [Google Scholar]
- 23.Tabb DL, Saraf A, Yates JR. GutenTag: High-throughput sequence tagging via an empirically derived fragmentation model. Anal Chem. 2003;75:6415–6421. doi: 10.1021/ac0347462. [DOI] [PMC free article] [PubMed] [Google Scholar]
- 24.Frank A, Tanner SW, Bafna V, Pevzner PA. Peptide sequence tags for fast database search in mass-spectrometry. J of Proteome Research. 2005;4:1287–95. doi: 10.1021/pr050011x. [DOI] [PubMed] [Google Scholar]
- 25.Shevchenko A, Loboda A, Sunyaev S, Shevchenko A, Bork P, Ens W, Standing KG. Charting the proteomes of organisms with unsequenced genomes by MALDI-Quadrupole Time-of Flight Mass Spectrometry and BLAST homology searching. Anal Chem. 2001;73:1917–1926. doi: 10.1021/ac0013709. [DOI] [PubMed] [Google Scholar]
- 26.Searle BC, Dasari S, Turner M, Reddy AP, Choi D, Wilmarth PA, McCormack AL, David LL, Nagalla SR. High-throughput identification of proteins and unanticipated sequence modifications using a mass-based alignment algorithm for ms/ms de novo sequencing results. Anal Chem. 2004;76:2220–2230. doi: 10.1021/ac035258x. [DOI] [PubMed] [Google Scholar]
- 27.Han Y, Ma B, Zhang K. SPIDER: software for protein identification from sequence tags with de novo sequencing error. J Bioinform Comput Biol. 2005;3:697–716. doi: 10.1142/s0219720005001247. [DOI] [PubMed] [Google Scholar]
- 28.Horn DM, Zubarev RA, McLafferty FW. Automated de novo sequencing of proteins by tandem high-resolution mass spectrometry. PNAS. 2000;97:10313–10317. doi: 10.1073/pnas.97.19.10313. [DOI] [PMC free article] [PubMed] [Google Scholar]
- 29.Spengler B. De novo sequencing, peptide composition analysis, and composition-based sequencing: a new strategy employing accurate mass determination by fourier transform ion cyclotron resonance mass spectrometry. J Am Soc Mass Spectrom. 2004;15:703–714. doi: 10.1016/j.jasms.2004.01.007. [DOI] [PubMed] [Google Scholar]
- 30.Olson MT, Epstein JA, Yergey AL. De novo peptide sequencing using exhaustive enumeration of peptide composition. J Am Soc Mass Spectrom. 2006;17:1041–1049. doi: 10.1016/j.jasms.2006.03.007. [DOI] [PubMed] [Google Scholar]
- 31.Savitski MM, Nielsen ML, Zubarev RA. New data base-independent, sequence tag-based scoring of peptide ms/ms data validates mowse scores, recovers below threshold data, singles out modified peptides, and assesses the quality of ms/ms techniques. Mol Cell Proteomics. 2005;4:1180–1188. doi: 10.1074/mcp.T500009-MCP200. [DOI] [PubMed] [Google Scholar]
- 32.Tanner S, Shen Z, Ng J, Florea L, Guigó R, Briggs SP, Bafna V. Improving gene annotation using peptide mass spectrometry. doi: 10.1101/gr.5646507. In preparation. [DOI] [PMC free article] [PubMed] [Google Scholar]
- 33.Budnik BA, Nielsen ML, Olsen JV, Haselmann KF, Hörth P, Haehnel W, Zubarev RA. Can relative cleavage frequencies in peptides provide additional sequence information? Int J Mass Spectrom. 2002;219:283–294. [Google Scholar]
- 34.Bartels C. Fast algorithm for peptide sequencing by mass spectroscopy. Biomedical and Environmental Mass Spectrometry. 1990;19:363–368. doi: 10.1002/bms.1200190607. [DOI] [PubMed] [Google Scholar]
- 35.Marshall AG, Verdun FR. Fourier Transforms In NMR, Optical, And Mass Spectrometry : A Users Handbook. Elsevier. 1990 [Google Scholar]
- 36.Tabb DL, Smith LL, Breci LA, Wysocki VH, Lin D, Yates JR. Statistical characterization of ion trap tandem mass spectra from doubly charged tryptic peptides. Anal Chem. 2003;75:1155–1163. doi: 10.1021/ac026122m. [DOI] [PMC free article] [PubMed] [Google Scholar]
- 37.Havilio M, Haddad Y, Smilansky Z. Intensity-based statistical scorer for tandem mass spectrometry. Anal Chem. 2003;75:435–444. doi: 10.1021/ac0258913. [DOI] [PubMed] [Google Scholar]
- 38.Huang Y, Triscari JM, Tseng GC, Pasa-Tolic L, Lipton MS, Smith RD, Wysocki VH. Statistical characterization of the charge state and residue dependence of low-energy CID peptide dissociation patterns. Anal Chem. 2005;77:5800–5813. doi: 10.1021/ac0480949. [DOI] [PMC free article] [PubMed] [Google Scholar]
- 39.Creasy DM, Cottrell JS. Error tolerant searching of uninterpreted tandem mass spectrometry data. Proteomics. 2002;2:1426–1434. doi: 10.1002/1615-9861(200210)2:10<1426::AID-PROT1426>3.0.CO;2-5. [DOI] [PubMed] [Google Scholar]
- 40.Bandeira N, Tsur D, Frank A, Pevzner PA. A new approach to protein identification. Proceedings of the 10th Annual International Conference on Computational Molecular Biology, volume 3909 of Lecture Notes in Computer Science; 2006. pp. 363–378. [Google Scholar]
- 41.Shevchenko A, Sunyaev S, Liska A, Bork P, Shevchenko A. Nanoelectrospray tandem mass spectrometry and sequence similarity searching for identification of proteins from organisms with unknown genomes. Methods Mol Biol. 2003;211:221–234. doi: 10.1385/1-59259-342-9:221. [DOI] [PubMed] [Google Scholar]