Abstract
Although atomistic simulations of proteins and other biological systems are approaching microsecond timescales, the quality of simulation trajectories has remained difficult to assess. Such assessment is critical not only for establishing the relevance of any individual simulation, but also in the extremely active field of developing computational methods. Here we map the trajectory assessment problem onto a simple statistical calculation of the “effective sample size” - i.e., the number of statistically independent configurations. The mapping is achieved by asking the question, “How much time must elapse between snapshots included in a sample for that sample to exhibit the statistical properties expected for independent and identically distributed configurations?” Our method is more general than standard autocorrelation methods, in that it directly probes the configuration space distribution, without requiring a priori definition of configurational substates, and without any fitting parameters. We show that the method is equally and directly applicable to toy models, peptides, and a 72-residue protein model. Variants of our approach can readily be applied to a wide range of physical and chemical systems.
What does convergence mean? The answer is not simply of abstract interest, since many aspects of the biomolecular simulation field depend on it. When parameterizing potential functions, it is essential to know whether inaccuracies are attributable to the potential, rather than under-sampling.1 In the extremely active area of methods development for equilibrium sampling, it is necessary to demonstrate that a novel approach is better than its predecessors, in the sense that it equilibrates the relative populations of different conformers in less CPU time.2 And in the important area of free energy calculations, under-sampling can result in both systematic error and poor precision.3
To rephrase the basic question, given a simulation trajectory (an ordered set of correlated configurations), what characteristics should be observed if convergence has been achieved? The obvious, if tautological, answer is that all states should have been visited with the correct relative probabilities, as governed by a Boltzmann factor (implicitly, free energy) in most cases of physical interest. Yet given the omnipresence of statistical error, it has long been accepted that such idealizations are of limited value. The more pertinent questions have therefore been taken to be: Does the trajectory give reliable estimates for quantities of interest? What is the statistical uncertainty in these estimates4–7? In other words, convergence is relative, and in principle, it is rarely meaningful to describe a simulation as not converged, in an absolute sense. (An exception is when a priori information indicates the trajectory has failed to visit certain states.)
Accepting the relativity of convergence points directly to the importance of computing statistical uncertainty. The reliability of ensemble averages typically has been gauged in the context of basic statistical theory, by noting that statistical errors decrease with the square-root of the number of independent samples. The number of independent samples pertinent to the uncertainty in a quantity A, in turn, has been judged by comparing the trajectory length to the timescale of A’s correlation with itself—A’s autocorrelation time.5,7,8 Thus, a trajectory of length tsim with an autocorrelation time for A of τA can be said to provide an estimate for A with relative precision of roughly .
However, the estimation of correlation times can be an uncertain business, as good measurements of correlation functions require a substantial amount of data.9,10 Furthermore, different quantities typically have different correlation times. Other assessment approaches have therefore been proposed, such as the analysis of principal components11 and, more recently, structural histograms.12 Although these approaches are applicable to quite complex systems without invoking correlation functions, they attempt only to give an overall sense of convergence rather than quantifying precision. For instance, in comparing distributions from two halves of a trajectory,12 some difference is expected due to statistical error—but how much?
Thirumalai and coworkers made an important contribution when they introduced the “ergodic measure.13,14” By considering the fluctuations of an observable averaged over independent simulations, the timescale required for the observable to appear ergodic is deduced. Though not limited to energy-based observables, this is typically how the method has been implemented, both for model fluid systems14 and proteins.15 In independent work, Flyvbjerg and Petersen described a block-averaging approach which yields similiar information.
It is important to note that energy-based convergence measures may be insensitive to the slow timescales that characterize large conformational changes, in cases where the energy landscape is nearly degenerate. The problem is illustrated schematically in Fig. 1. The basic goal in convergence analysis here is to detect the slow timescale tslow based on a blind analysis of a trajectory. However, as ΔE decreases, energy-based convergence metrics will require an increasingly large number of transitions between the two states to gain a statistically meaningful signal of the presence of tslow, since the timescale must be detected via small time-averaged differences in the fluctuating energy. Indeed, in the limit ΔE → 0, it would not seem possible for an energy measure to reveal the slow timescale. Our approach, on the other hand will automatically and blindly detect tslow once the barrier has been crossed, regardless of the near (or complete) degeneracy in energy.
Figure 1.
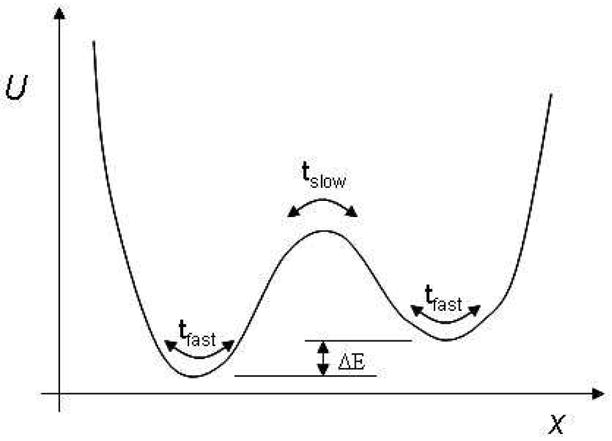
A schematic one-dimensional potential surface, for which the timescale tslow would not easily be determined by standard, energy-based convergence metrics.
Our approach generalizes the logic implicit in the Mountain-Thirumalai and Flyvbjerg-Petersen analyses by developing an overall structural decorrelation time which can be estimated, simply and robustly, in biomolecular and other systems. The key to our method is to view a simulation as sampling an underlying distribution (typically proportional to a Boltzmann factor) of the configuration space, from which all equilibrium quantities follow. In other words, the timescale governing sampling should also dominate convergence of typical ensemble averages. Our approach thus builds implicitly on the multi-basin picture proposed by Frauenfelder, Wolynes, and others,16,17 in which conformational equilibration requires equilibrating the relative populations of the various conformational substates.
On the basis of the configuration-space distribution, we can define the general effective sample size
 and the associated (de-)correlation time τdec associated with a particular trajectory. Specifically, τdec is the minimum time that must elapse between configurations for them to become fully decorrelated (i.e., with respect to any quantity). Here, fully decorrelated has a very specific meaning, which leads to testable hypotheses: a set of fully decorrelated configurations will exhibit the statistics of an independently and identically distributed (i.i.d.) sample of the governing distribution. Below, we detail the tests we use to compute τdec, which build on our recently proposed structural histogram analysis;12 see also.18
The key point is that the expected i.i.d. statistics must apply to any assay of a decorrelated sample. The contribution of the present paper is to recognize this, and then to describe an assay directly probing the configuration-space distribution for which analytic results are easily obtained for any system, assuming an i.i.d. sample. Procedurally, then, we simply apply our assay to increasing values hypothesized for τdec. When the value is too small, the correlations lead to anomalous statistics (fluctuations), but once the assayed fluctuations match the analytic i.i.d. predictions, the decorrelation time τdec has been reached. Hence, there is no fitting of any kind. Importantly, by a suitable use of our “structural histograms”,12 we can map a system of any complexity to an exactly soluble model which directly probes the fundamental configuration-space distribution. Grossfield et. al. have recently applied structural histograms to assay convergence by a bootstrap approach.19
In practical terms, our analysis computes the configurational/structural decorrelation time τdec (and hence the number of independent samples
 ) for a long trajectory many times the length of τdec. In turn, this provides a means for estimating statistical uncertainties in observables of interest, such as relative populations. Of equal importance, our analysis can reveal when a trajectory is dominated by statistical error, i.e., when the simulation time tsim ~ τdec. We note, however, that our analysis remains subject to the intrinsic limitation pertinent to all methods which aim to judge the quality of conformational sampling—of not knowing about parts of configuration space never visited by the trajectory being analyzed.
In contrast to most existing quantitative approaches, which attempt to assess convergence of a single quantity, our general approach enables the generation of ensembles of known statistical properties. These ensembles in turn can then be used for many purposes beyond ensemble averaging, such as docking, or developing a better understanding of native protein ensembles.
In the remainder of the paper, we describe the theory behind our assay, and then successfully apply it to a wide range of systems. We first consider a two-state Poisson process for illustrative purposes, followed by molecular systems: di-leucine peptide (2 residues; 50 atoms), Met-enkephalin (5 residues; 75 atoms), and a coarse-grained model of the N-terminal domain of calmodulin (72 united residues). For all the molecules, we test that our calculation for τdec is insensitive to details of the computation.
1 Theory
Imagine that we are handed a “perfect sample” of configurations of a protein—perfect, we are told, because it is made up of configurations that are fully independent of one another. How could we test this assertion? The key is to note that, for any arbitrarily defined partitioning of the sample of N configurations into S subsets (or bins), subsamples of these N configurations obey very simple statistics. In particular, the expected variance in the population of a bin, as estimated from many subsamples, can be calculated exactly.
Of course, a sample generated by a typical simulation is not made up of independent configurations. But since we know how the variance of sub-samples should behave for an ideal sample of independent configurations, we are able to determine how much simulation time must elapse before configurations may be considered independent. We call this time the structural decorrelation time, τdec. Below, we show how to partition the trajectory into structurally defined subsets for this purpose, and how to extract τdec.
There is some precedence for using the populations of structurally defined bins as a measure of convergence.12 Smith et al considered the number of structural clusters as a function of time as a way to evaluate the breadth and convergence of conformational sampling, and found this to be a much more sensitive indicator of sampling than other commonly used measures.20 Simmerling and coworkers went one step further, and compared the populations of the clusters as sampled by different simulations.18 Here, we go another step, by noting that the statistics of populations of structurally defined bins provide a unique insight into the quality of the sample.12 Recently, Grossfield et. al. combined an analysis of structural histograms with a bootstrap approach to address the question of effective sample size.19
Our analysis of a simulation trajectory proceeds in two steps, both detailed in Sec. 4:
A structural histogram is constructed. The histogram is a unique classification (a binning, not a clustering) of the trajectory based upon a set of reference structures, which are selected at random from the trajectory. The histogram so constructed defines a discrete probability distribution, P(S), indexed by the set of reference structures S.
We consider different subsamples of the trajectory, defined by a fixed interval of simulation time t. A particular “t subsample” of size n is formed by pulling n frames in sequence separated by a time t (see Fig. 2). When t gets large enough, it is as if we are sampling randomly from P(S). The smallest such t we identify as the structural decorrelation time, τdec, as explained below.
Figure 2.
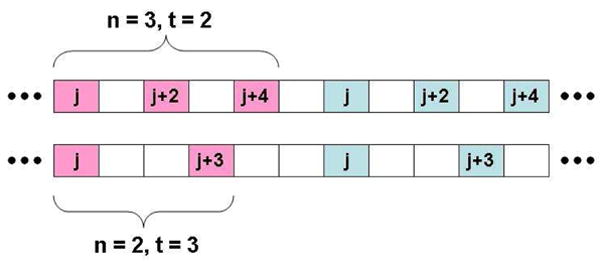
A trajectory can be subsampled in many ways, corresponding to different subsample sizes n and intervals t. In the top figure, the pink highlighted frames belong to an n = 3, t = 2 subsample, the blue frames to another subsample of the same type. The bottom figure shows two n = 2, t = 3 subsamples. The frame index (simulation time) is labelled by j.
1.1 Structural Histogram
A “structural histogram” is a one-dimensional population analysis of a trajectory based on a partitioning (classification) of configuration space. Such classifications are simple to perform based on proximity of the sampled configurations to a set of reference structures taken from the trajectory itself.12 The structural histogram will form the basis of the decorrelation time analysis. Although histograms of arbitrary observables may be used in principle, we believe it is optimal to probe the configuartion space distribution directly. The structural histogram defines a distribution, which is then used to answer the question, “How much time must elapse between frames before we are sampling randomly from this distribution?” Details are given in Sec. 4.
Does the the equilibration of a structural histogram reflect the equilibration of the underlying conformational substates (CS)? Certainly, several CS’s will be lumped together into the same bin, while others may be split between one or more bins. But clearly, equilibration of the histogram bins requires equilibration of the underlying CS’s. We will present evidence that this is indeed the case in Sec. 2. Furthermore, since the configuration space distribution (and the statistical error associated with our computational estimate thereof) controls all ensemble averages, it determines the precision with which these averages are calculated. We will show that the convergence of a structural histogram is very sensitive to configuration space sampling errors.
1.2 Statistical analysis of P(S) and the decorrelation time τdec
In this section we define an observable, , which depends very sensitively on the bin populations of a structural histogram as a function of the interval t between frames. Importantly, can be exactly calculated for a histogram of fully decorrelated structures. Plotting as a function of t, we identify the time at which the observed value equals that for fully decorrelated structures as the structural decorrelation time.
Given a trajectory of N frames, we build a uniform histogram of S bins P(S), using the procedure described in Sec. 4. By construction, the likelihood that a randomly selected frame belongs to bin ‘i’ of P is simply 1/S. Now imagine for a moment that the trajectory was generated by an algorithm which produced structures that are completely independent of one another. Given a subsample of n frames of this correlationless trajectory, the expected number of structures in the subsample belonging to a particular bin is simply n/S, regardless of the “time” separation of the frames.
As the trajectory does not consist of independent structures, the statistics of subsamples depend on how the subsamples are selected. For example, a subsample of frames close together in time are more likely to belong to the same bin, as compared to a subsample of frames which span a longer time. Frames that are close together (in simulation time) are more likely to be in similiar conformational substates, while frames separated by a time which is long compared to the typical inter-state transition times are effectively independent. The difference between these two types of subsamples—highly correlated vs. fully independent—is reflected in the variance among a set of subsampled bin populations (see Fig. 2). Denoting the population of bin i observed in subsample k as , the fractional population is defined as . The variance σ2(fi) in the fractional population fi of bin i is then defined as
| (1) |
where overbars denote averaging over subsamples: , where M is the total number of subsamples in the trajectory. Since here we are considering only uniform probability histograms, is the same for every i: .
The expected variance of bin populations when allocating
 fully independent structures to S bins is calculated in introductory probability texts under the rubric of “sampling without replacement.21” The variance in fractional occupancy of each bin of this (hypergeometric) distribution depends only on the total number of independent structures
 , the size n of the sub-samples used to “poll” the distribution, and the fraction f of the structures which are contained in each bin:
| (2) |
But can we use this exact result to infer something about the correlations that are present in a typical trajectory? Following the intuition that frames close together in time are correlated, while frames far apart are independent, we compute the variance in Eq. 1 for different sets of subsamples, which are distinguished by a fixed time t between subsampled frames (Fig. 2). We expect that averaging over subsamples that consist of frames close together in time will lead to a variance which is higher than that expected from an ideal sample (Eq. 2). As t increases, the variance should decrease as the frames in each subsample become less correlated. Beyond some t (provided the trajectory is long enough), the subsampled frames will be independent, and the computed variance will be that expected from an i.i.d. sample.
In practice, we turn this intuition into a (normalized) observable in the following way:
Pick a subsample size n, typically between 2 and 10. Set t to the time between stored configurations.
Compute according to Eq. 1 for each bin i.
-
Average over all the bins and normalize by σ2(f)—the variance of an i.i.d. sample (Eq. 2):
(3) By construction, for many samples consisting of independent frames.
Repeat (ii) and (iii) for increasing t, until the subsamples span a number of frames on the order of the trajectory length.
Plotting
as a function of t, we identify the subsampling interval t at which the variance first equals the theoretical prediction as the structural decorrelation time, τdec. For frames which are separated by at least τdec, it is as if they were drawn independently from the distribution defined by P(S). The effective sample size
 is then the number of frames T in the trajectory divided by τdec. Statistical uncertainty on thermodynamic averages is proportional to
.
As t gets larger, the number of subsamples which “fit” into a trajectory decreases, and therefore is averaged over fewer subsamples. This results in some noise in the measured value of , which gets more pronounced with increasing t. To quantify this behavior, we calculated an 80% confidence interval around the theoretical prediction, indicated by error bars. Given an n and t, the number of subsamples is fixed. The error bars indicate the range where 80 % of variance estimates fall, based on this fixed number of (hypothesized) independent samples from the hypergeometric distribution defined by P(S). It should be noted, however, that the size of the confidence interval is somewhat arbitrary—it is merely meant to show that the observed behavior is to be expected. Clearly, given a longer trajectory, the noise in the observed variance would be consistent with a tighter confidence interval.
But does τdec correspond to a physically meaningful timescale? Below, we show that the answer to this question is affirmative, and that, for a given trajectory, the same τdec is computed, regardless of the histogram. Indeed, τdec does not depend on whether it is calculated based on a uniform or a nonuniform histogram.
2 Results
In the previous section, we introduced an observable, , and argued that it will be sensitive to the conformational convergence of a molecular simulation. However, we need to ask whether the results of the analysis reflect physical processes present in the simulation. After all, it may be that good sampling of a structural histogram is not indicative of good sampling of the conformation space.
Our strategy is to first test the analysis on some models with simple, known convergence behavior. We then turn our attention to more complex systems, which sample multiple conformational substates on several different timescales.
2.1 Poisson process
Perhaps the simplest nontrivial model we can imagine has two states, with rare transitions between them. If we specify that the likelihood of a transition in a unit interval of time is a small constant κ < 1 (Poisson process), then the average lifetime of each state is simply 1/κ. Transitions are instantaneous, so that a “trajectory” of this model is simply a record of which state (later, histogram bin) was occupied at each timestep. Our decorrelation analysis is designed to answer the question, “Given that the model is in a particular state, how much time must elapse before there is an equal probability to be in either state?”
Figure 3 shows the results of the analysis for several different values of κ. The horizontal axis measures the time between subsampled frames. Frames that are close together are likely to be in the same state, which results in a variance higher than that expected from an uncorrelated sample of the two states. As the time between subsampled frames increases, the variance decreases, until reaching the value predicted for independent samples, where it stays.
Figure 3.
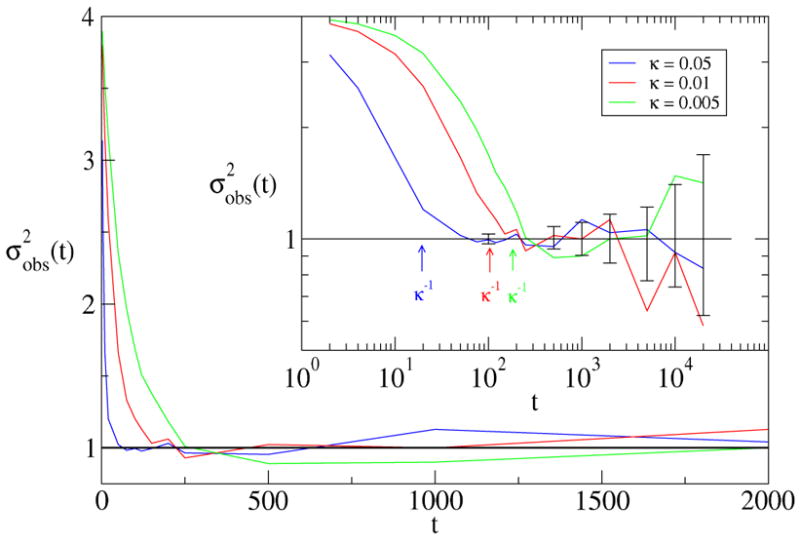
Plotted is the behavior of for three values of κ. All the data have been rescaled by the variance predicted for independent sampling of the two states (Eq. 2). The solid horizontal line indicates the expected variance for i.i.d. samples. An 80 % confidence interval on the (n = 4, red) theoretical prediction for independent samples is indicated by the error bars.
The inset demonstrates that the time for which the variance first reaches the theoretical value is easily read off when the data are plotted on a log-log scale. In all three cases, this value correlates well with the (built-in) transition time 1/κ. It is noteworthy that, in each case, we actually must wait a bit longer than 1/κ before the subsampled elements are uncorrelated. This likely reflects the additional waiting time necessary for the Poisson trajectory to have equal likelihood of being in either state.
2.2 Leucine dipeptide
Our approach readily obtains the physical timescale governing conformational equilibration in molecular systems. Implicitly solvated leucine dipeptide (ACE-Leu2-NME), having fifty atoms, is an ideal test system because a thorough sampling of conformation space is possible by brute force simulation. The degrees of freedom that distinguish the major conformations are the φ and ψ dihedrals of the backbone, though side-chain degrees of freedom complicate the landscape by introducing many locally stable conformations within the major Ramachandran basins. It is therefore intermediate in complexity between a “toy-model” and larger peptides.
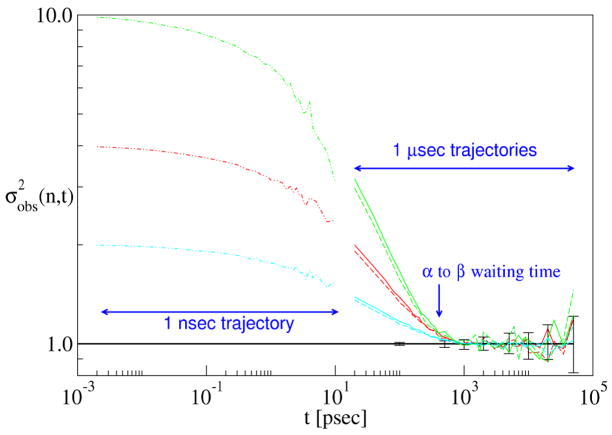
Two independent trajectories of 1 μsec each were analyzed; the simulation details have been reported elsewhere.22 For each trajectory, 9 independent histograms consisting of 10 bins of uniform probability were built as described in Sec. 1.1. For each histogram, (Eq. 3) was computed for n = 2, 4, 10. We then averaged over the 9 independent histograms separately for each n and each trajectory—these averaged signals are plotted in Fig. 4.
Figure 4.
Convergence analysis of two independent 1 μ sec dileucine trajectories (distinguished by dashed and solid lines) and a single 1 nsec trajectory (dash-dot lines) for 3 different subsample sizes: n = 2 (blue), n = 4 (red), and n = 10 (green). The horizontal line and error bars are as described in the previous caption. The average time between α → β transitions is indicated.
When the subsamples consist of frames separated by short times t, the subsamples are made of highly correlated frames. This leads to an observed variance greater than that expected for a sample of independent snapshots, as calculated for each n from Eq. 2 and shown as a thick black horizontal line. then decreases monotonically with time, until it matches the theoretical prediction for decorrelated snapshots at about 900 psec. The agreement between the computed and theoretical variance (with no fitting parameters) indicates that the subsampled frames are behaving as if they were sampled at random from the structural histogram. We therefore identify τdec = 900 psec, giving an effective sample size of just over 1, 100.
Does the decorrelation time correspond to a physical timescale? First, we note that τdec is independent of the subsample size n, as shown in Fig. 4. Second, we note that the decorrelation times agree between the two independent trajectories. This is expected, since the trajectories are quite long for this small molecule, and therefore should be very well-sampled. Finally, the decorrelation time is consistent with the typical transition time between the α and β basins of the Ramachandran map, which is on the order of 400 psec in this model. As in the Poisson process, τdec is a bit longer than the α → β transition time.
How would the data look if we had a much shorter trajectory, of the order of τdec? This is also answered in Fig. 4, where we have analyzed a dileucine trajectory of only 1 nsec in length. Frames were saved every 10 fsec, so that this trajectory had the same total number of frames as each of the 1 μsec trajectories. The results are striking—not only does fail to attain the value for independent sampling, but the values appear to connect smoothly (apart from some noise) with the data from the longer trajectories. (We stress that the 1 nsec trajectory was generated and analyzed independently of both 1 μsec trajectories—it is not simply the first nsec of either.) In the event that we had only the 1 nsec trajectories, we could state unequivocably that they are poorly converged, since they fail to attain the theoretical prediction for a well-converged trajectory.
We also investigated whether the decorrelation time depends on the number of reference structures used to build the structural histogram. As shown in Fig. 5, τdec is the same, whether we use a histogram of 10 bins or 50 bins. (Fig. 4 used 10 bins.) It is interesting that the data are somewhat smoothed by dividing up the sampled space among more reference structures. While this seems to argue for increasing the number of reference structures, it should be remembered that increasing the number of references by a factor of 5 increases the computational cost of the analysis by the same factor, while τdec is robustly estimated based on a histogram containing 10 bins.
Figure 5.
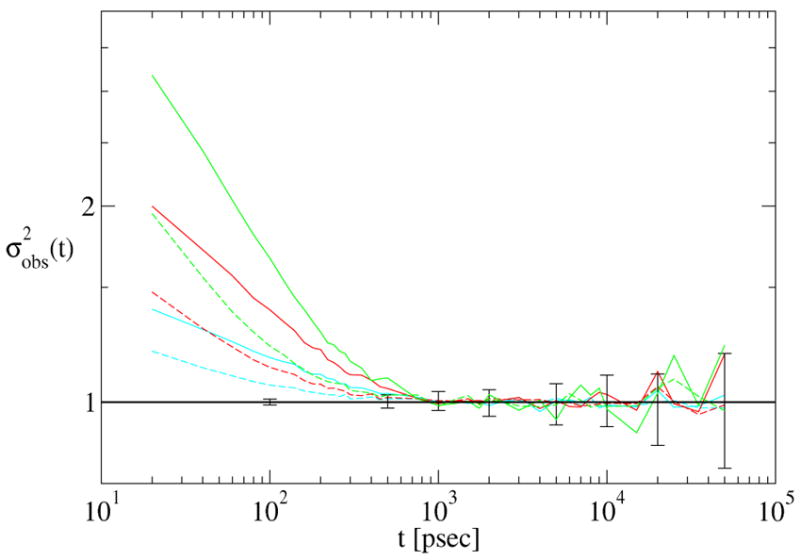
Convergence analysis of a single 1 μ sec dileucine trajectory for different numbers of reference structures: S = 10 (solid lines) and S = 50 (dashed lines). The colors and error bars (on the S = 10 prediction) are the same as in the previous plot.
2.3 Calmodulin
We next considered a previously developed united-residue model of the N-terminal domain of calmodulin.23 In the “double native” Gō potential used, both the apo (Ca2+–free)24 and holo (Ca2+–bound)25 structures are stabilized, so that occasional spontaneous transitions are observed between the two states.
In contrast with the dileucine model just discussed, the coarse-grained calmodulin simulation has available a much larger conformation space. The apo-holo transition represents a motion entailing 4.6 Å RMSD, and involves a collective rearrangement of helices. In addition to apo-holo transitions, the trajectories include partial unfolding events, which do not lend themselves to an interpretation as transitions between well-defined states. In light of these different processes, it is interesting to see how our analysis fares.
Two independent trajectories were analyzed, each 5.5×10⁷ Monte Carlo sweeps (MCS) in length. Each trajectory was begun in the apo configuration, and approximately 40 transition events were observed in each. For both trajectories, the analysis was averaged over 4 independent histograms, each with 10 bins of uniform probability.
The results of the analysis are shown in Fig. 6. It is interesting that the decorrelation time estimated from Fig. 6 is about a factor of 2 shorter than the average waiting time between α → β transitions. This is perhaps due to the noisier signal (as compared to the previous cases), which is in turn due to the small number of transition events observed—about 40 in each trajectory, compared to about 2.5 ×10³ events in the dileucine trajectories.
Figure 6.
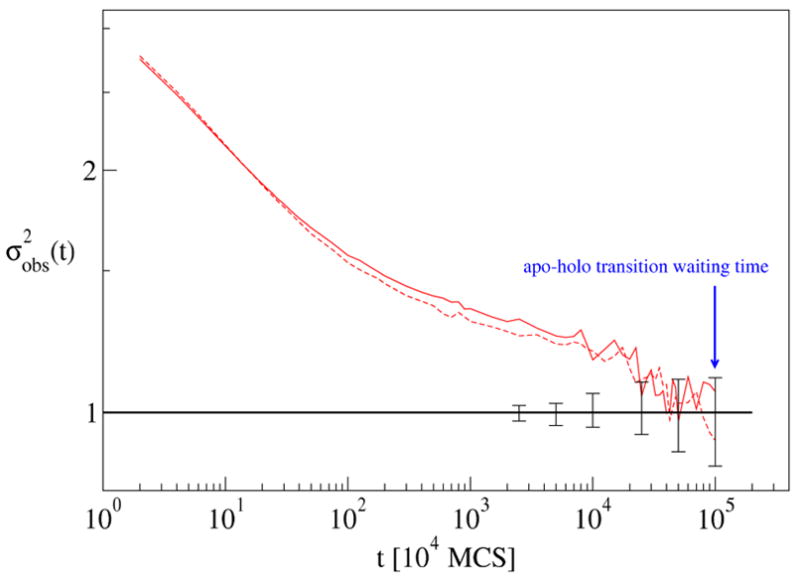
Convergence data for two independent calmodulin trajectories. is plotted for a sample size of n = 4. Error bars indicate 80 % confidence intervals for uncorrelated subsamples of size n = 4.
In either case, our analysis yields a robust estimate of the decorrelation time, regardless of the underlying processes. The conclusion we draw from this data is that one should only interepret the decorrelation analysis as “logarithmically accurate” (up to a factor of ~ 2) when the data are noisy.
2.4 Met-enkephalin
In the previous examples, we considered models which admit a description in terms of two dominant states–known in advance–with occasional transitions between them. Here, we study the highly flexible pentapeptide met-enkephalin , which does not lend itself to such a simple description. Our aim is to see how our convergence analysis will perform in this case, where multiple unknown conformations are interconverting on many different timescales.
Despite the lack of a simple description in terms of a few, well-defined states connected by occasional transitions, our decorrelation analysis yields an unambiguous signal of the decorrelation time for this system. The data (Fig. 7) indicate that 3 or 4 nsec must elapse between frames before they be considered statistically independent, which in turn implies that each of our 1 μ sec trajectories has an effective sample size of 200 or 250 frames. We stress that this is learned from a “blind” analysis, without any knowledge of the underlying free energy surface.
Figure 7.
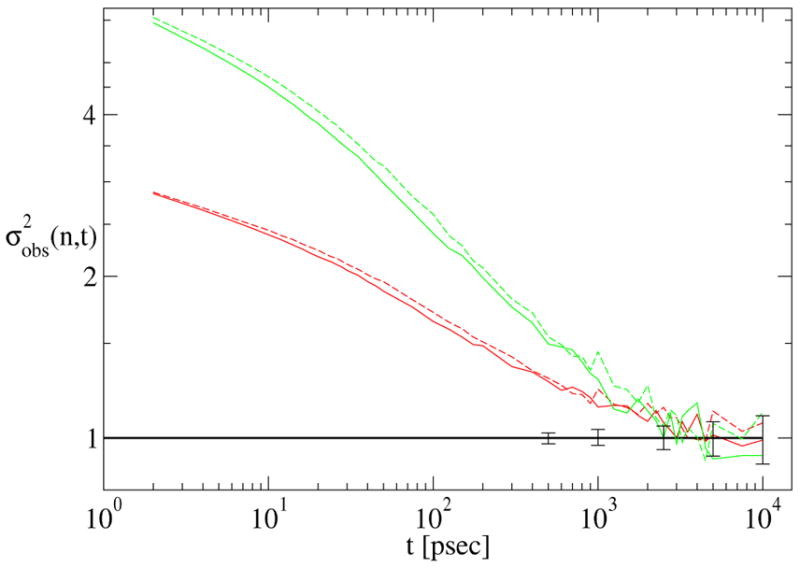
Convergence data for two independent 1 μ sec met-enkephalin trajectories, distinguished by solid and dashed lines, for subsample sizes n = 4 (red) and n = 10 (green). Error bars indicate 80 % confidence intervals for uncorrelated subsamples of size n = 4.
3 Discussion
We have developed a new tool for assessing the quality of molecular simulation trajectories—namely, the effective sample size
 which quantifies the number of statistically independent configurations in a trajectory.
 is determined by testing for “structural correlation”, the tendency for snapshots which are close together in simulation time to be similiar. The analysis first computes a “structural decorrelation time”, which answers the question, “How much simulation time must elapse before the sampled structures display the statistics of an i.i.d sample?” This in turn implies an effective sample size,
 , which is the number of frames in the trajectory that are statiscally independent, in the sense that they behave as if independent and identically distributed. We stress that our method is quite distinct from the analysis of statistical efficiency based on autocorrelation functions.
In several model systems, for which the timescale needed to decorrelate snapshots was known in advance, we have shown that the decorrelation analysis is consistent with the “built-in” timescale. We have also shown that the results are not sensitive to the details of the structural histogram or to the subsampling scheme used to analyze the resulting timeseries. There are no adjustable parameters. Finally, we have demonstrated a calculation of an effective sample size for a highly flexible system which cannot be approximately described in terms of a small number of well-defined states and a few dominant timescales. This is critically important, since the important states of a system are generally not known in advance.
Although we applied our analysis to “structural histograms,” we emphasize that the approach can be applied to any histogram generated from a trajectory. Certainly similiarity measures other than RMSD could be used. Furthermore, the analysis could be performed “on the fly,” if desired.
Our method may be applied in a straightforward way to discontinuous trajectories, which consist of several independent pieces.26 The analysis would be carried forward just as for a continuous trajectory. In this case, a few subsamples will be corrupted by the fact that they span the boundaries between the independent pieces. The error introduced will be minimal, provided that the decorrelation time is shorter than the length of each independent piece.
The analysis is also applicable to exchange-type simulations,27 in which configurations are swapped between different simulations running in parallel. For a ladder of M replicas, one would perform the analysis on each of the M continuous trajectories that are had by following each replica as it wanders up and down the ladder. If the ladder is well-mixed, then all of the trajectories should have the same decorrelation time. And if the exchange simulation is more efficient than a standard simulation, then each replica will have a shorter decorrelation time than a “standard” simulation. This last observation attains considerable exigence, in light of the fact that exchange simulations have become the method of choice for state-of-the-art simulation.
There is a growing sense in the modeling and simulation community of the need to standardize measures of the quality of simulation results.28,29 Our method, designed specifically to address the statistical quality of an ensemble of structures, should be useful in this context. The several nanosecond timescale, observed in a peptide comprising a mere 75 atoms, sounds a note of caution for atomic resolution simulation of larger molecules.
4 Methods
4.1 Histogram Construction
Previously, we presented an algorithm which generated a histogram based on clustering the trajectory with a fixed cutoff radius,12 resulting in bins of varying probability. Here, we present a slightly modified procedure, which partitions the trajectory into bins of uniform probability, by allowing the cutoff radius to vary. For a particular continuous trajectory of N frames, the following steps are performed:
A bin probability, or fractional occupancy f is defined. Set j = 1
A structure Sj is picked at random from the trajectory.
Compute the distance, using an appropriate metric, from Sj to all remaining frames in the trajectory.
Order the frames according to the distance, and remove from the trajectory the first f × N frames, noting that they have been classified with reference structure Sj. Note also the “radius” rj of the bin, i.e., the distance to the farthest structure classified with Sj.
Repeat (ii)—(iv) for increasing j until every structure in the trajectory is classified.
4.2 Calmodulin
We analyzed two coarse-grained simulations of the N-terminal domain of calmodulin. Full details and analysis of the model have been published previously,23 here we briefly recount only the most relevant details. The model is a one bead per residue model of 72 residues (numbers 4 – 75 in pdb structure 1cfd), linked together as a freely jointed chain. Conformations corresponding to both the apo (pdb ID 1cfd) and holo (pdb ID 1cll) experimental structures24,25 are stabilized by Go interactions.30 Since both the apo and holo forms are stable, transitions are observed between these two states, ocurring on average about once every 5 × 10⁴ Monte Carlo sweeps (MCS).
4.3 Met-enkephalin
We analyzed two independent 1 μ sec trajectories and a single 1 nsec trajectory, each started from the PDB structure 1plw, model 1. The potential energy was described by the OPLSaa potential,31 with solvation treated implicitly by the GB/SA method.32 The equations of motion were integrated stochastically, using the discretized Langevin equation implemented in Tinker v. 4.2.2, with a friction constant of 5 psec−1 and the temperature set to 298 K.33 A total of 106 evenly spaced configurations were stored for each trajectory.
Acknowledgments
We thank Marty Ytreberg and Carlos Camacho for their insightful comments. The work was supported by the Dept. of Computational Biology, Univ. of Pittsburgh, and grants NIH GM076569 and NSF MCB-0643456.
References
- 1.Shirts MR, Pitera JW, Swope WC, Pande VS. J Chem Phys. 2003;119:5740–5761. [Google Scholar]
- 2.Zuckerman DM, Lyman E. J Chem Th and Comp. 2006;4:1200–1202. doi: 10.1021/ct600297q. [DOI] [PubMed] [Google Scholar]
- 3.Zuckerman DM, Woolf TB. Phys Rev Lett. 2002;89:180602. doi: 10.1103/PhysRevLett.89.180602. [DOI] [PubMed] [Google Scholar]
- 4.Binder K, Heermann DW. Monte Carlo Simulation in Statistical Physics. Springer; Berlin: 1997. [Google Scholar]
- 5.Ferrenberg AM, Landau DP, Binder K. J Stat Phys. 1991;63:867–882. [Google Scholar]
- 6.Flyvbjerg H, Petersen HG. J Chem Phys. 1989;91:461–466. [Google Scholar]
- 7.Frenkel D, Smit B. Understanding Molecular Simulation. Academic Press; San Diego: 1996. [Google Scholar]
- 8.Müller-Krumbhaar H, Binder K. J Stat Phys. 1973;8:1–24. [Google Scholar]
- 9.Zwanzig R, Ailawadi NK. Phys Rev. 1969;182:182–183. [Google Scholar]
- 10.Gō N, Kanô F. J Chem Phys. 1981;75:4166–4167. [Google Scholar]
- 11.Hess B. Phys Rev. 2002;E65:031910-1–031910-10. [Google Scholar]
- 12.Lyman E, Zuckerman DM. Biophys J. 2006;91:164–172. doi: 10.1529/biophysj.106.082941. [DOI] [PMC free article] [PubMed] [Google Scholar]
- 13.Thirumalai D, Mountain RD, Kirkpatrick TR. Phys Rev. 1989;A39:3563–3574. doi: 10.1103/physreva.39.3563. [DOI] [PubMed] [Google Scholar]
- 14.Mountain RD, Thirumalai D. J Chem Phys. 1989;93:6975–6979. [Google Scholar]
- 15.Straub JE, Thirumalai D. Proc Nat Acad Sci USA. 1993;90:809–813. doi: 10.1073/pnas.90.3.809. [DOI] [PMC free article] [PubMed] [Google Scholar]
- 16.Austin RH, Beeson KW, Eisenstein L, Frauenfelder H, Gunsalus JC. Biochemistry. 1975;14:5355–5373. doi: 10.1021/bi00695a021. [DOI] [PubMed] [Google Scholar]
- 17.Frauenfelder H, Sligar SG, Wolynes PG. Science. 1991;254:1598–1603. doi: 10.1126/science.1749933. [DOI] [PubMed] [Google Scholar]
- 18.Okur A, Wickstrom L, Layten M, Geney R, Song K, Hornak V, Simmerling C. J Chem Th Comp. 2006;2:420–433. doi: 10.1021/ct050196z. [DOI] [PubMed] [Google Scholar]
- 19.Grossfield A, Feller SE, Pitman MC. PROTEINS. 2007;67:31–40. doi: 10.1002/prot.21308. [DOI] [PubMed] [Google Scholar]
- 20.Smith LJ, Daura X, van Gunsteren WF. PROTEINS. 2002;48:487–496. doi: 10.1002/prot.10144. [DOI] [PubMed] [Google Scholar]
- 21.Feller W. An introduction to probability and its applications, Vol. 1. John Wiley and Sons, Inc.; New York: 1957. [Google Scholar]
- 22.Ytreberg FM, Zuckerman DM. J Phys Chem. 2005;B109:9096–9103. doi: 10.1021/jp0510692. [DOI] [PubMed] [Google Scholar]
- 23.Zuckerman DM. J Phys Chem. 2004;B108:5127–5137. [Google Scholar]
- 24.Chattopadhyaya R, Meador WE, Means AR, Quiocho FA. J Mol Biol. 1992;228:1177–1192. doi: 10.1016/0022-2836(92)90324-d. [DOI] [PubMed] [Google Scholar]
- 25.Kuboniwa H, Tjandra N, Grzesiek S, Ren H, Klee CB, Bax A. Nature Struct Bio. 1995;2:768–776. doi: 10.1038/nsb0995-768. [DOI] [PubMed] [Google Scholar]
- 26.Shirts MR, Pande VS. Phys Rev Lett. 2001;86:4983–4987. doi: 10.1103/PhysRevLett.86.4983. [DOI] [PubMed] [Google Scholar]
- 27.Earl DJ, Deem MW. Phys Chem Chem Phys. 2005;23:3910–3916. doi: 10.1039/b509983h. [DOI] [PubMed] [Google Scholar]
- 28.Berman HM, et al. Structure. 2006;14:1211–1217. doi: 10.1016/j.str.2006.06.005. [DOI] [PubMed] [Google Scholar]
- 29.Murdock SE, Tai K, Ng MH, Johnston S, Wu B, Fangohr H, Laughton CA, Essex JW, Sansom MSP. J Chem Theor Comp. 2006;2:1477–1481. doi: 10.1021/ct6001708. [DOI] [PubMed] [Google Scholar]
- 30.Taketomi H, Ueda Y, Go N. Int J Peptide Protein Res. 1975;7:445–459. [PubMed] [Google Scholar]
- 31.Jorgensen WL, Maxwell DS, Tirado-Rives J. J Am Chem Soc. 1996;117:11225–11236. [Google Scholar]
- 32.Still WC, Tempczyk A, Hawley RC. J Am Chem Soc. 1990;112:6127–6129. [Google Scholar]
- 33.Ponder JW, Richard FM. J Comput Chem. 1987;8:1016–1024. http://dasher.wustl.edu/tinker/


