

Abstract
Objectives
The objective of this study was to determine whether clinical, environmental, and genetic factors can be used to develop dosing algorithms for Caucasians and African Americans that perform better than giving empirical 5 mg/day.
Methods
From April 2002 through December 2005, 259 warfarin initiators were prospectively followed until they reached maintenance dose.
Results
The Caucasian algorithm included 11 variables (R2=0.43). This model (51% within 1 mg) performed better compared with 5 mg/day (29% within 5±1 mg). The African American algorithm included 10 variables (R2=0.28). This model predicted 37% of doses within 1 mg of the observed dose; a small improvement compared with 5 mg/day (34%). These results were similar to the results we obtained from testing other (published) algorithms.
Conclusions
The dosing algorithms in Caucasians explained <45% of the variability and the algorithms in African Americans performed only marginally better than giving 5 mg empirically.
Introduction
Warfarin is widely used for the prevention and treatment of venous thromboembolism, but has a narrow therapeutic index.1 In general most patients are started on an empiric dose (for example, 5 mg/day) based on population averages.2,3 However, there is large interpatient variability in warfarin dose requirements. As a result, empiric dosing results in frequent dose changes as the therapeutic international normalized ratio (INR) gets too high or low, leaving patients at risk for bleeding (over-coagulation) and thromboembolism (under-coagulation).4–6
Variants in the CYP2C9 (i.e., *2 and *3) and VKORC1 (i.e., 1173C/T or −1639G/A) genes have been shown to influence warfarin dose requirements.7–16 Based on this information, the US Food and Drug Administration (FDA) approved changing the labeling for warfarin to include information on how persons with certain genetic differences in CYP2C9 and VKORC1 genes may respond to warfarin. However, little information is available about the most appropriate initial warfarin dose for people with different CYP2C9 and VKORC1 variants and most dosing algorithms11, 14, 17–24 to date have not been externally validated.11, 14, 17–20 In addition, it is unclear if warfarin dosing algorithms will perform better than empirical dose initiation. Another shortcoming of these published algorithms is the very limited number of African Americans that were included in their development,20, 24 despite the fact that African Americans have the highest incidence rate of thromboembolism25, 26 and a lower prevalence of the CYP2C9 *2 and *3 and VKORC1 1173T alleles compared with Caucasians. In addition, one algorithm showed that variants in other genes might also be useful in dose prediction.18
Therefore, the purpose of this study was to develop warfarin dosing algorithms for African Americans and Caucasians including environmental factors, clinical factors, variants in CYP2C9 and VKORC1 genes, and variants in three other genes to determine if they perform better than empirically giving 5 mg/day. In addition, we wanted to determine how well other (published) warfarin dosing algorithms predict warfarin dose requirements in our cohort of Caucasians and African Americans.
Results
The study comprised a total of 380 subjects. Among the 295 who reached maintenance dose (82% of the Caucasians and 72% of the African Americans), we had complete data on 147 Caucasians and 112 African Americans. There was no significant difference in clinical, environmental, or genetic factors between subjects who reached and did not reach maintenance dose. Of the 36 subjects with missing data, 23 missed data on genetic factors and 13 on environmental or clinical factors. Only the 259 subjects with complete data were included in this study and the characteristics of this cohort by race is shown in Table 1. The mean maintenance warfarin dose (± standard deviation) was 5.26 ± 2.56 mg/day in Caucasians and 6.03 ± 2.93 mg/day in African Americans (P=0.03).
Table 1.
Characteristics by race
| Variable | Caucasians
(N=147) |
African Americans
(N=112) |
p-value† |
|---|---|---|---|
| Age (years) | 62.7 ± 13.8 | 56.9 ± 15.4 | 0.002 |
| Gender (female) | 43 (29.3%) | 46 (41.1%) | 0.05 |
| Body Mass Index | 0.01 | ||
| < 25 kg/m2 | 50 (34.0%) | 32 (28.6%) | |
| 25–30 kg/m2 | 59 (40.1%) | 30 (26.8%) | |
| > 30 kg/m2 | 38 (25.9%) | 50 (44.6%) | |
| VKORC1, 1173C/T | <0.0001 | ||
| CC | 60 (40.8%) | 95 (84.8%) | |
| CT | 74 (50.3%) | 16 (14.3%) | |
| TT | 13 ( 8.9%) | 1 ( 0.9%) | |
| CYP2C9, *1/*2/*3 | <0.0001 | ||
| *1*1 | 90 (61.2%) | 102 (91.1%) | |
| any *2 | 39 (26.5%) | 10 ( 8.9%) | |
| any *3 | 18 (12.3%) | 0 ( 0.0%) | |
| APOE, any ε | 0.08 | ||
| E2/E2 or E2/E3 | 17 (11.6%) | 17 (15.2%) | |
| E3/E3 or E2/E4 | 100 (68.0%) | 61 (54.5%) | |
| E4/E4 or E3/E4 | 30 (20.4%) | 34 (30.3%) | |
| Factor 7, −401G/T | 0.0001 | ||
| GG | 109 (74.2%) | 55 (49.1%) | |
| GT | 34 (23.1%) | 47 (42.0%) | |
| TT | 4 (2.7%) | 10 ( 8.9%) | |
| Most Drinks on one occasion | 2.2 ± 2.6 | 1.8 ± 2.3 | 0.15 |
| History of DVT, yes | 16 (10.9%) | 22 (19.6%) | 0.05 |
| History of diabetes, yes | 36 (24.5%) | 35 (31.3%) | 0.23 |
| Number of Medications that Potentiate | 1.6 ± 1.2 | 1.5 ± 1.4 | 0.25 |
| Warfarin at Baseline Use of Medications that Inhibit Warfarin at Baseline, yes | 68 (46.3%) | 52 (46.4%) | 0.98 |
| Indications for Warfarin | <0.0001 | ||
| Atrial Fibrillation/Flutter | 93 (63.3%) | 40 (35.7%) | |
| DVT/PE | 26 (17.7%) | 48 (42.9%) | |
| Dilated Cardiomyopathy | 13 (8.8%) | 7 ( 6.2%) | |
| Stroke/TIA | 6 (4.1%) | 4 ( 3.6%) | |
| Other | 9 (6.1%) | 13 (11.6%) |
Abbreviations: DVT=deep vein thrombosis; PE=pulmonary embolism; TIA=transient ischemic attack
P-values comparing characteristics by race
Model building in Caucasians
Variables with a bivariate P<0.20 in Caucasians were age; BMI; VKORC1 1173C/T polymorphism; CYP2C9 *2 and *3 alleles; number of medications that potentiate warfarin; most drinks on one occasion; and history of myocardial infarction, hypothyroidism, and deep vein thrombosis. Factor 7 −401G/T polymorphism (GG = 5.46 ± 3.50 mg and combined GT plus TT = 5.42 ± 2.54 mg; bivariate P=0.88) and factor 2 Thr165Met (ThrThr = 5.52 ± 3.55 mg and combined ThrMet plus MetMet = 5.28 ± 2.21 mg; bivariate P=0.99) were not significantly associated with maintenance dose.
For Caucasians the “best” dosing algorithm that estimated the daily warfarin maintenance dose from the above factors is shown in Table 2. The adjusted R2 was 0.43 for this model and for 51.02% of the Caucasians the predicted maintenance dose was within 1 mg of the observed (Figure 1). The model was more likely to underestimate the daily maintenance dose requirements (−1.57 ± 1.53 mg/day) than overestimate them (1.12 ± 0.96 mg/day). The performance of the model deteriorated using a lower cut-off in the backward elimination process (P>0.05; dropping gender and history of deep vein thrombosis) and by using VKORC1 1173C/T polymorphism as a linear term (data not shown).
Table 2.
Dosing algorithm for Caucasians in the multivariate linear regression model (outcome variable is log warfarin maintenance dose per day).*
| Variable† | N | Regression coefficient
(95% CI) |
|---|---|---|
| Intercept | 147 | 2.74 (2.38 to 3.10) |
| Age | 147 | −0.01 (−0.01 to 0.00) |
| VKORC1 1173 (CT=1) | 74 | −0.40 (−0.53 to −0.27) |
| VKORC1 1173 (TT=1) | 13 | −0.82 (−1.05 to −0.59) |
| CYP2C9 (any*2=1) | 42 | −0.21 (−0.36 to −0.07) |
| CYP2C9 (any*3=1) | 18 | −0.32 (−0.52 to −0.12) |
| BMI (less than 25=1) | 50 | −0.18 (−0.35 to −0.01) |
| BMI (25 to 30=1) | 59 | −0.19 (−0.35 to −0.03) |
| Number of medications that potentiate warfarin | 147 | −0.08 (−0.14 to −0.03) |
| Most drinks on one occasion | 147 | 0.03 (0.00 to 0.05) |
| History of deep vein thrombosis (yes=1) | 16 | 0.21 (0.01 to 0.41) |
| Gender (female=1) | 43 | −0.13 (−0.27 to 0.02) |
Dose (mg/day) = exp[2.74 −(0.01 X age) −(0.40 X VKORC1 1173CT) −(0.82 X VKORC1 1173TT) −(0.21 X CYP2C9 any*2) −(0.32 X CYP2C9 any*3) −(0.18 X BMI <25) −(0.19 X BMI 25 to 30) −(0.08 X number of medications that potentiate warfarin) +(0.03 X most alcoholic drinks on one occasion) +(0.21 X history of deep vein thrombosis) −(0.13 X female)]
Age, number of medications that potentiate warfarin, and most drinks on one occasion were entered as linear terms in the model and dummy variables (0=absent, 1=present) for the other variables.
Figure 1. Predicted Maintenance Dose versus Observed Maintenance Dose for the Caucasian algorithm.
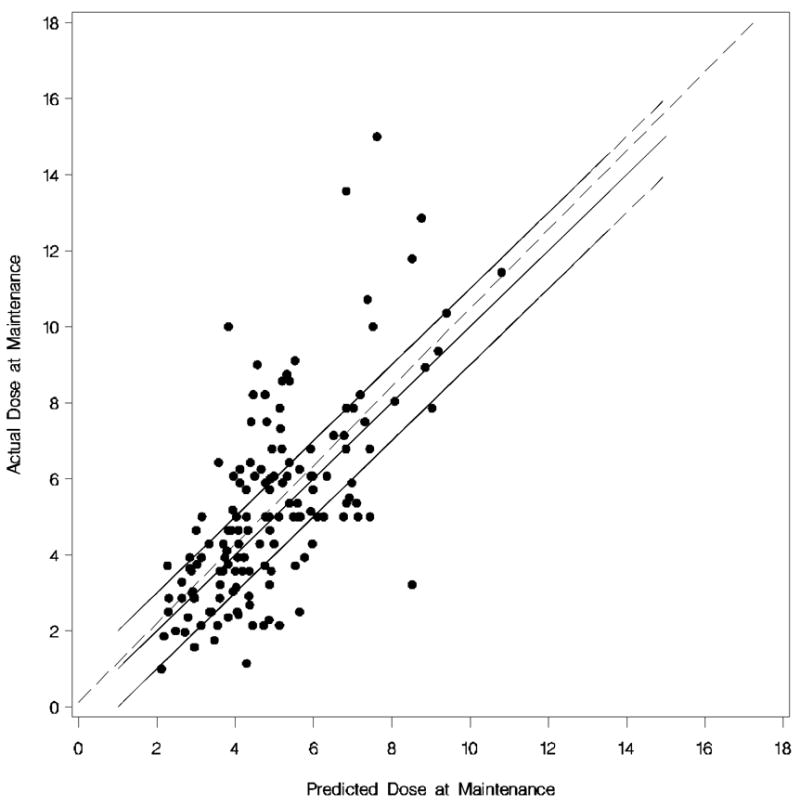
Each dot represents the observed versus predicted dose of each Caucasian. The dotted line is the linear regression line. The upper solid line is (predicted + 1 mg) of the actual dose, the middle solid line (i.e. 45% degree line) is perfect prediction, and the lower solid line is (predicted −1 mg) of the actual dose.
Model building in African Americans
In African Americans, age; BMI; VKORC1 1173C/T polymorphism; APOE E2/E3/E4 polymorphisms; factor 7 −401G/T polymorphism; number of medications that potentiate warfarin; indication for warfarin; and history of myocardial infarction, pulmonary embolism, and cancer had a bivariate P<0.20. Factor 7 −401G/T polymorphism (GG = 6.46 ± 3.08 mg and combined GT plus TT = 5.61 ± 2.70 mg; bivariate P=0.14) and factor 2 Thr165Met (ThrThr = 5.96 ± 2.96 mg and combined ThrMet plus MetMet = 6.39 ± 2.28 mg; bivariate P=0.46) were not statistically significantly associated with maintenance dose.
The “best” dosing algorithm (backward elimination P>0.10) that estimated the daily warfarin dose (in mg/day) is shown in Table 3. The adjusted R2 was 0.28 for this model and 36.61% of the African Americans doses were predicted within 1 mg of the observed dose (Figure 2). Similar to the model for Caucasians, this model for African Americans was more likely to underestimate the daily maintenance dose requirements (mean difference = −2.02 ± 2.03 mg/day) than overestimate them (mean difference = 1.47 ± 0.97 mg/day). Using a lower cut-off (P>0.05) in the backward elimination process, none of the variables dropped out of the model.
Table 3.
Dosing algorithm for African Americans in the multivariate linear regression model (outcome variable is log warfarin maintenance dose per day). *
| Variable† | N | Regression coefficient
(95% CI) |
|---|---|---|
| Intercept | 112 | 2.66 (2.33 to 2.98) |
| Age | 112 | −0.01 (−0.01 to 0.00) |
| VKORC1 1173 (CT or TT=1) | 17 | −0.36 (−0.57 to −0.14) |
| Factor 7 −401 (GT=1) | 47 | −0.19 (−0.35 to −0.02) |
| Factor 7 −401 (TT=1) | 10 | −0.25 (−0.53 to 0.04) |
| APOE (E3/E3 or E2/E4=1) | 61 | −0.21 (−0.39 to −0.04) |
| APOE (E2/E2 or E2/E3=1) | 17 | −0.28 (−0.53 to −0.03) |
| BMI (less than 25=1) | 32 | −0.19 (−0.37 to −0.01) |
| BMI (25 to 30=1) | 30 | −0.25 (−0.44 to −0.06) |
| Number of medications that potentiate warfarin | 112 | −0.09 (−0.15 to −0.03) |
Dose (mg/day) = exp[2.66 −(0.01 X age) −(0.36 X VKORC1 1173CT or 1173TT) −(0.19 X Factor 7 −401GT) −(0.25 X Factor 7 −401TT) −(0.28 X APOE E2/E2 or E2/E3) −(0.21 X APOE E3/E3 or E2/E4) −(0.19 X BMI <25) −(0.25 X BMI 25 to 30) −(0.09 X number of medications that potentiate warfarin)]
Age and number of medications that potentiate warfarin were entered as linear terms in the model and dummy variables (0=absent, 1=present) for the other variables.
Figure 2. Predicted Maintenance Dose versus Observed Maintenance Dose for the African American algorithm.
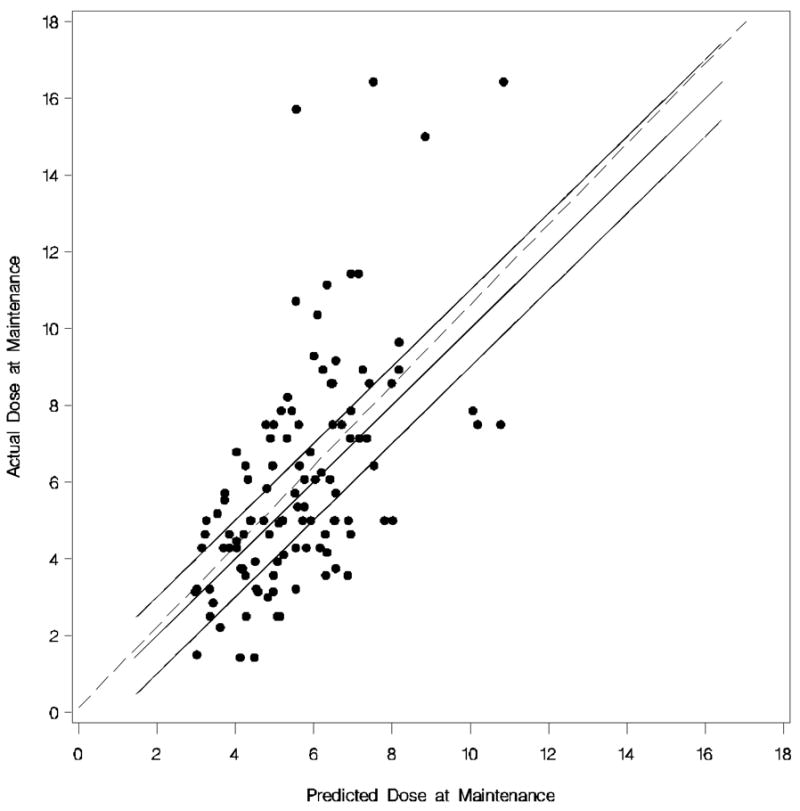
Each dot represents the observed versus predicted dose of each African American. The dotted line is the linear regression line. The upper solid line is (predicted + 1 mg) of the actual dose, the middle solid line (i.e. 45% degree line) is perfect prediction, and the lower solid line is (predicted −1 mg) of the actual dose.
Model building in the combined cohort of Caucasians and African Americans
Different from the Caucasian or African American models, in the race combined model smoking and history of other heart disease (defined as heart disease not specified per patient report) had a P<0.20. However, neither ended up in the final dosing algorithm.
The “best” dosing algorithm for estimating warfarin maintenance dose is shown in Table 4. The adjusted R2 was 0.37 for this model and the predicted maintenance dose was within 1 mg of the observed dose for 51.02% of the Caucasians and 39.29% of the African Americans (Figure 3). The model was more likely to underestimate the daily maintenance dose requirements (Caucasians = −1.53 ± 1.57 mg/day and African Americans = −2.18 ± 2.08) than overestimate (Caucasians = 1.13 ± 0.93 mg/day and African Americans = 1.33 ± 1.05). Adding the APOE polymorphisms improved the performance of the algorithm marginally (51.70% of the Caucasians and 40.18% of the African American had a predicted dose within 1 mg/day of the observed dose; adjusted R2 was 0.38). The model performance deteriorated when a lower cut-off was used in the backward elimination process (P>0.05; dropping gender and factor 7 polymorphism), by using VKORC1 1173C/T polymorphism as a linear term, and without appropriate race-interaction terms (data not shown).
Table 4.
Dosing algorithm for African Americans and Caucasians in the multivariate linear regression model (outcome variable is log warfarin maintenance dose per day).*
| Variable† | N | Regression coefficient
(95% CI) |
|---|---|---|
| Intercept | 259 | 2.81 (2.45 to 3.17) |
| Race (African Americans=1) | 112 | −0.08 (−0.22 to 0.06) |
| Age | 259 | −0.01 (−0.01 to −0.01) |
| VKORC1 1173 (CT=1) | 90 | −0.39 (−0.50 to −0.27) |
| VKORC1 1173 (TT=1) | 14 | −0.82 (−1.04 to −0.59) |
| Factor 7 −401 (GT=1) | 81 | −0.11 (−0.22 to 0.00) |
| Factor 7 −401 (TT=1) | 14 | −0.19 (−0.42 to 0.03) |
| CYP2C9 (any*2=1) | 52 | −0.16 (−0.29 to −0.03) |
| CYP2C9 (any*3=1) | 18 | −0.30 (−0.50 to −0.10) |
| BMI (less than 25=1) | 82 | −0.18 (−0.30 to −0.06) |
| BMI (25 to 30=1) | 89 | −0.23 (−0.35 to −0.10) |
| Number of medications that potentiate warfarin | 259 | −0.08 (−0.12 to −0.04) |
| Most drinks on one occasion | 259 | 0.06 (0.01 to 0.11) |
| History of deep vein thrombosis (yes=1) | 38 | 0.58 (0.12 to 1.03) |
| Gender (female=1) | 89 | −0.10 (−0.20 to 0.01) |
| Race x history of deep vein thrombosis (yes and African American=1) | 237 | −0.33 (−0.61 to −0.05) |
| Race x most drinks on one occasion | 147 | −0.03 (−0.06 to 0.00) |
Dose (mg/day) = exp[2.81 −(0.08 X African American) −(0.01 X age) −(0.39 X VKORC1 1173CT) −(0.82 X VKORC1 1173TT) −(0.11X Factor 7 −401GT) −(0.19X Factor 7 −401TT) −(0.16 X CYP2C9 any*2) −(0.30 X CYP2C9 any*3) −(0.18 X BMI <25) −(0.23 X BMI 25 to 30) –(0.08 X number of medications that potentiate warfarin) −(0.10 X female) +(0.06 X most alcoholic drinks on one occasion) −(0.03 X African American x most drinks on one occasion) +(0.58 X history of deep vein thrombosis) −(0.33 X African American x history of deep vein thrombosis)]
Age, number of medications that potentiate warfarin, and most drinks on one occasion were entered as linear terms in the model and dummy variables (0=absent, 1=present) for the other variables.
Figure 3. Predicted Maintenance Dose versus Observed Maintenance Dose for the Caucasian and African American algorithm.
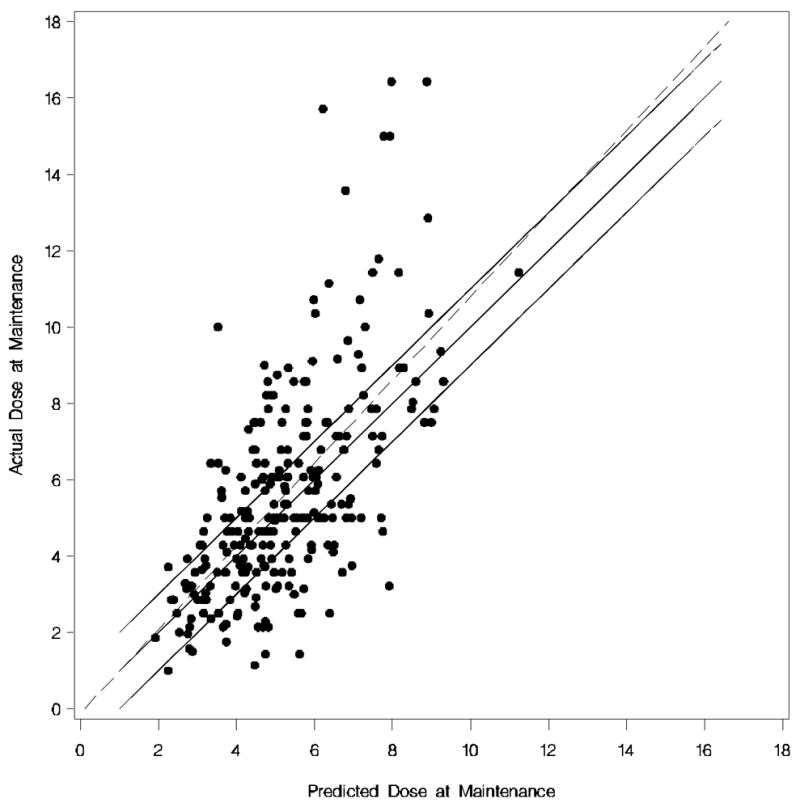
Each dot represents the observed versus predicted dose of each Caucasian and African American. The dotted line is the linear regression line. The upper solid line is (predicted + 1 mg) of the actual dose, the middle solid line (i.e. 45% degree line) is perfect prediction, and the lower solid line is (predicted −1 mg) of the actual dose.
Validation of the other previously published models in our cohort of Caucasians and African Americans and comparison with empiric 5 mg dosing
All models that published their algorithm coefficients and for which we had the relevant genotype data were tested in our cohort (Table 5). In Caucasians the unadjusted R2 values were 0.06 and 0.21 for the two models with CYP2C9 and 0.37, 0.39 and 0.43 for the three models with CYP2C9 and VKORC1. The proportion of Caucasians whose predicted values were within 1 mg of the observed dose was 32.65 and 42.18% (for models which included CYP2C9) and 42.07, 45.58 and 48.28% (for models which included CYP2C9 and VKORC1). The results of the models with CYP2C9 and VKORC1 were similar to our cross-validated algorithm (race specific/combined model: 46.94/48.30% within 1 mg; R2=0.37/0.31). All algorithms performed better than giving empirically 5 mg/day (28.57% within 5 ± 1 mg).
Table 5.
Validation results of other algorithms in our cohort and cross validation of our models
| Model | # Variables | N Caucasians | R2 in Caucasians | % within 1 mg in Caucasians | N African Americans | R2 in African Americans | % within 1 mg in African Americans |
|---|---|---|---|---|---|---|---|
| Empirical 5mg | 0 | 147 | NA | 28.57% | 112 | NA | 33.93% |
| Hillman et al.17† | 12 | 147 | 0.06 | 32.65% | 112 | 0.18 | 37.50% |
| Gage et al.20* | 9 | 147 | 0.21 | 42.18% | 112 | 0.28 | 29.46% |
| Sconce et al. 21‡ | 5 | 145 | 0.38 | 42.07% | 109 | 0.23 | 41.28% |
| Gage et al. 22§ | 10 | 145 | 0.42 | 48.28% | 109 | 0.34 | 33.94% |
| Anderson et al.23|| | 10 | 147 | 0.39 | 45.58% | 112 | 0.32 | 37.50% |
| Cross validation of our race-specific models #;, ** | 11 #/10** | 147 | 0.37 | 46.94% | 112 | 0.23 | 33.93% |
| Cross validation of our race combined model †† | 16 | 147 | 0.31‡‡ | 48.30% | 112 | 0.31‡‡ | 33.93% |
Gage et al. algorithm; dose (mg/day) = exp[0.385 −(0.0083 X age) +( 0.498 X BSA) – ( 0.208 X CYP2C9*2) −( 0.350 X CYP2C9*3) −( 0.341 X amiodarone) + ( 0.378 X Target INR) −( 0.125 X simvastatin) −(0.113 X race) −( 0.075 X female)]
Hillman et al. algorithm; dose (mg/week) =exp[1.654 + (0.429 X CYP2C9 *2 or *3) + (−0.274 X CYP2C9*3) + (0.221 X valve replacement) + (−0.035 X age) + (2.886 X BSA) + (0.936 X diabetes mellitus) + (0.0002 X age2) + (−0.604 X BSA2) + (−0.014 X age*diabetes mellitus) + (−0.305 X BSA*CYP2C9 *2 or *3) + (0.129 X diabetes mellitus*CYP2C9 *2 or *3)]
Sconce et al. algorithm; vDose (mg/day)= 0.628 − 0.0135 (Age)−0.240 (CYP*2)− 0.370(CYP*3) − 0.241 (VKOR)+0.0162 (Height)
Gage et al. algorithm; Dose (mg/day) = exp[0.9751 −(0.3238 X VKORC1 −1639G/A) + (0.4317 X BSA) −(0.00745 X age) −(0.4008 X CYP2C9*3) −(0.2066 X CYP2C9*2) + (0.2029 X Target INR) −(0.2538 X amiodarone) + (0.0922 X smokes) −(0.0901 X African American race) + (0.0664 X DVT/PE)]
Anderson algorithm (mg/week); dose =1.64+exp[3.984+CYP2C9*1*1(0)+*1*2(−0.197)+*1*3(−0.360)+*2*3(−0.947)+*2*2(−0.265)+*3*3(−1.892)+Vk-CT(−0.304)+Vk-TT(−0.569)+Vk-CC(0)+age(−0.009)+male sex(0.094)+female sex(0)+weight in kg(0.003)]
See Table 1
See Table 2
See Table 3
R2 estimate in the race combined cohort
In African Americans the unadjusted R2 values were 0.18 and 0.28 for the models with CYP2C9 and 0.23, 0.32 and 0.34 for the models with CYP2C9 and VKORC1. The proportion of African Americans whose predicted maintenance dose was within 1 mg of the observed dose was 29.46 and 37.50% (for models which included CYP2C9) and 33.03, 37.50, and 41.28% (for the models which included CYP2C9 and VKORC1). This was similar to the result obtained from cross-validating our model (race specific/combined model: 33.93%/33.93% within 1 mg; R2=0.23/0.31) and giving 5 mg/day empirically (33.93% within 5 ± 1 mg).
Discussion
The US Food and Drug Administration (FDA) recently approved changing the labeling for warfarin to include information on how persons with certain genetic differences in CYP2C9 and VKORC1 genes may respond to warfarin. However, currently it is unknown whether genetic testing will be useful for predicting dose. In this prospective cohort study, we attempted to develop dosing algorithms for Caucasians and African Americans using clinical, environmental, and seven genetic factors. The algorithms for Caucasians performed better than giving 5 mg empirically, although the algorithms explained less than half of the variability in maintenance dose. The final dosing algorithms for African Americans performed only marginally better than empirically giving each African American warfarin initiator 5 mg. These results were similar to the results we obtained from testing other algorithms in our cohort.17, 20–23
Most of the variables in our algorithms (age, VKORC1 polymorphism, CYP2C9 polymorphisms, factor 7 polymorphism, interacting medication, race, gender, and BMI/BSA) are candidates for predicting maintenance dose, because they have been included in other models.11, 14, 17, 18, 20–23 APOE polymorphisms, alcohol intake, and history of deep vein thrombosis had not previously been included in any published algorithm. To test whether specific variables in our algorithms did not actually improve the algorithm’s performance, we also tested a lower cut-off point (P>0.05 instead of P>0.10) in the stepwise backward process. History of deep venous thrombosis was no longer included in the Caucasian algorithm. However, with exclusion of this variable, the algorithm performed worse. In addition, the regression coefficients in the cross-validation analyses were stable (narrow 95% CI around the regression coefficients) in all algorithms.
Although our data do not provide a direct explanation for the lower prediction capability in African Americans, we can postulate that there may be other genes or environmental factors that have a stronger influence in African Americans compared to Caucasians. For example, most of the polymorphisms that were included in the models have previously only been studied in Caucasians and Asians and may have less impact on warfarin dose requirements in African Americans. This is likely to be true of the CYP2C9 polymorphisms, by virtue of the relative rarity of the *2 and *3 alleles in African Americans.15 Therefore, genotyping other CYP2C9 polymorphisms in African Americans might be beneficial, for example CYP2C9*5, *6,*9, and *11.27 In addition, any association between the studied polymorphisms and the causative polymorphism(s) that determines warfarin maintenance dose might be weaker in African Americans compared with Caucasians due to different linkage disequilibrium (LD) structures.28, 29 For example, it has been shown that the 1173C/T polymorphism alone was as informative as VKORC1 haplotypes for predicting warfarin dose in a Caucasian population, but not in an African American population.8 Another possibility is that, despite the extensive data collection, we did not measure factors that have an effect on warfarin maintenance dose in the African Americans or that, due to the smaller number of African Americans in our cohort, we did not identify factors with modest predictive ability. However, even when we included additional variables in the race combined algorithm (CYP2C9 polymorphisms, most drinks on one occasion, history of deep vein thrombosis, and appropriate race-interaction terms) the proportion of African Americans for whom the predicted maintenance dose was within 1 mg of the observed dose was not improved in the cross-validation dataset. In addition, when we tested the Caucasian algorithm on the African Americans in our cohort the model performance was considerably lower than with the African American or race combined algorithm.
A limitation of our study is that we only included seven polymorphisms in five genes, and that other genes and polymorphisms might be associated with warfarin dose.30 Adding more genetic factors and more polymorphisms per gene could improve performance of the dosing algorithms. Another limitation is our sample size, which might have resulted in less precise estimates for the coefficients thereby leading to the possibility that our dosing algorithms included only factors with a high frequency and/or a strong effect on warfarin dose. In addition, the small sample size mandated the evaluation of drugs that potentiate warfarin as a combined group rather than as single variables. Another limitation is that our algorithms were not validated in an independent dataset, but by cross-validation in our cohort (internal instead of external validation). This was intended to give an estimate of the predictive ability that could be expected when these algorithms are applied in another dataset. However, the result could have been an overestimation of our predictive ability, because we were not able to account for the variability in the model selection (that is, if we would apply the same model selection procedure in a different dataset, we might have ended up with a somewhat different model). Furthermore, we included only subjects with a target INR between 2 to 3, although this is the target range in the vast majority of patients prescribed warfarin. Thus, our algorithms may have a lower predictive ability in subjects with higher target INRs; this concern is highlighted by the study of Gage et al.20 in which target INR was an independent predictor of warfarin maintenance dose. In addition, we could not directly assess whether the use of a dosing algorithm is superior to empiric dosing, which would require a prospective randomized trial to adequately test. However, in a recent prospective trial (94% Caucasian) the genetic dosing algorithm of Anderson et al. (developed in Caucasians) did not significantly reduce the per-patient average percentage of INRs outside the therapeutic range (primary endpoint) compared with a clinical dosing algorithm despite the fact that the genetic dosing algorithm did significantly decrease the number of dose adjustments required to reach maintenance dose (secondary outcome).23
In conclusion, this study has demonstrated that the dosing algorithms developed by us and other published algorithms perform better than giving 5 mg empirically, especially in Caucasians. However, in African Americans our algorithms and other published algorithms performed only marginally better. Importantly, all algorithms explained <50% of the variability. Therefore, since these algorithms may not reduce the risk for over- and under-coagulation compared to empiric dosing (especially in African Americans), more information (for example, additional genetic factors or studies in larger cohorts) is most likely needed to develop a clinically useful algorithm (or algorithms) that can maximally predict warfarin dose for all races. In addition, further testing of any algorithm in a randomized trial should be performed to assess the clinical utility of any dosing algorithm proposed for clinical practice.
Materials and methods
Study population and data collection
From April 2002 through December 2005, subjects were prospectively recruited at three anticoagulation clinics: the Hospital of the University of Pennsylvania (HUP), the Philadelphia Veterans Affairs Medical Center (PVAMC) in Philadelphia, PA, and the Penn State Milton S. Hershey Medical Center (HMC) in Hershey, PA. All subjects 21 years and older and initiating warfarin therapy once daily with a target INR of 2.0 to 3.0 who presented to one of the clinics were considered eligible for the study. Subjects with abnormal INRs prior to initiating warfarin and those with anti-phospholipid antibody in whom the INR measurement may not be valid were excluded.31 The study was approved by the Institutional Review Boards of each participating hospital, and all subjects provided informed, written consent. In total, 380 Caucasians and African Americans were included in this study, of which 295 reached maintenance dose (82% of the Caucasians and 72% of the African Americans).
Data on patient demographics, medical history, medication use (including over the counter medications), warfarin dose, vitamin K intake, and diet were obtained prospectively by trained study interviewers using standardized questionnaires. Genomic DNA was obtained from buccal swabs and was analyzed by collaborative investigators blinded to patient characteristics or outcomes.
Genotyping
DNA was extracted from buccal swab preparations using a method adapted from Richards et al.32 Two sets of swabs were taken from each participant and 10% of the second swabs were used for validation of methods and results.
Genotyping of the CYP2C9 *2 (rs1799853) and *3 (rs1057910) alleles, VKORC1 1173C/T (rs9934438) and −1639G/A (rs9923231) polymorphisms, and APOE polymorphisms (rs429358 and rs7412) were genotyped in the same cohort and the association between warfarin dosing and these genetic variants has been described in the paper of Kealey et al,15 Kimmel et al,33 and Schelleman et al.16 In addition, we genotyped two additional variants in the factor 2 and 7 genes, which have been associated with warfarin dose by others34 (not described previously in this cohort).
The factor 2 Thr165Met polymorphism (rs5896) was PCR amplified in 25μl reactions in PCR buffer that contained 5μl of genomic DNA, 5mM forward [5′-GAGAACAGGGAGCAAGCTA-3′] and reverse [5′-GTCGTAGGGACAGACACCAT-3′] primers, 200μM dNTPs, 1X PCR buffer (Qiagen; Valencia, California), and 1U Hotstar Taq Polymerase (Qiagen). Thermocycling conditions consisted of 95ºC for 15 minutes, followed by 35 cycles of 95ºC for 40 seconds, 61ºC for 40 seconds, and 72ºC for 40 seconds, with a final extension step of 72ºC for 5 minutes. The 203 bp product was digested with 3μl NCO1. The products were separated on 12% polyacrylamide gels and visualized by ethidium bromide staining and UV illumination.
The factor 7 −401G/T polymorphism (rs510355) was PCR amplified in 25μl reactions in PCR buffer that contained 5μl of genomic DNA, 500nM forward [5′-TAAGAAACCAGCCTCCCTTG-3′] and reverse [5′-CGTGCAGGTGTTAAGGTGTG-3′] primers, 200μM dNTPs, 1X PCR buffer (Qiagen), and 1.25U Hotstar Taq Polymerase (Qiagen). Thermocycling conditions consisted of 95ºC for 15 minutes, followed by 40 cycles of 95ºC for 40 seconds, 59ºC for 40 seconds, and 72ºC for 40 seconds, with a final extension step of 72ºC for 5 minutes. The PCR purification was done using Edge BioSystems Plates (Edge Biosystems; Gaithersburg, Maryland). Sequencing was performed with 1.1 μM forward primer, 6μl of the PCR mix, and 4μl Big Dye Terminator mixture (v. 3.1. cycle sequencing) on an ABI 3730XL DNA Analyzer (Applied Biosystems, Foster City, California) and analyzed with Sequencing Analysis software v. 5.2 (Applied Biosystems). Genotype frequencies were in Hardy-Weinberg equilibrium.
Statistical analysis
Maintenance dose of warfarin was defined as the dose that led to a stable INR over three consecutive visits following initiation of the drug, as previously described.8 The distribution of the warfarin maintenance dose was right-skewed and was log-transformed in an effort to achieve constant variance and normality. Linear regression models were fitted to model the relationship between maintenance dose and each clinical, environmental, and genetic variable. Variables with a P<0.20 in bivariate analysis, all genetic factors, and variables previously shown to alter warfarin dose requirements (i.e. age, gender, body mass index (BMI)/body surface area (BSA), indication for warfarin, and history of heart failure, coronary artery disease, and diabetes mellitus6, 20, 35) were assessed in a multivariable model, from which variables with a P>0.10 were eliminated sequentially (backward elimination process).11 We also assessed the model performance using a lower cut-off (P>0.05) in the backward elimination model. In total, three separate models were developed: one in Caucasians, one in African Americans, and one in both with appropriate race-interaction terms. The performance of the algorithms was determined by the adjusted R2 and the percentage of predicted maintenance dose that was within 1 mg of the observed maintenance dose. This cut-off was chosen, because a 1 mg/day change in warfarin dose from 5 mg/day is sufficient to change the INR by 0.5.36 This is a clinically meaningful difference when trying to maintain a patient within a 1 point INR range.
To estimate the predictive ability that might be expected when our algorithms are applied in another independent dataset, we cross validated the algorithm by removing one subject at a time from the cohort and then re-estimating the model coefficients and applying this ‘new’ algorithm to predict dose in the person that was removed from the cohort. In addition, to estimate the stability of the model, we retained all regression coefficients of the cross-validation and calculated the mean and 95% CI of the regression coefficients. For testing the performance of the published dosing algorithms in predicting warfarin dose in Caucasians and African Americans, we applied the published algorithm to our cohort and determined the R2 and percentage within 1 mg. All analyses were performed using SAS version 9.1 (SAS Institute, Cary, NC).
Acknowledgments
This study was funded by NIH grant R01HL066176, Dr. Kimmel was supported by NIH grants P20RR020741 and K24HL070936, and Dr. Whitehead was supported by NIH grant P20RR020741. The funding agencies had no role in the design and conduct of the study; collection, management, analysis, and interpretation of the data; or preparation, review, or approval of the manuscript.
The authors thank Joseph A. Gascho, MD and Francis Herrmann, BS, RPh at HMC; Mitchell Laskin, RPh at HUP; and Mabel Chin, PharmD at the PVAMC for their dedication to our field work. Dr. Kimmel and Schelleman had full access to all of the data in the study and take responsibility for the integrity of the data and the accuracy of the data analysis. The factor 2 and factor 7 data will be deposited in PharmGKB (www.pharmgkb.org).
Abbreviations
- INR
International normalized ratio
- CYP2C9
Cytochrome P450, family 2, subfamily C, polypeptide 9
- VKORC1
Vitamin K epoxide reductase complex, subunit 1
- APOE
Apolipoprotein E
- 95% CI
95% confidence intervals
- BMI
Body mass index
- BSA
Body surface area
References
- 1.Breckenridge AM. Interindividual differences in the response to oral anticoagulants. Drugs. 1977;14:367–75. doi: 10.2165/00003495-197714050-00003. [DOI] [PubMed] [Google Scholar]
- 2.Harrison L, et al. Comparison of 5-mg and 10-mg loading doses in initiation of warfarin therapy. Ann Intern Med. 1997;126:133–6. doi: 10.7326/0003-4819-126-2-199701150-00006. [DOI] [PubMed] [Google Scholar]
- 3.Ansell J, et al. The pharmacology and management of the vitamin K antagonists: the Seventh ACCP Conference on Antithrombotic and Thrombolytic Therapy. Chest. 2004;126:204S–233S. doi: 10.1378/chest.126.3_suppl.204S. [DOI] [PubMed] [Google Scholar]
- 4.Fihn SD, et al. The risk for and severity of bleeding complications in elderly patients treated with warfarin. The National Consortium of Anticoagulation Clinics. Ann Intern Med. 1996;124:970–9. doi: 10.7326/0003-4819-124-11-199606010-00004. [DOI] [PubMed] [Google Scholar]
- 5.Reynolds MW, et al. Warfarin anticoagulation and outcomes in patients with atrial fibrillation: a systematic review and metaanalysis. Chest. 2004;126:1938–45. doi: 10.1378/chest.126.6.1938. [DOI] [PubMed] [Google Scholar]
- 6.Garcia D, Regan S, Crowther M, Hughes RA, Hylek EM. Warfarin maintenance dosing patterns in clinical practice: implications for safer anticoagulation in the elderly population. Chest. 2005;127:2049–56. doi: 10.1378/chest.127.6.2049. [DOI] [PubMed] [Google Scholar]
- 7.D’Andrea G, et al. A polymorphism in the VKORC1 gene is associated with an interindividual variability in the dose-anticoagulant effect of warfarin. Blood. 2005;105:645–9. doi: 10.1182/blood-2004-06-2111. [DOI] [PubMed] [Google Scholar]
- 8.Rieder MJ, et al. Effect of VKORC1 haplotypes on transcriptional regulation and warfarin dose. N Engl J Med. 2005;352:2285–93. doi: 10.1056/NEJMoa044503. [DOI] [PubMed] [Google Scholar]
- 9.Sanderson S, Emery J, Higgins J. CYP2C9 gene variants, drug dose, and bleeding risk in warfarin-treated patients: a HuGEnet systematic review and meta-analysis. Genet Med. 2005;7:97–104. doi: 10.1097/01.gim.0000153664.65759.cf. [DOI] [PubMed] [Google Scholar]
- 10.Wadelius M, et al. Common VKORC1 and GGCX polymorphisms associated with warfarin dose. Pharmacogenomics J. 2005;5:262–70. doi: 10.1038/sj.tpj.6500313. [DOI] [PubMed] [Google Scholar]
- 11.Herman D, Peternel P, Stegnar M, Breskvar K, Dolzan V. The influence of sequence variations in factor VII, gamma-glutamyl carboxylase and vitamin K epoxide reductase complex genes on warfarin dose requirement. Thromb Haemost. 2006;95:782–7. [PubMed] [Google Scholar]
- 12.Li T, et al. Polymorphisms in the VKORC1 gene are strongly associated with warfarin dosage requirements in patients receiving anticoagulation. J Med Genet. 2006;43:740–4. doi: 10.1136/jmg.2005.040410. [DOI] [PMC free article] [PubMed] [Google Scholar]
- 13.Osman A, Enstrom C, Arbring K, Soderkvist P, Lindahl TL. Main haplotypes and mutational analysis of vitamin K epoxide reductase (VKORC1) in a Swedish population: a retrospective analysis of case records. J Thromb Haemost. 2006;4:1723–9. doi: 10.1111/j.1538-7836.2006.02039.x. [DOI] [PubMed] [Google Scholar]
- 14.Takahashi H, et al. Different contributions of polymorphisms in VKORC1 and CYP2C9 to intra- and inter-population differences in maintenance dose of warfarin in Japanese, Caucasians and African-Americans. Pharmacogenet Genomics. 2006;16:101–10. doi: 10.1097/01.fpc.0000184955.08453.a8. [DOI] [PubMed] [Google Scholar]
- 15.Kealey C, et al. Warfarin and cytochrome P450 2C9 genotype: possible ethnic variation in warfarin sensitivity. Pharmacogenomics. 2007;8:217–25. doi: 10.2217/14622416.8.3.217. [DOI] [PubMed] [Google Scholar]
- 16.Schelleman H, et al. Warfarin response and vitamin K epoxide reductase complex 1 in African Americans and Caucasians. Clin Pharmacol Ther. 2007;81:742–7. doi: 10.1038/sj.clpt.6100144. [DOI] [PubMed] [Google Scholar]
- 17.Hillman MA, et al. Relative impact of covariates in prescribing warfarin according to CYP2C9 genotype. Pharmacogenetics. 2004;14:539–47. doi: 10.1097/01.fpc.0000114760.08559.dc. [DOI] [PubMed] [Google Scholar]
- 18.Shikata E, et al. Association of pharmacokinetic (CYP2C9) and pharmacodynamic (factors II, VII, IX, and X; proteins S and C; and gamma-glutamyl carboxylase) gene variants with warfarin sensitivity. Blood. 2004;103:2630–5. doi: 10.1182/blood-2003-09-3043. [DOI] [PubMed] [Google Scholar]
- 19.Voora D, et al. Prospective dosing of warfarin based on cytochrome P-450 2C9 genotype. Thromb Haemost. 2005;93:700–5. doi: 10.1160/TH04-08-0542. [DOI] [PubMed] [Google Scholar]
- 20.Gage BF, et al. Use of pharmacogenetics and clinical factors to predict the maintenance dose of warfarin. Thromb Haemost. 2004;91:87–94. doi: 10.1160/TH03-06-0379. [DOI] [PubMed] [Google Scholar]
- 21.Sconce EA, et al. The impact of CYP2C9 and VKORC1 genetic polymorphism and patient characteristics upon warfarin dose requirements: proposal for a new dosing regimen. Blood. 2005;106:2329–33. doi: 10.1182/blood-2005-03-1108. [DOI] [PubMed] [Google Scholar]
- 22.Gage B, et al. Use of pharmacogenetic and clinical factors to predict the therapeutic dose of warfarin. Clin Pharmacol Ther. doi: 10.1038/clpt.2008.10. in press. [DOI] [PMC free article] [PubMed] [Google Scholar]
- 23.Anderson JL, et al. Randomized trial of genotype-guided versus standard warfarin dosing in patients initiating oral anticoagulation. Circulation. 2007;116:2563–70. doi: 10.1161/CIRCULATIONAHA.107.737312. [DOI] [PubMed] [Google Scholar]
- 24.Wu AHB, et al. Dosing algorithm for warfarin using CYP2C9 and VKORC1 genotyping from a multi-ethnic population: comparison from other equations. Pharmacogenomics. 2008;9:169–78. doi: 10.2217/14622416.9.2.169. [DOI] [PubMed] [Google Scholar]
- 25.White RH. The epidemiology of venous thromboembolism. Circulation. 2003;107:I4–8. doi: 10.1161/01.CIR.0000078468.11849.66. [DOI] [PubMed] [Google Scholar]
- 26.Snow V, et al. Management of venous thromboembolism: a clinical practice guideline from the American College of Physicians and the American Academy of Family Physicians. Ann Intern Med. 2007;146:204–10. doi: 10.7326/0003-4819-146-3-200702060-00149. [DOI] [PubMed] [Google Scholar]
- 27.Limdi NA, et al. Influence of CYP2C9 genotype on warfarin dose among African-Americans and European-Americans. Personalized Medicine. 2007;4:157–69. doi: 10.2217/17410541.4.2.157. [DOI] [PMC free article] [PubMed] [Google Scholar]
- 28.Carlson CS, et al. Additional SNPs and linkage-disequilibrium analyses are necessary for whole-genome association studies in humans. Nat Genet. 2003;33:518–21. doi: 10.1038/ng1128. [DOI] [PubMed] [Google Scholar]
- 29.Conrad DF, et al. A worldwide survey of haplotype variation and linkage disequilibrium in the human genome. Nat Genet. 2006;38:1251–60. doi: 10.1038/ng1911. [DOI] [PubMed] [Google Scholar]
- 30.Wadelius M, et al. Association of warfarin dose with genes involved in its action and metabolism. Hum Genet. 2007;121:23–34. doi: 10.1007/s00439-006-0260-8. [DOI] [PMC free article] [PubMed] [Google Scholar]
- 31.Moll S, Ortel TL. Monitoring warfarin therapy in patients with lupus anticoagulants. Ann Intern Med. 1997;127:177–85. doi: 10.7326/0003-4819-127-3-199708010-00001. [DOI] [PubMed] [Google Scholar]
- 32.Richards B, et al. Multiplex PCR amplification from the CFTR gene using DNA prepared from buccal brushes/swabs. Hum Mol Genet. 1993;2:159–63. doi: 10.1093/hmg/2.2.159. [DOI] [PubMed] [Google Scholar]
- 33.Kimmel SE, et al. Apolipoprotein E genotype and warfarin dosing among Caucasians and African Americans. Pharmacogenomics J. 2008;8:53–60. doi: 10.1038/sj.tpj.6500445. [DOI] [PubMed] [Google Scholar]
- 34.D’Ambrosio RL, et al. Polymorphisms in factor II and factor VII genes modulate oral anticoagulation with warfarin. Haematologica. 2004;89:1510–6. [PubMed] [Google Scholar]
- 35.James AH, Britt RP, Raskino CL, Thompson SG. Factors affecting the maintenance dose of warfarin. J Clin Pathol. 1992;45:704–6. doi: 10.1136/jcp.45.8.704. [DOI] [PMC free article] [PubMed] [Google Scholar]
- 36.Cosh DG, Moritz CK, Ashman KJ, Dally RJ, Gallus AS. Prospective evaluation of a flexible protocol for starting treatment with warfarin and predicting its maintenance dose. Aust N Z J Med. 1989;19:191–7. doi: 10.1111/j.1445-5994.1989.tb00243.x. [DOI] [PubMed] [Google Scholar]