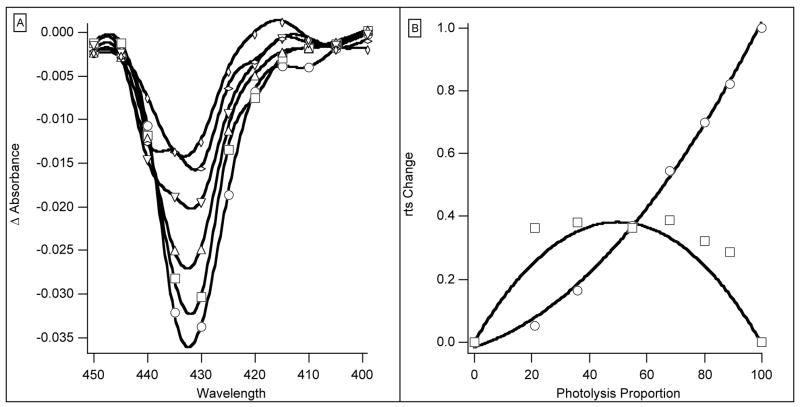
Figure 7.
(A) Spectra of rts components for L73M. Ordinate: Absorbance change for six photolysis intensities. The photolysis intensity was halved between each record. Abscissa: wavelength in nm. (B) L73M rts coefficients and photolysis. Ordinate: (○) Faster rts signal associated with Hb2 R to T change. (□) Slower rts signal associated with Hb2(CO). Lines represent simulations of each signal; symbols are experimental data. Abscissa: proportion of photolysis.

