

Abstract
Calcium is a key ion and is known to mediate signalling pathways between cytosol and mitochondria and modulate mitochondrial energy metabolism. To gain a quantitative, biophysical understanding of mitochondrial Ca2+ regulation, we developed a thermodynamically balanced model of mitochondrial Ca2+ handling and bioenergetics by integrating kinetic models of mitochondrial Ca2+ uniporter (CU), Na+–Ca2+ exchanger (NCE), and Na+–H+ exchanger (NHE) into an existing computational model of mitochondrial oxidative phosphorylation. Kinetic flux expressions for the CU, NCE and NHE were developed and individually parameterized based on independent data sets on flux rates measured in purified mitochondria. While available data support a wide range of possible values for the overall activity of the CU in cardiac and liver mitochondria, even at the highest estimated values, the Ca2+ current through the CU does not have a significant effect on mitochondrial membrane potential. This integrated model was then used to analyse additional data on the dynamics and steady-states of mitochondrial Ca2+ governed by mitochondrial CU and NCE. Our analysis of the data on the time course of matrix free [Ca2+] in respiring mitochondria purified from rabbit heart with addition of different levels of Na+ to the external buffer medium (with the CU blocked) with two separate models – one with a 2: 1 stoichiometry and the other with a 3: 1 stoichiometry for the NCE – supports the hypothesis that the NCE is electrogenic with a stoichiometry of 3: 1. This hypothesis was further tested by simulating an additional independent data set on the steady-state variations of matrix free [Ca2+] with respect to the variations in external free [Ca2+] in purified respiring mitochondria from rat heart to show that only the 3: 1 stoichiometry model predictions are consistent with the data. Based on these analyses, it is concluded that the mitochondrial NCE is electrogenic with a stoichiometry of 3: 1.
Calcium ion has multiple roles in mitochondrial function. Alteration of mitochondrial Ca2+ homeostasis can lead to mitochondrial dysfunction and cellular injury (Gunter et al. 1994; Bernardi, 1999; Duchen, 2000; Brookes et al. 2004; O'Rourke et al. 2005). Therefore, a quantitative, biophysical understanding of mitochondrial Ca2+ handling is critical to advance our current qualitative understanding of the role of Ca2+ in mitochondrial function/dysfunction.
Mitochondrial Ca2+ is regulated by a series of uniporters/channels and antiporters/exchangers located on the inner mitochondrial membrane (IMM). It is primarily governed by a kinetic balance between the uptake of Ca2+ via the Ca2+ uniporter (CU) and the extrusion of Ca2+ from the matrix through the Na+–Ca2+ exchanger (NCE) (Gunter & Pfeiffer, 1990; Gunter et al. 1994; Bernardi, 1999). In addition, there may be a Na+-independent Ca2+ exchange (NICE) pathway for extrusion of Ca2+ from the matrix, possibly a Ca2+–H+ exchanger (CHE) (Gunter et al. 1983; Brand, 1985a; Wingrove & Gunter, 1986a) that may have low activity in cardiac mitochondria at physiological levels of ΔpH across the IMM (Rizzuto et al. 1987).
Despite the importance of mitochondrial Ca2+ to cell physiology and pathophysiology, there are still significant gaps in our understanding of the functional properties of the mitochondrial Ca2+ transport systems. One of the fundamental issues is the stoichiometry of the mitochondrial NCE. The earliest studies by Crompton et al. (1976, 1977) using purified cardiac mitochondria revealed that Na+-dependent Ca2+ extrusion is rapid in respiring mitochondria and that the respiration-dependent trans-IMM [Ca2+] gradient is abolished by uncouplers. These results suggest a contribution of membrane potential to an electrogenic nNa+–Ca2+ exchange, such as a 3Na+–Ca2+ exchange that is apparent for sarcolemmal NCE (Mullins, 1979). Subsequently, Brand (1985b) showed that addition of an ionophore to respiring cardiac mitochondria did not disturb the steady-state trans-IMM [Ca2+] distribution maintained by the NCE and concluded that the antiport supports an electroneutral 2Na+–Ca2+ exchange. This conclusion was further supported by the reconstitution studies of Li et al. (1992) who reported that a purified NCE from heart mitochondria supports a Ca2+-dependent extrusion of Na+ that was not affected by uncouplers. Such evidence led to an apparent consensus that the mitochondrial NCE is electroneutral.
Recently, in a series of reports (Baysal et al. 1991, 1994; Jung et al. 1995), Jung and co-workers re-examined the nature of nNa+–Ca2+ exchange in the heart mitochondria. In one report (Baysal et al. 1991), it was observed that the antiporter is regulated by matrix pH and that the high rates of nNa+–Ca2+ exchange can be sustained when ΔpH (and hence [Na+] gradient) across the IMM approaches zero. This led to a null-point study (Baysal et al. 1994) in which it was established that the trans-IMM [Ca2+] gradients maintained by the NCE are too large to be sustained by a passive electroneutral exchange of one Ca2+ for two Na+. Later, Jung et al. (1995) re-examined the experimental protocol of Brand (1985b) using fluorescent probes to monitor the trans-IMM pH and [Ca2+] gradients. They reported that when pH gradient in respiring mitochondria is collapsed by addition of nigericin, a large [Ca2+]e: [Ca2+]x gradient is obtained. Addition of an uncoupler to dissipate membrane potential (ΔΨ) abolished this gradient. These studies led to the conclusion that the nNa+–Ca2+ exchange in cardiac mitochondria is not electroneutral and that there is a contribution of ΔΨ to the observed trans-IMM [Ca2+] gradient. However, a recent study by Paucek & Jaburek (2004) reported that proteoliposomes reconstituted with the purified mitochondrial Na+–Ca2+ antiporter from beef heart supports a passive electroneutral exchange of one Ca2+ for two Na+. Thus, the stoichiometry of the mitochondrial NCE remains unresolved.
Here we introduce a biophysical model of mitochondrial Ca2+ handling integrated into a previously developed computational model of mitochondrial bioenergetics (Beard, 2005). The integrated model is applied to analyse available experimental data (Cox & Matlib, 1993) on the kinetics of mitochondrial Na+–Ca2+ exchange and to characterize the stoichiometry of the exchange. Kinetic flux expressions for the CU, NCE and NHE were developed and individually parameterized based on independent data sets on cation fluxes measured in purified mitochondria. These models represent improvements over available models in the literature (Magnus & Keizer, 1997; Cortassa et al. 2003, 2006; Nguyen & Jafri, 2005; Nguyen et al. 2007) as the models are thermodynamically balanced and satisfactorily explain a large number of independent measurements. Our analysis of the data on the kinetics of mitochondrial NCE with two separate models – one with a 2: 1 stoichiometry and the other with a 3: 1 stoichiometry for the NCE – supports the hypothesis that the NCE is electrogenic with a stoichiometry of 3: 1. This hypothesis is further verified and confirmed by simulating an additional independent data set (McCormack et al. 1989) showing the steady-state trans-matrix distribution of free [Ca2+] in rat heart mitochondria in the presence of extra-matrix Ca2+ and Na+ and/or Mg2+. This integrated model of mitochondrial bioenergetics and cation handling can be used to analyse and understand the integrated roles of the CU, NCE and NHE in regulating trans-IMM Ca2+, Na+ and H+ fluxes, and determine the consequences of these fluxes on mitochondrial NADH redox states and respiration.
Methods
The dynamics of mitochondrial Ca2+ is primarily regulated by the fluxes through the Ca2+ uniporter (CU), Na+–Ca2+ exchanger (NCE) and Na+–H+ exchanger (NHE) (Gunter & Pfeiffer, 1990; Gunter et al. 1994; Bernardi, 1999). The activity of the Ca2+–H+ exchanger (CHE) is believed to be low in cardiac mitochondria at physiological levels of ΔpH across the IMM (Rizzuto et al. 1987), so here the contribution of the exchanger to the dynamics of mitochondrial Ca2+ is neglected. The computational model of mitochondrial bioenergetics and Ca2+ handling is constructed here by developing and individually parameterizing kinetic models of cation fluxes through the CU, NCE and NHE, and then integrating the models into our previously developed biophysical model of mitochondrial electron transport system and oxidative phosphorylation (Beard, 2005, 2006; Huang et al. 2007; Wu et al. 2007a,b). The major components of the integrated model are shown in the scheme in Fig. 1. The cation transport flux expressions and dynamic mass balance equations are presented below. The previous computational model of mitochondrial bioenergetic system with necessary modifications for the purpose of the present study is briefly presented in the online Supplementary Material.
Figure 1. Major components of the integrated model of mitochondrial calcium handling and bioenergetics.

The model includes mitochondrial respiratory system and oxidative phosphorylation (Beard, 2005) and accounts for mitochondrial Na+–Ca2+ dynamics (corresponding transporters are highlighted). Specifically, the model includes reactions at complex I, III, IV and V of the electron transport systems; substrate transporters (ANT and PHT), cation transporters (CU, NCE, NHE and KHE), and passive K+ and H+ permeation across the inner mitochondrial membrane; and passive substrate transport fluxes of adenines and phosphate across the outer mitochondrial membrane. The flux through the TCA cycle producing NADH is expressed in terms of a phenomenological dehydrogenase flux (Beard, 2005, 2006; Wu et al. 2007a). ANT, adenine nucleotide translocase; PHT, phosphate–hydrogen cotransporter; CU, Ca2+ uniporter; NCE, Na+–Ca2+ exchanger; NHE, Na+–H+ exchanger; and KHE, K+–H+ exchanger.
Throughout this article, the subscripts ‘x’, ‘i’, and ‘e’ refer to the ‘matrix’, ‘intermembrane space’, and ‘extra-mitochondrial’ domains, respectively; F, R and T denote the Faraday's constant, ideal gas constant and absolute temperature, respectively; ΔΨ denotes the membrane potential (positive when expressed from outside to inside); and zCa = 2 is the valence of Ca2+. The species concentrations are expressed in the units of molar (m) – specifically moles per litre of the compartment water volume; the fluxes are expressed in the units of mass per unit time per unit mitochondrial volume (e.g. mol s−1 (l mitochondria)−1, or alternatively mol s−1 (mg mitochondrial protein)−1, where 1 mg mitochondrial protein is approximately equal to 3.67 × 10⁻⁶ l of mitochondria). Unless otherwise mentioned, the unit ‘mg’ stands for ‘mg mitochondrial protein’. The fluxes are positive when expressed from outside to inside.
Cation transport flux expressions
Characterization of Ca2+ influx
Ca2+ is taken up in energized mitochondria via the CU (Gunter & Pfeiffer, 1990; Gunter et al. 1994; Bernardi, 1999), which is believed to be a highly selective channel for Ca2+ (Kirichok et al. 2004). It is driven by the electrochemical gradient of Ca2+ across the IMM. It also depends on the kinetics of Ca2+ binding to the CU. So to develop a kinetic model for the CU-mediated Ca2+ influx, a hybrid model combining the Michaelis–Menten equation (Segel, 1993) for carrier-mediated facilitated transport of Ca2+ and the Goldman–Hodgkin–Katz (GHK) equation (Keener & Sneyd, 1998) for electrodiffusion of the CU–2Ca2+ complex is proposed. The model is based on a single-step binding kinetics, but accounts for cooperativity in Ca2+ binding to the CU (Scarpa & Graziotti, 1973; Vinogradov & Scarpa, 1973); this means the binding of the first Ca2+ ion to the CU favours binding of the second Ca2+ ion, and that the dissociation constant for the first binding step (K1) is large and the second binding step (K2) is small, but the dissociation constant for the overall binding (K2 = K1K2) is finite. The model is thermodynamically balanced, since it considers reversible flux through the CU (Beard & Qian, 2007). The proposed CU flux expression is given by
 |
(1) |
where XCU (mol mg−1 s−1) is the CU activity and KCa,CU (m) is the Michaelis–Menten constant for the binding of Ca2+ to the CU; nCU is an exponent characterizing the non-linear dependency of the CU flux on the IMM potential ΔΨ. The exponent corresponding to the standard GHK equation is 1 (Keener & Sneyd, 1998). Here nCU is a phenomenological factor that allows us to fit the observed kinetic data. The three free parameters XCU, KCa,CU and nCU are characterized based on a number of independently published data sets on initial (pseudo-steady) flux rates via the CU with varying levels of external buffer Ca2+ and IMM potential ΔΨ measured in purified mitochondria from rat heart and rat liver (Scarpa & Graziotti, 1973; Vinogradov & Scarpa, 1973; Wingrove et al. 1984; Gunter & Pfeiffer, 1990; Gunter et al. 1994) (Table 1 and Fig. 2). In contrast to the previous models of the CU (Magnus & Keizer, 1997; Cortassa et al. 2003, 2006), this model satisfies the thermodynamic criterion that the CU flux is zero at the Nerst equilibrium potential for Ca2+. Though the Jafri et al. (Nguyen & Jafri, 2005; Nguyen et al. 2007) model of the CU is thermodynamically balanced, it does not account for cooperativity.
Table 1.
Parameter values in the model of mitochondrial Ca2+ handling (activities in mmol mg−1 s−1 can be converted to mmol l−1 s−1 by using the conversion factor 1 mg mitochondrial protein = 3.67 μl mitochondria)
| Parameter | Description | Values | Units | Reference |
|---|---|---|---|---|
| zCa | Valence of Ca2+ | 2.0 | unitless | standard |
| KCa,CU | MM binding constant of Ca2+ for the Ca2+ uniporter | 90.0 (rat heart) | μm | a |
| 48.0 (rat liver) | μm | b | ||
| XCU | Ca2+ uniporter activity | 1.5 × 10⁻² (rat heart) | nmol mg−1 s−1 | a |
| 1.35 × 10⁻² (rat liver) | nmol mg−1 s−1 | b | ||
| 2.025 (rat liver) | nmol mg−1 s−1 | c | ||
| nCU | Exponent for the IMM ΔΨ-dependence of Ca2+ uniporter | 2.7 | unitless | c |
| KCa,NCE | MM binding constant of Ca2+ for the Na+–Ca2+ exchanger | 2.1 (bovine heart) | μm | d |
| KNa,NCE | MM binding constant of Ca2+ for the Na+–Ca2+ exchanger | 8.2 (bovine heart) | mm | d |
| 3.45 (rabbit heart; with 2: 1 NCE stoichiometry) | mm | e | ||
| 2.4 (rabbit heart; with 3: 1 NCE stoichiometry) | mm | e | ||
| XNCE | Na+–Ca2+ exchanger activity | 88 for 2: 1 NCE stoichiometry | nmol (mg NCE protein)−1 s−1 | d |
| 1.41 for 3: 1 NCE stoichiometry | nmol (mg NCE protein)−1 s−1 | d | ||
| 1.76 × 10⁻³ for 2: 1 NCE stoichiometry | nmol mg s | e | ||
| 3.375 × 10⁻⁵ for 3: 1 NCE stoichiometry | nmol mg−1 s−1 | e | ||
| KNa,NHE | MM binding constant of Na+ for the Na+–H+ exchanger | 22.0 (rat heart/liver) | mm | f |
| KiH,NHE | Inhibition constant for matrix H+ for the Na+–H+ exchanger | 10−7.0 (rat heart/liver) | m | f |
| XNHE | Na+–H+ exchanger activity | 12.0 (rat heart liver−1) | nmol mg−1 s−1 | f |
| 18.0 (rat heart) | nmol mg−1 s−1 | f | ||
| βCa | Matrix Ca2+ buffering capacity | 10.0 | unitless | g |
| KEGTA.Ca | EGTA–Ca dissociation constant | 10−6.7 | m | h |
MM stands for Michaelis–Menten. aEstimated from Scarpa & Graziotti (1973); bEstimated from Vinogradov & Scarpa (1973); cEstimated from Wingrove et al. (1984); dEstimated from Paucek & Jaburek (2004); eEstimated from Cox & Matlib (1993); fEstimated from Kapus et al. (1988, 1989); gTaken from Jafri and Co. (Nguyen & Jafri, 2005; Nguyen et al. 2007); hTaken from references (Portzehl et al. 1964; Harafuji & Ogawa, 1980; Fabiato, 1988).
Figure 2. Fitting of Ca2+ uniporter (CU) model (lines) to data (points) on CU fluxes.

A and B, the initial rates of Ca2+ uptake (points) were measured with varying external buffer [Ca2+] in purified respiring mitochondria from rat liver (A) (Vinogradov & Scarpa, 1973) and rat heart (B) (Scarpa & Graziotti, 1973). Also shown are the model-simulated CU fluxes at 5 different levels of IMM ΔΨ (lines) in which the model is fitted to the data with IMM ΔΨ = 190 mV. The estimated values of the kinetic parameters were: A, KCa,CU = 48 μm and XCU = 1.35 × 10⁻² nmol mg−1 s−1 for rat liver mitochondria, and B, KCa,CU = 90 μm and XCU = 1.5 × 10⁻² nmol mg−1 s−1 for rat heart mitochondria. C, the fitting of the same kinetic model to another data set is shown where the initial rates of Ca2+ uptake were measured in purified rat liver mitochondria with varying IMM ΔΨ for 3 different levels of extramitochondrial buffer [Ca2+] (Wingrove et al. 1984; Gunter & Pfeiffer, 1990; Gunter et al. 1994). To fit the model to this data set, XCU is adjusted to 2.025 nmol mg−1 s−1 while keeping KCa,CU fixed at 48 μm. D, model-simulated CU fluxes are shown for purified rat heart mitochondria with varying IMM ΔΨ for 4 different levels of extramitochondrial buffer [Ca2+] with KCa,CU = 90 μm and XCU = 2.25 nmol mg−1 s−1.
Characterization of Na+-dependent Ca2+ efflux
Ca2+ is primarily extruded from respiring and non-respiring mitochondria in exchange for Na+ via the NCE (Na+-dependent efflux pathway) (Crompton et al. 1976; Crompton & Heid, 1978; Wingrove & Gunter, 1986b; Rizzuto et al. 1987; Cox & Matlib, 1993; Paucek & Jaburek, 2004). As mentioned before, the stoichiometry of the mitochondrial NCE is not well established. A number of reports indicate that the NCE is electroneutral: exchange of 2 Na+ for 1 Ca2+ (Brand, 1985b; Li et al. 1992; Paucek & Jaburek, 2004). Other reports indicate an electrogenic 3Na+–Ca2+ exchange (Baysal et al. 1991, 1994; Jung et al. 1995). To differentiate between these two possibilities, two kinetic models for the NCE are formulated here, one with a 2: 1 and the other with a 3: 1 stoichiometry. Both the models are based on a reversible, rapid-equilibrium, random-order bi-bi kinetic mechanism (Segel, 1993) for binding of Na+ and Ca2+ to the NCE. For simplicity, it is also assumed that the binding of the n Na+ ions (n = 2 or 3) to the NCE occurs in a single step (following the same logic used for the CU model). This assumption results in a model that both fits and can be parameterized by the available experimental data on the kinetics of the NCE. The derived flux expressions are thermodynamically balanced (Beard & Qian, 2007); the flux depends on membrane potential ΔΨ for a 3Na+–Ca2+ exchange. The proposed NCE flux expressions are
 |
(2A) |
for a 2Na+ -Ca+ exchange, and
 |
(2B) |
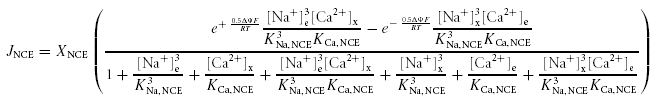
for a 3Na+–Ca2+ exchange. Here XNCE (mol mg−1 s−1) is the NCE activity and KCa,NCE (m) and KNa,NCE (m) are the Michaelis–Menten constants for the binding of Ca2+ and Na+ to the NCE. The three free parameters XNCE, KCa,NCE and KNa,NCE are characterized here for both 2: 1 and 3: 1 NCE stoichiometries based on published experimental data on initial (pseudo-steady) flux rates via the NCE measured in proteoliposomes reconstituted with the purified mitochondrial Na+–Ca2+ antiporter from bovine heart with varying levels of internal Ca2+ and external Na+ (Paucek & Jaburek, 2004) (Table 1 and Fig. 3). The NCE flux rates were expressed in the units of mol (mg NCE protein)−1 s−1. In contrast to the previous models of the NCE (Magnus & Keizer, 1997; Cortassa et al. 2003, 2006), the 3: 1 NCE stoichiometry model in eqn (2B) satisfies the physical criterion that the NCE flux is zero at the Nerst equilibrium potential for 3Na+ and Ca2+. The 3: 1 NCE stoichiometry model in eqn (2B) is similar to the NCE model of Nguyen et al. (2007). Note that with positive membrane potential ΔΨ (outside minus inside potential), the flux is always in the direction of Na+ import and Ca2+ export for the concentrations used here for the 3: 1 NCE stoichiometry model. In contrast, with excess extra-mitochondrial Ca2+, the 2: 1 NCE stoichiometry model can operate in the reverse direction.
Figure 3. Fitting of Na+–Ca2+ exchanger (NCE) model (lines) to data (points) on NCE fluxes.

The initial rates of Na+ efflux–Ca2+ influx (A and C) and Na+ influx–Ca2+ efflux (B and D) were measured with varying external buffer [Ca2+] and [Na+] (fixed matrix [Na+] = 25 mm and [Ca2+] = 18 μm), respectively, using proteoliposomes reconstituted with the purified mitochondrial Na+–Ca2+ antiporter from bovine heart (Paucek & Jaburek, 2004). The NCE model was based on a 2Na+–Ca2+ stoichiometry (electroneutral exchange) in the upper panels (A and B) and a 3Na+–Ca2+ stoichiometry (electrogenic exchange) in the lower panels (C and D). For a 3Na+–Ca2+ electrogenic exchange, the model-simulated NCE fluxes at various values of IMM ΔΨ are also shown; the model is fitted to the data with IMM ΔΨ = –190 mV (C) or IMM ΔΨ = +190 mV (D). The estimated values of the kinetic parameters are KNa,NCE = 8.2 mm, KCa,NCE = 2.1 μm and XNCE = 88 nmol Ca2+ mg−1 s−1 (176 nmol Na+ mg−1 s−1) for a 2Na+–Ca2+ exchange (A and B) and XNCE = 1.41 nmol Ca2+ mg−1 s−1 (4.23 nmol Na+ mg−1 s−1) for a 3Na+–Ca2+ exchange (C and D). Note that for a 3Na+–Ca2+ electrogenic exchange, the Na+ efflux–Ca2+ influx with imposed external Ca2+ and Na+ influx–Ca2+ efflux with imposed external Na+ requires the opposite signed IMM ΔΨ.
Characterization of Na+ efflux
The Na+, which enters the matrix in exchange for Ca2+ via the NCE, is extruded from the matrix in exchange for H+ via the NHE (Crompton & Heid, 1978; Kapus et al. 1988, 1989; Bernardi, 1999). The function of the NHE is to maintain a low [Na+] (2–5 mm) in respiring mitochondria to favour the influx of Na+ and efflux of Ca2+ via the NCE (Crompton & Heid, 1978; Jung et al. 1992). So the mitochondrial NHE plays a role in regulating the mitochondrial Na+–Ca2+ cycle, and hence mitochondrial Ca2+ dynamics. Like sarcolemmal NHE, mitochondrial NHE is also electroneutral, and hence the flux through the NHE does not depend on membrane potential ΔΨ. However, the activity of the NHE is inhibited by alkaline matrix pH (Kapus et al. 1988, 1989; Bernardi, 1999). So the NHE flux expression is formulated here by accounting for (1) a reversible, rapid-equilibrium, random-order bi-bi kinetic mechanism for binding of Na+ and H+ to the NHE, (2) inhibition of NHE by alkaline matrix pH, and (3) negligibly small binding constant of H+ compared to that of Na+ for the NHE (i.e. KH,NHE ≪ KNa,NHE). The resulting NHE flux expression is given by
 |
(3) |
where XNHE (mol mg−1 s−1) is the NHE activity and KNa,NaH (m) is the Michaelis–Menten constant for the binding of Na+ to the NHE. The factor XNHE·[H+]x2/(KiH,NHE·(KiH,NHE + [H+]x)) with KiH,NHE = 10−7m represents the inhibition of the NHE by alkaline matrix pH (pHx > 7). The two free parameters XNHE and KNa,NaH are characterized here based on published experimental data on initial (pseudo-steady) flux rates via the NHE with varying levels of external buffer pH, matrix pH and external Na+ in purified mitochondria from rat heart and rat liver (Kapus et al. 1988, 1989) (Table 1 and Fig. 4). The form of the inhibition factor in eqn (3) is actually determined based on the data on matrix pH dependency of the NHE flux (Fig. 4C and D). Note that the bracketed term in eqn (3) is similar to that in eqn (2A), except that the bracketed term in eqn (3) is based on a NHE stoichiometry of 1: 1 (i.e. exchange of 1 Na+ for 1 H+) with the assumption that KH,NHE ≪ KNa,NHE.
Figure 4. Fitting of Na+–H+ exchanger (NHE) model (lines) to data (points) on NHE fluxes.

The initial rates of H+ efflux or Na+ influx were measured: A, with varying external buffer [Na+] and fixed external buffer pH = 7.0 and matrix pH = 6.95 in purified mitochondria from rat heart (the filled circles are the measured H+ efflux rates while the open circles are the calculated H+ efflux rates from the measured rates of decreased matrix pH with a fixed matrix buffering capacity of 36 nmol H+ mg−1 (pH unit)−1) (Kapus et al. 1989), and B, with varying external buffer pH and fixed external buffer [Na+] = 9.6 mm and 15 mm and matrix pH = 7.0 in purified mitochondria from rat liver (Kapus et al. 1988). The model fits to these data sets with KNa,NHE = 22 mm and XNHE = 12 nmol mg−1 s−1 (for both Na+ influx and H+ efflux). C and D, the fitting of the same kinetic model to another data set is shown where the initial rates of decrease in matrix pH or H+ efflux in rat heart mitochondria were measured with varying matrix pH and fixed external buffer pH = 7.0 and [Na+] = 50 mm (Kapus et al. 1989). For the kinetic model to fit this data set, the XNHE value is adjusted to 18 nmol mg−1 s−1 while keeping the KNa,NHE value fixed at 22 mm.
Kinetics of Ca2+ binding to EGTA
In purified mitochondrial studies, EGTA is often used to buffer excess Ca2+ in the external buffer medium. Various models have been proposed in the literature to describe the kinetics of EGTA–Ca2+ binding (Portzehl et al. 1964; Harafuji & Ogawa, 1980; Miller & Smith, 1984; Smith et al. 1984; Fabiato, 1988). Here, we express the fractional binding of Ca2+ to the EGTA using the non-cooperative Hill equation:
| (4) |
where KEGTA.Ca is the EGTA–Ca2+ apparent dissociation constant; KEGTA.Ca depends on temperature, ionic strength, pH and other metal ion concentrations (e.g. Mg2+, Mn2+, Na+, K+) in the medium which compete with Ca2+ for binding to the EGTA (Portzehl et al. 1964). At physiological levels of pH and with other cations in the external buffer medium, the estimate KEGTA.Ca = 10−6.7m is consistent with the available estimates from the literature (Portzehl et al. 1964; Harafuji & Ogawa, 1980; Smith et al. 1984; Fabiato, 1988).
The total Ca2+ in the external buffer medium can then be expressed as
| (5) |
The volume of distribution for Ca2+ in the external buffer medium can be derived by taking the derivative of [Ca2+]e,tot with respect to [Ca2+]e and then multiplying it by the external buffer volume (We), expressed as the litres of external buffer water per litre of mitochondria:
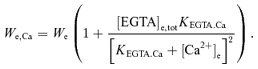 |
(6) |
The bracketed term characterizes the EGTA-dependent buffering capacity for Ca2+ (see below).
Dynamic mass balance equations for the integrated model
Matrix free [Ca2+] in respiring mitochondria is primarily affected by three fluxes: (1) Ca2+ influx through the CU; (2) Ca2+ efflux through the NCE; and (3) Ca2+ buffering in the matrix. This is under the assumption that the flux through the CHE (NICE) is negligible at physiological levels of ΔpH across the IMM. Matrix [Na+] is mainly affected by two fluxes: (1) Na+ influx via the NCE and (2) Na+ efflux via the NHE. Furthermore, in purified mitochondrial studies, with the external buffer containing EGTA, the external buffer free [Ca2+] depends on the kinetics of Ca2+ binding to the EGTA. To track matrix [Ca2+] and [Na+], our model of the mitochondrial respiratory system and oxidative phosphorylation (see Supplementary Material) is modified by adding dynamic mass balance equations governing the free [Ca2+] and [Na+]:
| (7A) |
| (7B) |
| (7C) |
| (7D) |
In addition, the matrix [H+] and IMM ΔΨ equations are updated as follows:
 |
(7E) |
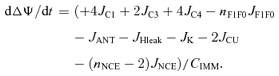 |
(7F) |
In the above equations, βCa and βH are the matrix buffering capacities for Ca2+ and H+; nNCE is the stoichiometry of Na+ in NCE (i.e. nNCE = 2 for a 2Na+–Ca2+ exchange and nNCE = 3 for a 3Na+–Ca2+ exchange); nF1F0 = 3 is the stoichiometry of proton pumping at complex V (F1F0-ATPase); CIMM denote the effective IMM capacitance; Wx denotes the litres of mitochondrial water volume per litre of mitochondrial volume and We denotes the litres of external water volume per litre of mitochondrial volume; We,Ca denote the effective volume or volume of distribution for Ca2+ in the external buffer medium accounting for the binding space of EGTA for Ca2+ (as derived above). The external water volume relative to the mitochondrial volume (We) is calculated based on the amount of mitochondrial protein added to the external buffer medium in a particular experimental protocol.
The dynamic mass balance eqns (7) along with the model equations presented in the Supplementary Material constitute the integrated model of mitochondrial bioenergetics and Ca2+ handling. The model parameter values are presented in Table 1 and in Table S1 of the Supplementary Material. The integrated model is implemented here in MatLab (The MathWorks Inc.; http://www.mathworks.com) and is solved using the ODE15S solver, a robust, implicit integrator suitable for the numerical solutions of stiff, initial value ODE problems. The model is available for download at http://www.bbc.mcw.edu/Computation.
Integrated model analysis of the experimental data on mitochondrial free [Ca2+]
Application to characterize the kinetics and stoichiometry of the mitochondrial NCE
The utility of the integrated model of mitochondrial bioenergetics and Ca2+ handling is illustrated by first applying the model to characterize the kinetics and stoichiometry of the mitochondrial NCE. Cox & Matlib (1993) reported spectrofluorometrically measured matrix free Ca2+ time course following addition of Na+ to the suspensions of respiring mitochondria purified from rabbit heart with the CU inhibited with ruthenium red. To distinguish between a 2: 1 and 3: 1 NCE stoichiometry, we analysed the dynamic data with the integrated model incorporating both NCE stoichiometries. The binding constants for Ca2+ and Na+ for the antiporter (KCa,NCE and KNa,NCE) and the overall activity of the antiporter (XNCE) were varied to obtain the best possible match of the model predictions to the dynamic observations, characterized by the least-square mean residual error, defined below by eqn (8). For this analysis, the activity of the CU was reduced by 100 times compared to the normal value in Table 1 to mimic the inhibitory effect of the ruthenium red. Note that since the external buffer contains EGTA to chelate the extruded Ca2+ from the matrix and the buffer volume is ∼390 times higher than the matrix volume (see below), the free Ca2+ in the buffer as a result of extrusion of Ca2+ from the matrix would not be high enough to activate the CU and to have a measurable Ca2+ influx through the CU. Thus, by inhibiting the CU by 10 times or 100 times will not influence the simulated dynamics of matrix free [Ca2+] significantly. The matrix Ca2+ buffering capacity was fixed at 10 (Nguyen & Jafri, 2005; Nguyen et al. 2007). The parameters characterizing the mitochondrial NHE were fixed as in Table 1, and that of mitochondrial bioenergetics were fixed as in Table S1.
In the experiment of Cox & Matlib (1993), the external buffer contained 50 μm of EGTA to chelate the extruded Ca2+ from the matrix. However, the total [Ca2+] (free + EGTA-bound) in the buffer was not reported. Therefore, we explored a range of reasonable values of total buffer [Ca2+] (1–40 μm) to characterize the sensitivity of the kinetics of the NCE to the buffer [Ca2+], as described in the Results section. The initial matrix free [Ca2+] was set at 1.27 μm to match the measured initial conditions, and the initial matrix [Na+] was set at 2.5 mm, corresponding to the standard level of endogenous Na+. The buffer pH, [K+] and [Pi] levels were set at 7.2, 180 mm and 2.5 mm, respectively, according to the experimental protocol (Table S1). All measurements were made using 1.4 mg of mitochondrial protein in an external buffer medium of 2 ml. Since 1 mg of mitochondrial protein corresponds to approximately 3.67 μl of mitochondria (Vinnakota & Bassingthwaighte, 2004; Huang et al. 2007), the relative external buffer volume (We) was set to 2.0/(1.4 × 3.67 × 10−3) = 390 ml of external buffer water per ml of mitochondria.
To complement the integrated model analysis of the dynamic data of Cox & Matlib (1993) and confirm the stoichiometry of the mitochondrial NCE, we performed an alternative analysis in which both 2: 1 and 3: 1 NCE models eqns (2A) and (2B) were first individually fitted to the kinetic data on the measured rates of decrease of matrix free [Ca2+] immediately following addition of Na+ and then used the fitted NCE model parameter values to simulate the dynamic data with the help of the integrated model incorporating both the NCE models. For this analysis, the matrix free [Ca2+], buffer free [Ca2+] and matrix [Na+] were set at 1.27 μm, 0.15 μm and 0.5 mm, respectively. The buffer [Na+] was varied as per the experimental protocol. The buffer free [Ca2+] of ∼0.15 μm corresponds to a buffer total [Ca2+] of ∼20 μm (based on EGTA–Ca2+ binding model); these estimates are approximate levels of buffer Ca2+ with a steady-state level of 0.1 μm of matrix free Ca2+ with a presumed 2: 1 NCE model (see Results section for details). The estimate of 0.5 mm of matrix [Na+] would be the approximate level of matrix Na+ within 1 min of the stabilization period after addition of substrates but before addition of Na+ to the mitochondrial preparation with the mitochondrial NHE functioning.
Further validation of the integrated model by independent experimental data
In this section, the integrated model of mitochondrial bioenergetics and Ca2+ handling was further validated and the stoichiometry of the mitochondrial NCE was further evaluated by applying the model to analyse an independent experimental data set from McCormack et al. (1989). The study reports spectrofluorometrically measured steady-state variations of matrix free [Ca2+] with respect to the variations in external buffer free [Ca2+] in respiring rat heart mitochondria in the presence of extra-matrix Na+ (10 mm) and/or Mg2+ (2 mm), or an uncoupler (1 μm FCCP). All measurements were made using 1 mg mitochondrial protein suspended (respiring) in 1 ml buffer medium maintained at pH = 7.3, [K+] = 180 mm, and [Pi] = 5 mm. This corresponds to a relative external buffer volume (We) of 272 ml of water per ml of mitochondria. The buffer free [Ca2+] was maintained at a desired level with addition of calculated amount of EGTA and CaCl2 in the external buffer medium.
With these experimental conditions, the integrated model incorporating both 2: 1 and 3: 1 NCE stoichiometries was fitted to the data by fixing the binding constants KCa,CU, KNa,NCE and KCa,NCE as estimated before, but allowing the activity parameters XCU and XNCE to vary. The activity of the NCE (XNCE) was fixed at the same level for all data curves, while the activity of the CU (XCU) was allowed to vary over the data curves to implicitly account for the inhibition of the CU by extramitochondrial free [Mg2+], which is not explicitly accounted for in the present model of the CU. The matrix Ca2+ buffering capacity and parameters characterizing the mitochondrial NHE were fixed as in Table 1.
Statistical method of optimization and parameter estimation
The NCE model parameters θ = (XNCE, KCa,NCE, KNa,NCE) characterizing the experimental data of Cox & Matlib (1993) on the kinetics of mitochondrial NCE were estimated by simultaneous least-squares fitting of the model-simulated outputs to the dynamic experimental data:
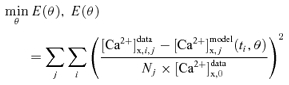 |
(8) |
where and (ti, θ) are the experimental data and model-simulated outputs on matrix free [Ca2+] at time ti in jth Na+-addition experiment; is the measured initial matrix free [Ca2+] (to normalize concentrations); Nj is the number of dynamic measurements (time points) on jth Na+-addition experiment and min E(θ) is the minimization of the mean residual error E(θ). The minimization of mean residual error (objective function) for optimal estimation of NCE model parameters θ = (XNCE, KCa,NCE, KNa,NCE) is carried out using the FMINCON optimizer in MatLab (The MathWorks Inc.; http://www.mathworks.com). The robustness of model fitting to data for a particular NCE model is assessed based on the value of mean residual error (8) at optimal parameter estimates (least-square error).
Results
Parameterization of the individual model components
This section demonstrates the parameterization and independent validation of the individual model components of the mitochondrial Ca2+ handling system. Simulations of the individually parameterized kinetic models of the Ca2+ uniporter (CU), Na+–Ca2+ exchanger (NCE) and Na+–H+ exchanger (NHE), and their comparisons to the experimental data on cation fluxes are illustrated in Figs 2, 3 and 4, respectively. The simulations are shown as continuous lines while the data are shown as points. The data are from independent studies and are based on measurements of initial flux rates via the cation transporters in respiring/non-respiring mitochondria (from heart or liver) or in reconstituted transporters under a variety of experimental conditions. Details for each experiment and simulation are described below. The estimated parameter values are summarized in Table 1. Unless stated otherwise, these parameter values are used later in integrated model simulations of the mitochondrial Ca2+ handling system.
Ca2+ uniporter model
Figure 2 shows simulations of mitochondrial Ca2+ uptake via the CU in purified energized (respiring) mitochondria with varying levels of external buffer Ca2+ and IMM potential ΔΨ. Here, the CU model is compared to three independent experimental data sets. Specifically, the CU model was used to simulate the experimental data of Scarpa and co-workers (Scarpa & Graziotti, 1973; Vinogradov & Scarpa, 1973) (Fig. 2A and B) and Gunter and co-workers (Wingrove et al. 1984; Gunter & Pfeiffer, 1990; Gunter et al. 1994) (Fig. 2C). In the experiments of Scarpa and co-workers, the initial rates of Ca2+ uptake were measured in respiring mitochondria purified from rat liver (Fig. 2A) (Vinogradov & Scarpa, 1973) and rat heart (Fig. 2B) (Scarpa & Graziotti, 1973) following addition of varying amounts of Ca2+ (CaCl2) to the external buffer medium. For these analyses, IMM ΔΨ was held fixed at 190 mV, a typical value for state 2 and state 4 respiration in cardiac mitochondria.
In the experiments of Gunter and co-workers, the initial rates of Ca2+ uptake were measured in respiring mitochondria purified from rat liver (Fig. 2C) as a function of IMM ΔΨ for three different levels of external buffer Ca2+ ([Ca2+]e = 0.5, 1.0 and 1.5 μm); ΔΨ was varied by adding malonate to the external buffer medium (Wingrove et al. 1984). The corresponding model simulations of ΔΨ-dependent Ca2+ influx in cardiac mitochondria with varying levels of external buffer Ca2+ (i.e. [Ca2+]e = 25, 50, 100 and 250 μm) are shown in Fig. 2D in which ΔΨ was ramped from –50 mV to 200 mV, a simulation protocol similar to the experimental protocol of Kirichok et al. (2004) in which Ca2+ currents were measured using patch-clamp techniques in single mitoplasts from cardiac mitochondria.
As illustrated in Fig. 2, our kinetic model of the CU is able to satisfactorily describe all three independent data sets. The fitting of the model to the data from liver mitochondria (Vinogradov & Scarpa, 1973) gives KCa,CU = 48 μm and XCU = 1.35 × 10⁻² nmol mg−1 s−1, while that from cardiac mitochondria (Scarpa & Graziotti, 1973) provides KCa,CU = 90 μm and XCU = 1.5 × 10⁻² nmol mg−1 s−1 (Fig. 2A and B), given the exponent nCU = 2.7. These analyses suggest that the CU activities are similar in both liver and cardiac mitochondria under similar experimental conditions, while the Michaelis–Menten (MM) constant for Ca2+ binding to the CU in cardiac mitochondria is about twice that of the value in liver mitochondria. By keeping the MM constant fixed at KCa,CU = 48 μm and nCU = 2.7 and adjusting the CU activity parameter XCU, our CU model is able to simultaneously fit all three data curves in Fig. 2C from liver mitochondria (Wingrove et al. 1984), but provide an estimate XCU = 2.025 nmol mg−1 s−1 which is about two-orders of magnitude higher (∼150 times) than the estimated XCU = 1.35 × 10⁻² nmol mg−1 s−1 obtained from the liver mitochondria data in Fig. 2A (Vinogradov & Scarpa, 1973). The difference may be attributed to the fact that the data were from different mitochondrial preparations and different experimental protocols; the external buffer medium in the experiments of Vinogradov & Scarpa (1973) contained 5 mm of Mg2+ which is known to inhibit the CU activity. Though the activity of the CU in cardiac and liver mitochondria estimated from these data varies widely, model simulations show that even at the highest estimated value (XCU = 2.025 nmol mg−1 s−1), the flux through the CU is only a small fraction (∼10−5) of the resting (state 2 and state 4) electron transport system flux. Thus, we do not expect the Ca2+ current to significantly depolarize mitochondria in vivo under physiological conditions.
Na+–Ca2+ exchanger model
Figure 3 illustrates the model simulations of experimental data from Paucek & Jaburek (2004) in which the initial rates of Na+ efflux (Ca2+ influx) (negative IMM ΔΨ with outside negatively charged and inside positively charged) and Na+ influx (Ca2+ efflux) (positive IMM ΔΨ with outside positively charged and inside negatively charged) were measured, respectively, with varying external [Ca2+] and [Na+] in proteoliposomes reconstituted with the purified mitochondrial Na+–Ca2+ antiporter from the bovine hearts. The simulations from 2Na+–Ca2+ electroneutral and 3Na+–Ca2+ electrogenic exchange models are shown in the upper panels (A and B) and lower panels (C and D), respectively. In the case of 3Na+–Ca2+ electrogenic exchange, the exchange fluxes also depend on ΔΨ, which is illustrated in Fig. 3C and D. The simulations show that the exchange fluxes are higher in the energized mitochondria (higher ΔΨ) than the depolarized mitochondria (lower ΔΨ). The model was fitted to the data with the standard state 2 and state 4 IMM ΔΨ of 190 mV.
The data from Paucek & Jaburek (2004) suggest a 2: 1 stoichiometry for the mitochondrial NCE, since the rates of Na+ efflux are twice the rates of Ca2+ influx with imposed external Ca2+. It is, however, not clear whether Ca2+ influx rates were measured or calculated based on a presumed 2: 1 NCE stoichiometry. So to allow for the possibility of a 3: 1 NCE stoichiometry, the data on Ca2+ fluxes were excluded from the analysis.
As shown in Fig. 3, both of our 2: 1 and 3: 1 NCE stoichiometry models are able to fit to the data on Na+ fluxes reasonably well, though the fitting is slightly better for the 2: 1 model, which is expected given that the data suggest a 2: 1 NCE stoichiometry. In this study, the dependency of the NCE fluxes on the IMM ΔΨ is not reported. In addition, the data are only on the initial or pseudo-steady flux rates and no information about the dynamics of the NCE flux is available. So these data are not suitable to characterize the stoichiometry of the NCE. However, these data are useful to estimate the MM binding constants of Na+ and Ca2+ for the NCE (KNa,NCE and KCa,NCE). The fittings from both the 2: 1 and 3: 1 models provide similar estimates for the binding constants: KNa,NCE = 8.2 mm and KCa,NCE = 2.1 μm. However, the estimates of the NCE activity parameter were different: XNCE = 88 nmol Ca2+ (mg NCE protein)−1 s−1 (176 nmol Na+ (mg NCE protein)−1 s−1) for the 2Na+–Ca2+ model, and XNCE = 1.41 nmol Ca2+ (mg NCE protein)−1 s−1 (4.23 nmol Na+ (mg NCE protein)−1 s−1) for the 3Na+–Ca2+ model. (For the same data, the activity of the 3: 1 model is smaller than that of the 2: 1 model because the 3Na+–Ca2+ exchange is driven by the IMM ΔΨ.) Since these experiments were conducted using NCE reconstituted in liposomes, these estimated activities cannot be related to activity in the intact mitochondrion. Therefore, the activity in the integrated system is estimated based on a different data set, as described in the next section.
Na+–H+ exchanger model
Figure 4 demonstrates the model simulations of the experimental data from two different studies of Kapus et al. (1988, 1989) in which the initial rates of H+ efflux (Na+ influx) and/or decrease in matrix pH were measured in purified mitochondria from rat heart and rat liver with varying external buffer [Na+], external buffer pH, and matrix pH. The data in Fig. 4A represent the measured rate of H+ efflux (filled circles) or decrease in matrix pH times matrix pH buffering capacity (open circles) in purified rat heart mitochondria with varying buffer [Na+] and fixed buffer pH of 7.0 and initial matrix pH of 6.95 (Kapus et al. 1989). The model simulations are shown for three different levels of buffer pH (pHe = 6.5, 7.0 and 7.6). The data in Fig. 4B represent the measurements of H+ efflux in rat liver mitochondria with varying buffer pH, fixed initial matrix pH of 6.95, and fixed external buffer [Na+] of 9.6 mm and 15 mm (Kapus et al. 1988). The model simulations are shown for three different levels of buffer [Na+] ([Na+]e = 9.6, 15 and 30 mm). The data in Fig. 4C and D represent the measured rates of H+ efflux (calculated from the measured rates of decrease in matrix pH times matrix pH buffering capacity) in rat heart mitochondria following addition of 50 mm of [Na+] to the external buffer medium with varying matrix pH and fixed buffer pH of 7.0.
As depicted in Fig. 4, our two-parameter kinetic model of the mitochondrial NHE is able to satisfactorily describe all the data sets presented above. To fit the NHE model to the data set in Fig. 4C and D, it was necessary to account for the inhibition at high (alkaline) matrix pH (pHx > 7) on the NHE, which is also evident from the work of Kapus et al. (1988, 1989). The inhibition factor was found to be of the form [H+]x2/(KiH,NHE·(KiH,NHE + [H+]x)) in which the matrix H+ inhibition constant for the NHE (KiH,NHE) is fixed at 10−7m (see eqn (3)). As seen in Fig. 4C and D, a high pHx > 7 reduces the flux of the electroneutral Na+–H+ exchange; at pHx > 7.5, the H+ efflux becomes negligible. The NHE model fits to the data sets in Fig. 4A and B with KNa,NHE = 22 mm and XNHE = 12 nmol mg−1 s−1. To fit the same model to the data sets in Fig. 4C and D, it was necessary to adjust the value of XNHE to 18 nmol mg−1 s−1 while keeping the value of KNa,NHE fixed at 22 mm. Consistent with the experimental observations, our NHE model simulations show that the H+ efflux (Na+ influx) increases with the increase in external buffer [Na+] and pH and decrease in matrix pH.
The next section shows how integrating these individual model components of the mitochondrial Ca2+ handling system into our computational model of mitochondrial respiratory system and oxidative phosphorylation (Beard, 2005, 2006; Huang et al. 2007; Wu et al. 2007a,b) is useful in analysing independent experimental data sets on mitochondrial [Ca2+] dynamics from the literature and characterizing the stoichiometry of the mitochondrial NCE. The model simulations also suggest potential new experiments to be performed to further characterize the stoichiometry of the mitochondrial NCE.
Integrated model analysis of the kinetics and stoichiometry of the mitochondrial Na+–Ca2+ exchanger
The integrated model of mitochondrial bioenergetics and Ca2+ handling was next applied to analyse the experimental data of Cox & Matlib (1993) on the kinetics of mitochondrial NCE in rabbit heart (with the CU blocked by ruthenium red) as well as to characterize the stoichiometry of the NCE. Results of these analyses are shown in Fig. 5 (and also in Figs S1 and S2 in the Supplementary Material).
Figure 5. Characterization of the kinetics and stoichiometry of the mitochondrial Na+–Ca2+ exchanger (NCE).

A and B, comparison of model predictions (lines) to measurements (points) of the time courses of Ca2+ decay in purified respiring mitochondria from rabbit heart with addition of varying levels of Na+ to the external buffer medium with the activity of CU blocked with ruthenium red (Cox & Matlib, 1993). The buffer medium contained 50 μm of EGTA to buffer the extruded Ca2+. The kinetic model of the NCE is based on a 2Na+–Ca2+ stoichiometry (electroneutral exchange) in A and a 3Na+–Ca2+ stoichiometry (electrogenic exchange) in B. The continous lines are the model-fitted curves with a total of 1 μm of Ca2+ in the buffer (negligible compared to the total EGTA of 50 μm) and the dashed lines are the model-simulated profiles with a total of 40 μm of Ca2+ in the buffer (comparable with the total EGTA of 50 μm). The model fitting provides estimates KNa,NCE = 3.45 mm, KCa,NCE = 2.1 μm and XNCE = 1.76 × 10⁻³ nmol Ca2+ mg−1 s−1 (3.52 × 10⁻³ nmol Na+ mg−1 s−1) for a 2Na+–Ca2+ exchange and KNa,NCE = 2.4 mm, KCa,NCE = 2.1 μm and XNCE = 3.375 × 10⁻⁵ nmol Ca2+ mg−1 s−1 (10.125 × 10⁻⁵ nmol Na+ mg−1 s−1) for a 3Na+–Ca2+ exchange. C and D, comparison of the regions of model predictions (shaded area) to the measurements (points) of the initial rates of decrease of matrix free [Ca2+] (C), and matrix free [Ca2+] after 3 min of addition of Na+ (D), both as functions of external buffer [Na+] with the total external buffer [Ca2+] varying from 1 μm to 40 μm. The model predictions are shown for both the 2Na+–Ca2+ and 3Na+–Ca2+ stoichiometry models with model parameters as described above.
Sensitivity analysis
Figure 5 (upper panels, A and B) shows the Na+ dose-dependent responses of matrix free [Ca2+] in purified respiring cardiac mitochondria with the CU blocked. The filled circles are the measured matrix free [Ca2+] data (Fig. 1 of Cox & Matlib (1993)). The continuous and dashed lines represent the model simulations in the presence of 1 μm and 40 μm of total Ca2+ (free + EGTA-bound) in the external buffer medium. To characterize the stoichiometry of the NCE, the model analysis of the data was carried out using both the 2Na+–Ca2+ (A) and 3Na+–Ca2+ (B) stoichiometry models. The fitting of the models to the data was carried out with 1 μm of total external buffer Ca2+ (negligible compared to the total EGTA of 50 μm) and simulation of the models was carried out with 40 μm of total external buffer Ca2+ (comparable with the total EGTA of 50 μm) with the estimated NCE model parameter values. The corresponding model simulations of the dynamics of trans-matrix NCE and NHE fluxes and intra-matrix Na+ concentrations are shown in Fig. S1 of the Supplementary Material.
The effect of external buffer Na+ on the rate of decrease and magnitude of matrix free Ca2+ is shown in Fig. 5 (lower panels, C and D). The simulation and experimental protocols are exactly the same as that in Fig. 5A and B. Specifically, Fig. 5C and D shows the comparison of the regions of model predictions (shaded areas) to the experimental data (points) (Fig. 2 of Cox & Matlib (1993)) on the rate of decrease of matrix free [Ca2+] immediately following addition of Na+ (C), and matrix free [Ca2+] resulting 3 min after addition of Na+ (D), both as functions of external buffer [Na+] with the total external buffer [Ca2+] varying from 1 μm to 40 μm. In plot (C) and (D), the regions of model predictions are shown for both 2Na+–Ca2+ (A) and 3Na+–Ca2+ (B) stoichiometry models with the NCE model parameter values estimated from the fitting of the models to the data in Fig. 5A and B with a total external buffer [Ca2+] of 1 μm.
The two values of 1 μm and 40 μm used for total buffer Ca2+ correspond to a reasonable range of total buffer Ca2+ considering the total EGTA used in the external buffer medium to chelate the extruded Ca2+ from the matrix is 50 μm. At the low extreme of total buffer Ca2+, either model is able to reasonably reproduce the measured data on the dynamics of matrix free Ca2+ (continuous lines). However, fitting of the 3: 1 model is more robust. While the 2: 1 model deviates from the data, the 3: 1 model accurately predicts the data over the entire duration of the measurements. The mean residual error at the fitted optimal parameter estimates (least-square error) from the 2: 1 model was approximately 1 × 10⁻², while that from the 3: 1 model was approximately 3.5 × 10⁻³. Furthermore, the model simulated initial rates of decrease of matrix free Ca2+ (JNCE/Wx.βCa) using the optimal parameter estimates from the 2: 1 model deviate considerably from the data at higher values of extramitochondrial buffer Na+, while the model predictions for the same from the 3: 1 model match the data reasonably well over the entire range of buffer Na+. At higher assumed values of total extramitochondrial buffer Ca2+, only the 3: 1 model is able to explain the data. Therefore, the 2: 1 model predicts that this experiment is extremely sensitive to total buffer Ca2+, while the 3: 1 model predicts that it is not.
The model simulations of matrix free [Ca2+] are not in steady state at the beginning of the simulations with the 2: 1 NCE stoichiometry model in the presence of excess extra-matrix buffer Ca2+ (Fig. 5A, dotted lines). This is not consistent with the experimental data of Cox & Matlib (1993). This is because with the 2: 1 model in the presence of excess buffer Ca2+, the NCE operates in the reverse direction and Ca2+ enters the matrix via the NCE in the exchange of Na+, assuming the initial matrix [Na+] is non-zero. (See Fig. S1(A), dotted lines, of the Supplementary Material for the simulations of NCE fluxes.)
It is further depicted from Fig. 5A and B that neither of the models stabilize even after 200 s of extra-matrix Na+ addition. With the 2: 1 NCE stoichiometry model, all simulations of intra-matrix [Ca2+] tend to reach a single steady state that is proportional to extra-matrix [Ca2+] (since [Ca2+]x/[Ca2+]e = [Na+]x2/[Na+]e2 = [H+]x2/[H+]e2 at steady state). However, the time intra-matrix [Ca2+] takes to reach the steady state depends on the amount of Na+ added. In contrast, with the 3: 1 NCE stoichiometry model, virtually all intra-matrix Ca2+ is eventually extruded to the buffer medium due to the electrogenic nature of the NCE. The model simulations with the 3: 1 NCE stoichiometry match the data for the entire duration of the experiment, while the simulations with the 2: 1 NCE stoichiometry deviate significantly from the data.
The NCE model parameter values that best explained the dynamic data of Cox & Matlib (1993) were KNa,NCE = 3.45 mm, KCa,NCE = 2.1 μm and XNCE = 1.76 × 10⁻³ nmol Ca2+ mg−1 s−1 (3.52 × 10⁻³ nmol Na+ mg−1 s−1) for the 2Na+–Ca2+ electroneutral exchange model, and KNa,NCE = 2.4 mm, KCa,NCE = 2.1 μm and XNCE = 3.38 × 10⁻⁵ nmol Ca2+ mg−1 s−1 (10.14 × 10⁻⁵ nmol Na+ mg−1 s−1) for the 3Na+–Ca2+ electrogenic exchange model. The estimate of KCa,NCE was almost the same from both the models as the mean residual error was relatively insensitive to the kinetic parameter KCa,NCE. The estimate KNa,NCE = 2.4 mm from the 3Na+–Ca2+ model agrees with the value KNa,NCE = 2.6 ± 0.15 mm reported in Cox and Matlib, while the estimate KNa,NCE = 3.45 mm from the 2Na+–Ca2+ model was significantly higher. Thus, the binding constants KNa,NCE and KCa,NCE obtained here from the dynamic data of Cox & Matlib are of the same order of magnitude as that obtained earlier from the kinetic data of Paucek & Jaburek (2004) (Fig. 3).
Alternative analysis
From the kinetic and dynamic data of Cox & Matlib (1993), it is apparent that the matrix free [Ca2+] reaches a steady-state level of 0.1–0.2 μm within 3 min of addition of 5–10 mm of [Na+] to the external buffer medium. With the 2: 1 NCE stoichiometry model with the CU blocked (JCU = 0), this steady state implies JNCE = 0 and JNHE = 0, or equivalently, [Ca2+]x/[Ca2+]e = [Na+]x2/[Na+]e2 = [H+]x2/[H+]e2 ≈ 0.65 (assuming a 0.1 trans-matrix pH gradient), or equivalently, [Ca2+]x ≈ 0.65[Ca2+]e. This indicate that with a 2: 1 NCE stoichiometry, the external buffer medium in the experiment of Cox and Matlib would contain about 0.15–0.3 μm of free [Ca2+], or equivalently, about 20–30 μm of total [Ca2+] (free + EGTA-bound). Therefore, we performed further analysis of the data of Cox & Matlib with this assumed level of free and total external buffer [Ca2+]. Results for this integrated model analysis of the data are shown in Fig. S2 of the Supplementary Material.
The fittings of the individual 2: 1 and 3: 1 NCE models (eqns (2A) and (2B)) to the kinetic data on measured initial rates of decrease of matrix free [Ca2+] (JNCE/Wx.βCa) are shown in Fig. S2(C). The integrated model simulations of the dynamic and steady-state kinetic data on matrix free [Ca2+] using the fitted 2: 1 and 3: 1 NCE model parameters are shown in Fig. S2(A and B) and S2(D). The NCE model parameter values obtained from these fittings were KNa,NCE = 2.4 mm, KCa,NCE = 2.1 μm and XNCE = 1.32 × 10⁻³ nmol Ca2+ mg−1 s−1 (2.64 × 10⁻³ nmol Na+ mg−1 s−1) for a 2: 1 model and KNa,NCE = 2.4 mm, KCa,NCE = 2.1 μm and XNCE = 3.375 × 10⁻⁵ nmol Ca2+ mg−1 s−1 (10.125 × 10⁻⁵ nmol Na+ mg−1 s−1) for a 3: 1 model. Note that the estimates of the NCE model parameters are the same as those obtained from Fig. 5 for the 3: 1 model, while the estimates of both KNa,NCE and XNCE are reduced for the 2: 1 model. Also the estimates of KNa,NCE are the same for both the models and agree with the value KNa,NCE = 2.6 ± 0.15 mm reported in Cox & Matlib (1993). As seen in Fig. S2(C), comparisons of the individual 2: 1 and 3: 1 models to the kinetic data on initial NCE fluxes are excellent; however, while the integrated model with 2: 1 NCE stoichiometry deviates considerably from the dynamic data, the integrated model with 3: 1 NCE stoichiometry is more consistent with the dynamic data throughout the measurement period.
In summary, both 2: 1 and 3: 1 NCE stoichiometry models can fit to the experimental data of Cox & Matlib (1993) on the magnitude and initial rate of decrease of matrix free [Ca2+] reasonably well by suitably choosing the NCE model parameters (KNa,NCE, KCa,NCE and XNCE) with a low total Ca2+ in the external buffer medium (e.g. with [Ca2+]tot = 1–10 μm, negligible compared to the total EGTA of 50 μm in the buffer). However, the fittings using the 3: 1 NCE model are consistently better than those obtained using the 2: 1 NCE model. More significantly, the model predictions of the matrix free [Ca2+] and the initial rates of Ca2+ efflux from the matrix using the 2: 1 NCE model were sensitive to the amounts of total buffer Ca2+, while those of the 3: 1 NCE model were not. Therefore, this analysis suggests that the experimental data of Cox and Matlib would be significantly sensitive to an unreported experimental variable (i.e. total external buffer Ca2+) if the NCE has a 2: 1 stoichiometry. Small variations in total external buffer Ca2+ would lead to larger differences in the measured matrix free [Ca2+]. In contrast, with 3: 1 stoichiometry, these results would be insensitive to this variable.
Further validation of the integrated model by independent experimental data
The integrated model of mitochondrial bioenergetics and Ca2+ handling and the proposed 3: 1 stoichiometry for the NCE were further validated by analysing an independent experimental data set from McCormack et al. (1989) involving the integrated functions of mitochondrial CU, NCE and NHE. Results of these analyses are summarized in Fig. 6. Specifically, Fig. 6 shows the integrated model simulations (lines) of the experimental data (points ± s.d.) on the steady-state distributions of Ca2+ across the IMM in rat heart in the presence of extra-matrix Ca2+ (variable) and Na+ (10 mm) and/or Mg2+ (2 mm), or an uncoupler (1 μm FCCP). To simulate the effects of FCCP, the IMM potential ΔΨ was set to zero (uncoupled mitochondria). The external buffer free [Ca2+] was maintained at a desired level with the addition of calculated amounts of EGTA and CaCl2 to the buffer medium. The integrated model incorporates both 2: 1 and 3: 1 NCE stoichiometry models as well as two different models for the CU, one without inhibition of the CU by matrix free Ca2+ and the other with inhibition of the CU by matrix free Ca2+. Simulations using the 2: 1 model are shown in the left panels (A and C), while those using the 3: 1 model are shown in the right panels (B and D). Simulations without inhibition of the CU by matrix free Ca2+ are shown in the upper panels (A and B), while those with inhibition of the CU by matrix free Ca2+ are shown in the lower panels (C and D).
Figure 6. Independent validation of the integrated model of mitochondrial Ca2+ handling.

Comparison of model predictions (lines) to the experimental data (points ± s.d.) of McCormack et al. (1989) on steady-state relationships between matrix and external buffer free [Ca2+] in purified respiring rat heart mitochondria in the presence of extramitochondrial Na+ and/or Mg+ or an uncoupler (FCCP). The buffer free [Ca2+] was maintained at a desired level with the addition of calculated amount of EGTA and CaCl2 to the external buffer medium; • with no further addition, ♦ with 10 mm of NaCl, ▪ with 2 mm of MgCl2, ▴ with 10 mm of NaCl and 2 mm of MgCl2, and ○ with 1 μm of FCCP. The integrated model was fitted to the data by fixing the Michaelis–Menten binding constants in the models of CU and NCE as estimated before (i.e. KCa,CU = 90 μm, KNa,NCE = 2.4 mm and KCa,NCE = 2.1 μm), but allowing the activity parameters XCU and XNCE to vary. However, the activity of NCE (XNCE) was fixed at the same level for all data curves, while the activity of CU (XCU) was allowed to vary over the data curves (to implicitly account for the inhibition of CU by extramitochondrial free [Mg2+]). The left panels (A and C) are for 2: 1 NCE stoichiometry model, while the right panels (B and D) is for 3: 1 NCE stoichiometry model. The upper panels (A and B) is with the CU model without accounting for the inhibition of CU by matrix free [Ca2+], while the lower panels (C and D) is with the CU model with accounting for the inhibition of CU by matrix free [Ca2+] to better fit the integrated model to the steady-state distribution of Ca2+ across the mitochondrial inner membrane. The activity parameter values that were used to fit the model to the data are: A and B, XNCE′ = 4·XNCE and XCU′ = 10·XCU (•, ♦), XCU′ = XCU/12.5 (▪), and XCU′ = XCU (▴), and C and D, XNCE′ = 2.5·XNCE and XCU′ = 20·XCU·Ki/(Ki + [Ca2+]x) (•, ♦), XCU′ = (XCU/5.5)·Ki/(Ki + [Ca2+]x) (▪), and XCU′ = (XCU/0.6)·Ki/(Ki + [Ca2+]x) (▴), where XNCE = XNCE = 3.375 × 10⁻⁵ nmol mg−1 s−1, XCU = 1.5 × 10⁻² nmol mg−1 s−1, and Ki = 1 μm.
As depicted in Fig. 6, our integrated model is able to satisfactorily simulate the independent experimental data of McCormack et al. (1989). As with the analysis of Cox & Matlib (1993) data, the model simulations of these additional data using the 3: 1 NCE model are also consistently better than those obtained using the 2: 1 NCE model. To simulate these data, the binding constants in the models of CU and NCE were fixed as estimated before (i.e. KCa,CU = 90 μm, KNa,NCE = 2.4 mm KCa,NCE = 2.1 μm), but allowing the activity parameters XCU and XNCE to vary. The activity of the NCE (XNCE) was fixed at the same level for all data curves, while the activity of the CU (XCU) was allowed to vary over the data curves to implicitly account for the inhibition CU by extra-matrix free [Mg2+], which is not explicitly accounted for in the present model of the CU. As depicted in Fig. 6A and B, we were not able to fit the steady-state trans-membrane Ca2+ distribution data over the entire range of external buffer free [Ca2+]. However, by accounting for a specialized inhibition mechanism of the CU by matrix free [Ca2+], we were able to fit the model to the data well, as shown in Fig. 6C and D). The activity parameter values that were obtained to fit the model to the data are: A and B: XNCE′ = 4·XNCE and XCU′ = 10·XCU (control data and data with Na+ addition: •, ♦), XCU′ = XCU/12.5 (data with Mg2+ addition: ▪), and XCU′ = XCU (data with both Na+ and Mg2+ addition: ▴); and C and D: XNCE′ = 2.5·XNCE and XCU′ = 20·XCU·Ki/(Ki + [Ca2+]x) (•, ♦), XCU′ = (XCU/5.5)·Ki/(Ki + [Ca2+]x) (▪), and XCU′ = (XCU/0.6)·Ki/(Ki + [Ca2+]x) (▴), where XNCE = XNCE = 3.375 × 10⁻⁵ nmol mg−1 s−1, XCU = 1.5 × 10⁻² nmol mg−1 s−1, and Ki = 1 μm. All the models were able to simulate the effects of FCCP on steady-state (equilibrated) trans-matrix free Ca2+ distribution. These analyses further substantiate the validity of the integrated model and support the hypothesis that the stoichiometry of the mitochondrial NCE is 3: 1.
Discussion
Salient features of the kinetic models of the Na+–Ca2+ transport system
One of the major contributions of the current study is the characterization of the mitochondrial Na+–Ca2+ transport system with the help of a system of biophysical models of the mitochondrial Ca2+ uniporter (CU), Na+–Ca2+ exchanger (NCE) and Na+–H+ exchanger (NHE). Our efforts to characterize these cation transporters (CU, NCE and NHE) differ from the previous attempts (Magnus & Keizer, 1997; Cortassa et al. 2003; Nguyen & Jafri, 2005; Cortassa et al. 2006; Nguyen et al. 2007) in that our kinetic models for the fluxes are mechanistic, thermodynamically balanced, and individually parameterized based on a large number of independently published data sets on initial (pseudo-steady) flux rates through the cation transporters, measured in respiring/non-respiring mitochondria. The flux expressions account for the specific effects of inhibitors that are experimentally established, such as the inhibition of the NHE activity by high matrix pH (Kapus et al. 1988, 1989). The kinetic models of the CU, NCE and NHE are further validated by integrating these models into our previously developed, broadly validated model of mitochondrial respiratory system and oxidative phosphorylation (Beard, 2005, 2006; Wu et al. 2007a) to characterize the integrated roles of the CU, NCE and NHE in regulating mitochondrial [Ca2+] dynamics in purified cardiac mitochondria.
The CU model introduced here is able to fit to the experimental data of Gunter and co-workers (Wingrove et al. 1984; Gunter & Pfeiffer, 1990; Gunter et al. 1994) on Ca2+ influx as a function of IMM potential ΔΨ (Fig. 2C) without introducing non-physical assumptions of previous models (Gunter & Pfeiffer, 1990; Magnus & Keizer, 1997; Cortassa et al. 2003; Cortassa et al. 2006). Specifically, previous models have introduced an offset potential ΔΨ* (≈ 90 mV) and flux expressions that appropriate for potential measured relative to this offset potential. These models were justified based on the explanation that the electrical potential across the CU may not fall to zero concomitantly with the bulk IMM potential, perhaps because of fixed charges producing electric field gradients localized to the CU. However, such models cannot be reconciled with measurements of bulk Ca2+ movement between matrix and extramitochondrial space. The current model of the CU is able to account for the observed data based on a mechanistic formulation that is thermodynamically feasible. In doing so the singularity that occurs at ΔΨ = ΔΨ* in previous models does not exist in the current model.
Our CU model simulations show that as IMM depolarizes, mitochondrial Ca2+ uptake as well as maximal uptake velocity and saturating Ca2+ concentration decreases. This is consistent with experimental observations (Fig. 2C). As shown in Fig. 2D, the Ca2+ uptake in cardiac mitochondria saturates beyond [Ca2+]e = 90 μm (KCa,CU = 90 μm and XCU = 2.25 nmol mg−1 s−1). Though precise experimental data were not available to validate these simulations, the Ca2+ uptake kinetics are similar to those of the Ca2+ currents observed in the studies of Kirichok et al. (2004) using patch-clamp techniques in single myoplasts from cardiac mitochondria. However, their reported value of KCa,CU = 19 mm is significantly higher compared to the values obtained here (i.e. KCa,CU = 90 μm for cardiac mitochondria and KCa,CU = 48 μm for liver mitochondria). The lower Km values and saturation points are biologically reasonable. Therefore, we were unable to successfully compare our model simulations relating the Ca2+ influx and IMM ΔΨ to their data relating the Ca2+ current and IMM ΔΨ. Since the data of Scarpa and co-workers (Scarpa & Graziotti, 1973; Vinogradov & Scarpa, 1973) and Gunter and co-workers (Wingrove et al. 1984; Gunter & Pfeiffer, 1990; Gunter et al. 1994) were obtained from the intact mitochondria, we chose these data to characterize the kinetics of the CU instead of the data of Kirichok et al. (2004).
While the available experimental data support a wide range of possible values for the overall activity of the CU in cardiac and liver mitochondria, our model simulations show that even at the highest estimated values, Ca2+ current via the CU does not have a significant effect on the IMM ΔΨ. Within the physiological range of ΔΨ, Ca2+ uptake via the CU is predicted to vary approximately linearly with the IMM ΔΨ at a physiological level of extramitochondrial Ca2+ (fixed). The Ca2+ uptake in state 2 and state 4 respiration (with ΔΨ = 190 mV) is predicted to be about 50% higher than that in state 3 respiration (with ΔΨ = 160 mV) at about 1 μm of extramitochondrial Ca2+, as depicted in Fig. 2C in liver mitochondria. Under all conditions, our model predicts Ca2+ current to be less than 0.001% of the total electron transport chain flux. Therefore, we predict that Ca2+ will not significantly depolarize IMM ΔΨ in vivo under physiological conditions.
Kinetics and stoichiometry of the mitochondrial Na+–Ca2+ exchanger
Another significant contribution of the present modelling efforts to cardiac cell physiology is the characterization of the kinetics and stoichiometry of the mitochondrial NCE which is not well established. To do this, the integrated model of mitochondrial bioenergetics and Ca2+ handling was applied to analyse the experimental data of Cox & Matlib (1993) on the kinetics of mitochondrial NCE (i.e. the dynamics of matrix free [Ca2+] following extra-matrix Na+ additions with the CU blocked) from rabbit heart (Fig. 5 and Figs S1 and S2 of the Supplementary Material). This integrated model analysis reveals that an assumed 3: 1 stoichiometry for the NCE is more consistent with the observed data than the 2: 1 stoichiometry. However, further experimentation may be required to reach a concrete conclusion on the NCE stoichiometry. Reproducing the experiments of Cox & Matlib at known and varying levels of total external buffer Ca2+ with enough replicates for statistical analysis would be valuable to concisely verify the proposed 3: 1 stoichiometry for the NCE.
Analyses also suggest that for a 2Na+–Ca2+ electroneutral exchange with the CU blocked, the trans-membrane gradient of free [Ca2+] at steady state would be negligible with the intra-matrix and extra-matrix free [Ca2+] reaching a ‘single’ equilibrium steady state depending on the concentrations of intra-matrix and extra-matrix Na+ and H+ (pH). The following relationship would indeed hold at the steady state: [Ca2+]x/[Ca2+]e = [Na+]x2/[Na+]e2 = [H+]x2/[H+]e2. However, for a 3Na+–Ca2+ electrogenic exchange with the CU blocked, the trans-membrane gradient of free [Ca2+] at steady state would be significantly high and nearly all the Ca2+ from the matrix would be eventually extruded to the extra-matrix buffer space. Since Cox & Matlib (1993) reported only the first 3 min of data from their experiments, the steady state was not evident. Therefore, recording matrix [Ca2+] for a longer time would provide better kinetic data for characterizing the kinetics and stoichiometry of the mitochondrial NCE.
However, even without these additional data, we were able to validate both our integrated model of mitochondrial bioenergetics and Ca2+ handling and 3: 1 NCE stoichiometry, based on analysis of an additional independent data set from the experimental work of McCormack et al. (1989). As in the case of the analysis of the data from Cox & Matlib (1993), model simulations of these additional data set using the 3: 1 NCE model are consistently better than those obtained using the 2: 1 NCE model. The model analyses also showed a matrix free Ca2+-mediated regulation of the CU flux in regulating the matrix free [Ca2+] in respiring cardiac mitochondria. Based on these analyses, we conclude that the mitochondrial NCE is electrogenic with a stoichiometry of 3: 1, and the matrix free [Ca2+] is regulated by a Ca2+-induced Ca2+ regulation mechanism.
Acknowledgments
This research was supported by grants R01-HL072011 from the National Institute of Health and SDG-0735093N from the American Heart Association. The authors are thankful to Victoria Georgakas and Aleksandra Polosukhina for their contributions in the initial stage of the development of this research project during their summer internship studies with the authors.
Supplemental material
Online supplemental material for this paper can be accessed at: http://jp.physoc.org/cgi/content/full/jphysiol.2008.151977/DC1 and http://www.blackwell-synergy.com/doi/suppl/10.1113/jphysiol.2008.151977
References
- Baysal K, Brierley GP, Novgorodov S, Jung DW. Regulation of the mitochondrial Na+/Ca2+ antiport by matrix pH. Arch Biochem Biophys. 1991;291:383–389. doi: 10.1016/0003-9861(91)90150-h. [DOI] [PubMed] [Google Scholar]
- Baysal K, Jung DW, Gunter KK, Gunter TE, Brierley GP. Na+-dependent Ca2+ efflux mechanism of heart mitochondria is not a passive Ca2+/2Na+ exchanger. Am J Physiol Cell Physiol. 1994;266:C800–C808. doi: 10.1152/ajpcell.1994.266.3.C800. [DOI] [PubMed] [Google Scholar]
- Beard DA. A biophysical model of the mitochondrial respiratory system and oxidative phosphorylation. PLoS Comput Biol. 2005;1:e36. doi: 10.1371/journal.pcbi.0010036. [DOI] [PMC free article] [PubMed] [Google Scholar]
- Beard DA. Modeling of oxygen transport and cellular energetics explains observations on in vivo cardiac energy metabolism. PLoS Comput Biol. 2006;2:e107. doi: 10.1371/journal.pcbi.0020107. [DOI] [PMC free article] [PubMed] [Google Scholar]
- Beard DA, Qian H. Relationship between thermodynamic driving force and one-way fluxes in reversible processes. PLoS ONE. 2007;2:e144. doi: 10.1371/journal.pone.0000144. [DOI] [PMC free article] [PubMed] [Google Scholar]
- Bernardi P. Mitochondrial transport of cations: channels, exchangers, and permeability transition. Physiol Rev. 1999;79:1127–1155. doi: 10.1152/physrev.1999.79.4.1127. [DOI] [PubMed] [Google Scholar]
- Brand MD. Electroneutral efflux of Ca2+ from liver mitochondria. Biochem J. 1985a;225:413–419. doi: 10.1042/bj2250413. [DOI] [PMC free article] [PubMed] [Google Scholar]
- Brand MD. The stoichiometry of the exchange catalysed by the mitochondrial calcium/sodium antiporter. Biochem J. 1985b;229:161–166. doi: 10.1042/bj2290161. [DOI] [PMC free article] [PubMed] [Google Scholar]
- Brookes PS, Yoon Y, Robotham JL, Anders MW, Sheu SS. Calcium, ATP, and ROS: a mitochondrial love-hate triangle. Am J Physiol Cell Physiol. 2004;287:C817–C833. doi: 10.1152/ajpcell.00139.2004. [DOI] [PubMed] [Google Scholar]
- Cortassa S, Aon MA, Marban E, Winslow RL, O'Rourke B. An integrated model of cardiac mitochondrial energy metabolism and calcium dynamics. Biophys J. 2003;84:2734–2755. doi: 10.1016/S0006-3495(03)75079-6. [DOI] [PMC free article] [PubMed] [Google Scholar]
- Cortassa S, Aon MA, O'Rourke B, Jacques R, Tseng HJ, Marban E, Winslow RL. A computational model integrating electrophysiology, contraction, and mitochondrial bioenergetics in the ventricular myocyte. Biophys J. 2006;91:1564–1589. doi: 10.1529/biophysj.105.076174. [DOI] [PMC free article] [PubMed] [Google Scholar]
- Cox DA, Matlib MA. A role for the mitochondrial Na+-Ca2+ exchanger in the regulation of oxidative phosphorylation in isolated heart mitochondria. J Biol Chem. 1993;268:938–947. [PubMed] [Google Scholar]
- Crompton M, Capano M, Carafoli E. The sodium-induced efflux of calcium from heart mitochondria. A possible mechanism for the regulation of mitochondrial calcium. Eur J Biochem. 1976;69:453–462. [Google Scholar]
- Crompton M, Heid I. The cycling of calcium, sodium, and protons across the inner membrane of cardiac mitochondria. Eur J Biochem. 1978;91:599–608. doi: 10.1111/j.1432-1033.1978.tb12713.x. [DOI] [PubMed] [Google Scholar]
- Crompton M, Kunzi M, Carafoli E. The calcium-induced and sodium-induced effluxes of calcium from heart mitochondria. Evidence for a sodium-calcium carrier. Eur J Biochem. 1977;79:549–558. doi: 10.1111/j.1432-1033.1977.tb11839.x. [DOI] [PubMed] [Google Scholar]
- Duchen MR. Mitochondria and calcium: from cell signalling to cell death. J Physiol. 2000;529:57–68. doi: 10.1111/j.1469-7793.2000.00057.x. [DOI] [PMC free article] [PubMed] [Google Scholar]
- Fabiato A. Computer programs for calculating total from specified free or free from specified total ionic concentrations in aqueous solutions containing multiple metals and ligands. Meth Enzymol. 1988;157:378–417. doi: 10.1016/0076-6879(88)57093-3. [DOI] [PubMed] [Google Scholar]
- Gunter TE, Chace JH, Puskin JS, Gunter KK. Mechanism of sodium independent calcium efflux from rat liver mitochondria. Biochemistry. 1983;22:6341–6351. doi: 10.1021/bi00295a046. [DOI] [PubMed] [Google Scholar]
- Gunter TE, Gunter KK, Sheu SS, Gavin CE. Mitochondrial calcium transport: physiological and pathological relevance. Am J Physiol Cell Physiol. 1994;267:C313–C339. doi: 10.1152/ajpcell.1994.267.2.C313. [DOI] [PubMed] [Google Scholar]
- Gunter TE, Pfeiffer DR. Mechanisms by which mitochondria transport calcium. Am J Physiol Cell Physiol. 1990;258:C755–C786. doi: 10.1152/ajpcell.1990.258.5.C755. [DOI] [PubMed] [Google Scholar]
- Harafuji H, Ogawa Y. Re-examination of the apparent binding constant of ethylene glycol bis(β-aminoethyl ether)-N,N,N′,N′-tetraacetic acid with calcium around neutral pH. J Biochem. 1980;87:1305–1312. doi: 10.1093/oxfordjournals.jbchem.a132868. [DOI] [PubMed] [Google Scholar]
- Huang M, Camara AK, Stowe DF, Qi F, Beard DA. Mitochondrial inner membrane electrophysiology assessed by rhodamine-123 transport and fluorescence. Ann Biomed Eng. 2007;35:1276–1285. doi: 10.1007/s10439-007-9265-2. [DOI] [PMC free article] [PubMed] [Google Scholar]
- Jung DW, Apel LM, Brierley GP. Transmembrane gradients of free Na+ in isolated heart mitochondria estimated using a fluorescent probe. Am J Physiol Cell Physiol. 1992;262:C1047–C1055. doi: 10.1152/ajpcell.1992.262.4.C1047. [DOI] [PubMed] [Google Scholar]
- Jung DW, Baysal K, Brierley GP. The sodium-calcium antiport of heart mitochondria is not electroneutral. J Biol Chem. 1995;270:672–678. doi: 10.1074/jbc.270.2.672. [DOI] [PubMed] [Google Scholar]
- Kapus A, Ligeti E, Fonyo A. Na+/H+ exchange in mitochondria as monitored by BCECF fluorescence. FEBS Lett. 1989;251:49–52. doi: 10.1016/0014-5793(89)81426-7. [DOI] [PubMed] [Google Scholar]
- Kapus A, Lukacs GL, Cragoe EJ, Jr, Ligeti E, Fonyo A. Characterization of the mitochondrial Na+-H+ exchange. The effect of amiloride analogues. Biochim Biophys Acta. 1988;944:383–390. doi: 10.1016/0005-2736(88)90509-3. [DOI] [PubMed] [Google Scholar]
- Keener JP, Sneyd J. Mathematical Physiology. New York: Springer; 1998. [Google Scholar]
- Kirichok Y, Krapivinsky G, Clapham DE. The mitochondrial calcium uniporter is a highly selective ion channel. Nature. 2004;427:360–364. doi: 10.1038/nature02246. [DOI] [PubMed] [Google Scholar]
- Li W, Shariat-Madar Z, Powers M, Sun X, Lane RD, Garlid KD. Reconstitution, identification, purification, and immunological characterization of the 110-kDa Na+/Ca2+ antiporter from beef heart mitochondria. J Biol Chem. 1992;267:17983–17989. [PubMed] [Google Scholar]
- McCormack JG, Browne HM, Dawes NJ. Studies on mitochondrial Ca2+-transport and matrix Ca2+ using fura-2-loaded rat heart mitochondria. Biochim Biophys Acta. 1989;973:420–427. doi: 10.1016/s0005-2728(89)80384-6. [DOI] [PubMed] [Google Scholar]
- Magnus G, Keizer J. Minimal model of beta-cell mitochondrial Ca2+ handling. Am J Physiol Cell Physiol. 1997;273:C717–C733. doi: 10.1152/ajpcell.1997.273.2.C717. [DOI] [PubMed] [Google Scholar]
- Miller DJ, Smith GL. EGTA purity and the buffering of calcium ions in physiological solutions. Am J Physiol Cell Physiol. 1984;246:C160–C166. doi: 10.1152/ajpcell.1984.246.1.C160. [DOI] [PubMed] [Google Scholar]
- Mullins LJ. The generation of electric currents in cardiac fibers by Na/Ca exchange. Am J Physiol Cell Physiol. 1979;236:C103–C110. doi: 10.1152/ajpcell.1979.236.3.C103. [DOI] [PubMed] [Google Scholar]
- Nguyen MH, Dudycha SJ, Jafri MS. The effects of Ca2+ on cardiac mitochondrial energy production is modulated by Na+ and H+ dynamics. Am J Physiol Cell Physiol. 2007;292:C2004–C2020. doi: 10.1152/ajpcell.00271.2006. [DOI] [PubMed] [Google Scholar]
- Nguyen MH, Jafri MS. Mitochondrial calcium signaling and energy metabolism. Ann N Y Acad Sci. 2005;1047:127–137. doi: 10.1196/annals.1341.012. [DOI] [PubMed] [Google Scholar]
- O'Rourke B, Cortassa S, Aon MA. Mitochondrial ion channels: gatekeepers of life and death. Physiology (Bethesda) 2005;20:303–315. doi: 10.1152/physiol.00020.2005. [DOI] [PMC free article] [PubMed] [Google Scholar]
- Paucek P, Jaburek M. Kinetics and ion specificity of Na+/Ca2+ exchange mediated by the reconstituted beef heart mitochondrial Na+/Ca2+ antiporter. Biochim Biophys Acta. 2004;1659:83–91. doi: 10.1016/j.bbabio.2004.03.019. [DOI] [PubMed] [Google Scholar]
- Portzehl H, Caldwell PC, Rueegg JC. The dependence of contraction and relaxation of muscle fibres from the crab Maia squinado on the internal concentration of free calcium ions. Biochim Biophys Acta. 1964;79:581–591. doi: 10.1016/0926-6577(64)90224-4. [DOI] [PubMed] [Google Scholar]
- Rizzuto R, Bernardi P, Favaron M, Azzone GF. Pathways for Ca2+ efflux in heart and liver mitochondria. Biochem J. 1987;246:271–277. doi: 10.1042/bj2460271. [DOI] [PMC free article] [PubMed] [Google Scholar]
- Scarpa A, Graziotti P. Mechanisms for intracellular calcium regulation in heart. I. Stopped-flow measurements of Ca2+ uptake by cardiac mitochondria. J Gen Physiol. 1973;62:756–772. doi: 10.1085/jgp.62.6.756. [DOI] [PMC free article] [PubMed] [Google Scholar]
- Segel IH. Enzyme Kinetics. New York: Wiley Interscience; 1993. [Google Scholar]
- Smith PD, Liesegang GW, Berger RL, Czerlinski G, Podolsky RJ. A stopped-flow investigation of calcium ion binding by ethylene glycol bis (β-aminoethyl ether)-N,N′-tetraacetic acid. Anal Biochem. 1984;143:188–195. doi: 10.1016/0003-2697(84)90575-x. [DOI] [PubMed] [Google Scholar]
- Vinnakota KC, Bassingthwaighte JB. Myocardial density and composition: a basis for calculating intracellular metabolite concentrations. Am J Physiol Heart Circ Physiol. 2004;286:H1742–H1749. doi: 10.1152/ajpheart.00478.2003. [DOI] [PubMed] [Google Scholar]
- Vinogradov A, Scarpa A. The initial velocities of calcium uptake by rat liver mitochondria. J Biol Chem. 1973;248:5527–5531. [PubMed] [Google Scholar]
- Wingrove DE, Amatruda JM, Gunter TE. Glucagon effects on the membrane potential and calcium uptake rate of rat liver mitochondria. J Biol Chem. 1984;259:9390–9394. [PubMed] [Google Scholar]
- Wingrove DE, Gunter TE. Kinetics of mitochondrial calcium transport. I. Characteristics of the sodium-independent calcium efflux mechanism of liver mitochondria. J Biol Chem. 1986a;261:15159–15165. [PubMed] [Google Scholar]
- Wingrove DE, Gunter TE. Kinetics of mitochondrial calcium transport. II. A kinetic description of the sodium-dependent calcium efflux mechanism of liver mitochondria and inhibition by ruthenium red and by tetraphenylphosphonium. J Biol Chem. 1986b;261:15166–15171. [PubMed] [Google Scholar]
- Wu F, Jeneson JA, Beard DA. Oxidative ATP synthesis in skeletal muscle is controlled by substrate feedback. Am J Physiol Cell Physiol. 2007a;292:C115–C124. doi: 10.1152/ajpcell.00237.2006. [DOI] [PubMed] [Google Scholar]
- Wu F, Yang F, Vinnakota KC, Beard DA. Computer modeling of mitochondrial tricarboxylic acid cycle, oxidative phosphorylation, metabolite transport, and electrophysiology. J Biol Chem. 2007b;282:24525–24537. doi: 10.1074/jbc.M701024200. [DOI] [PubMed] [Google Scholar]
Associated Data
This section collects any data citations, data availability statements, or supplementary materials included in this article.