

Abstract
Sustained activity at most central synapses is accompanied by a number of short-term changes in synaptic strength which act over a range of time scales. Here we examine experimental data and develop a model of synaptic depression at the calyx of Held synaptic terminal that combines many of these mechanisms (acting at differing sites and across a range of time scales). This new model incorporates vesicle recycling, facilitation, activity-dependent vesicle retrieval and multiple mechanisms affecting calcium channel activity and release probability. It can accurately reproduce the time course of experimentally measured short-term depression across different stimulus frequencies and exhibits a slow decay in EPSC amplitude during sustained stimulation. We show that the slow decay is a consequence of vesicle release inhibition by multiple mechanisms and is accompanied by a partial recovery of the releasable vesicle pool. This prediction is supported by patch-clamp data, using long duration repetitive EPSC stimulation at up to 400 Hz. The model also explains the recovery from depression in terms of interaction between these multiple processes, which together generate a stimulus-history-dependent recovery after repetitive stimulation. Given the high rates of spontaneous activity in the auditory pathway, the model also demonstrates how these multiple interactions cause chronic synaptic depression under in vivo conditions. While the magnitude of the depression converges to the same steady state for a given frequency, the time courses of onset and recovery are faster in the presence of spontaneous activity. We conclude that interactions between multiple sources of short-term plasticity can account for the complex kinetics during high frequency stimulation and cause stimulus-history-dependent recovery at this relay synapse.
The concept of synaptic short-term plasticity (STP) includes various forms of use-dependent changes in synaptic efficacy lasting over time scales of milliseconds to many seconds. These include rapid forms of synaptic depression and facilitation and slower phenomena such as augmentation and post-tetanic potentiation (reviewed by Zucker & Regehr, 2002). A large number of potential pre- and postsynaptic molecular mediators of STP have been identified, but their influence on the various forms of STP is incompletely understood.
To address this question, the use of computational models of STP has proven useful in providing specific, experimentally verifiable predictions. A central assumption in most current models is that depression is mediated by depletion of a release-ready vesicle pool (RRVP) (Liley & North, 1953; Betz, 1970), which predicts that the strength of depression should be proportional to the inverse of the stimulus frequency. Deviations from this behaviour can often be accounted for by combining vesicle depletion with release probability facilitation (Betz, 1970; Varela et al. 1997; Markram et al. 1998). This latter model class, with extensions such as heterogeneous release probabilities (Murthy et al. 1997; Trommershäuser et al. 2003) or activity-dependent vesicle retrieval (Dittman & Regehr, 1998; Graham et al. 2004), has now emerged as a standard framework for STP. However, recent work has also suggested that additional factors, such as calcium channel inhibition (Forsythe et al. 1998; Xu & Wu, 2005; Mochida et al. 2008) or presynaptic autoreceptors (Takahashi et al. 1996; Takago et al. 2005; Billups et al. 2005), can contribute to STP.
In this study, we consider these interactions by analysing voltage clamp recordings and modelling STP at the calyx of Held. The calyx of Held is a large synaptic terminal in the mammalian auditory brainstem, which contacts the principal neurons in the medial nucleus of the trapezoid body (MNTB). Simultaneous pre- and postsynaptic recordings are possible (Forsythe, 1994; Borst et al. 1995; Takahashi et al. 1996), so transmission at this synapse is well documented, and it serves as a model system for other synapses (reviewed by Schneggenburger & Forsythe, 2006). Using a depletion model as a starting point, we investigate the effects of multiple mechanisms acting on different time scales on the synaptic efficacy, as measured by the postsynaptic EPSC amplitude. The minimal model includes a slow and a rapid mode of vesicle recruitment, facilitation and AMPA receptor desensitization, as introduced in earlier studies (Weis et al. 1999; Trommershäuser et al. 2003; Wong et al. 2003; Graham et al. 2004). To integrate findings about slower processes, a fast and slow form of calcium channel inactivation and calcium channel inhibition by presynaptic metabotropic glutamate receptor (mGluR) activation were added.
This model is fitted to patch clamp recordings from the calyx of Held, and compared to the simpler depletion model. This analysis reveals several important differences, and shows that the extended model is necessary to reproduce the full dynamics observed at this synapse. Predictions derived from the model are supported by the analysis of experimental data. We then use the model to assess the possible implications on synaptic function and transmission, and investigate conditions that the synapse encounters in vivo.
Methods
Experimental data
Preparation of brain slices
Brainstem slices containing the superior olivary complex (SOC) were prepared from Lister hooded rats (12–14 days old, killed by decapitation in accordance with the UK Animals, Scientific Procedures Act, 1986; previously described in Wong et al. 2003). In brief, transverse slices (200 μm thick) containing the MNTB were cut in low sodium artificial CSF (aCSF) at 0°C, and slices were then stored at 37°C for 1 h in normal aCSF, after which they were stored at room temperature (∼20°C) until use. Composition of the normal aCSF was (mm): NaCl 125, KCl 2.5, NaHCO3 26, glucose 10, NaH2PO4 1.25, sodium pyruvate 2, myo-inositol 3, CaCl2 2, MgCl2 1, and ascorbic acid 0.5; pH was 7.4 when continuously bubbled with 95% O2–5% CO2.
Imaging and electrophysiology
Imaging was used as previously described (Billups et al. 2002) to identify neurones with intact calyceal synaptic connections. Briefly, MNTB neurons were loaded with 7 μm Fura2 acetoxymethyl ester (Fura2-AM; Molecular Probes, Eugene, OR, USA) for ∼4 min and then viewed with a Photometrics Cool SNAP-fx camera after a single 100 ms exposure to light at 380 nm wavelength (provided by a xenon arc lamp controlled by a Cairn Optoscan monochromater; Cairn Instruments, Faversham, UK). Fluorescent images were displayed using the Metafluor imaging suite software (version 7, Molecular Devices, Sunnyvale CA, USA). A region of interest was drawn around labelled neurons and a train of stimuli (200 Hz, 200 ms) delivered through an external bipolar platinum electrode placed at the midline across the slice from a DS2A isolated stimulator (pulses of ∼8 V, 0.02 ms; Digitimer, Welwyn Garden City, UK). Connected neurons were identified by a reduction in the 380 nm signal due to the postsynaptic rise in calcium concentration following the synaptic stimulation. Cells were then located visually under the microscope and patch clamped.
Whole-cell recordings were made from the identified connected neurons, visualized with a ×40 immersion objective on a Zeiss Axioskop microscope fitted with differential interference phase contrast (DIC) optics, using either an Axopatch 200B, or a multiclamp 700B amplifier and pCLAMP 9.2 software (Molecular Devices), sampling at 50 kHz and filtering at 10 kHz. Patch pipettes were pulled from filamented borosilicate glass (GC150F-7.5, outer diameter 1.5 mm; inner diameter 0.86 mm; Harvard Apparatus, Edenbridge, UK) with a 2-stage vertical puller (PC-10 Narishige, Tokyo, Japan). Pipettes were used with tip resistances of ∼3.5 MΩ when filled with a solution containing (mm): potassium gluconate 97.5, KCl 32. 5, Hepes 10, EGTA 5, MgCl2 1, and QX-314 5 (pH adjusted to 7.3 with KOH; osmolarity 310 mosmol l−1). Whole-cell access resistance was < 15 MΩ and series resistance routinely compensated by 70%. Evoked EPSCs recorded in the whole-cell configuration were elicited at varying frequencies by stimulation of the presynaptic trapezoid body axons with the midline-positioned bipolar electrode using the same parameters as above.
Recordings were taken at either room (∼22°C) or physiological temperature (37 ± 1°C) which was controlled by an environmental chamber and heat exchange, built into the microscope stage. The temperature was maintained by feedback control with Peltier devices warming the aCSF passing through a low volume perfusion system at 1 ml min−1. A ceramic water-immersion objective coated with Sylgard was used to reduce the thermal sink of the immersion objective lens.
Computational model
A model was developed to simulate the postsynaptic EPSC amplitude in response to presynaptic action potentials (APs) at the calyx of Held, which includes a variety of processes contributing to STP (Fig. 1). Each process was implemented as a deterministic model by linear first-order differential equations, and the corresponding state variables represent relative amounts bound between [0: 1]. The model consists of a presynaptic compartment, where glutamate is released, and a postsynaptic compartment, where the current response is generated by AMPA receptors. The magnitude of the postsynaptic current following a presynaptic AP depends on the presynaptic dynamics regulating transmitter release, and on postsynaptic AMPA receptor desensitization.
Figure 1. Schematic illustration of the different signalling pathways included in the model.

Arrows indicate positive and filled circles negative interactions. Green lines indicate pathways implicated in vesicle trafficking, red lines the calcium-dependent processes, and blue lines the glutamate-dependent processes. Processes that are strongly activated by a single presynaptic action potential are drawn as thick lines. Variable names and rate constants are specified as used in eqns (1)–(10). The kinetic scheme summarizes eqns (6)–(10). Abbreviations: Glu, glutamate; VGCa Channel; voltage-gated calcium channel; mGluR, metabotropic glutamate receptor; AMPAR, AMPA receptor. See Methods for a detailed description.
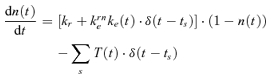
The fraction of transmitter T(t) released from the presynaptic terminal during stimulation with a single AP depends on the RRVP occupancy n(t) and the release probability pr(t):
| (1) |
Following earlier models (Betz, 1970; Markram et al. 1998; Dayan & Abbott, 2001; Wong et al. 2003; Graham et al. 2004), both the release probability and vesicle pool size are dynamic variables, which allows for modelling of vesicle pool depletion, release probability facilitation and further presynaptic sources of STP.
As in previous models, vesicle pool depletion was considered as a main source of synaptic depression (Liley & North, 1953; Tsodyks & Markram, 1997; Abbott et al. 1997): two different vesicle pools exist, a large (assumed infinite-sized) reserve pool and a smaller release-ready vesicle pool n(t) (RRVP). Released vesicles are replaced from the reserve pool at a rate kr. In addition, a rapid form of vesicle retrieval ke(t) with linear dependence on the calcium concentration (Hosoi et al. 2007) was included (Wang & Kaczmarek, 1998; Wu et al. 2005):
| (2) |
where ke+ is the activation rate following APs at times {ts}, τe the decay time and c1(t) the relative magnitude of the AP-evoked calcium transient (see below). The releasable vesicle pool was modelled as a continuous variable n(t), with n(t) = 1 corresponding to all available sites containing a docked vesicle. Not counting discrete numbers of vesicles is possible because the calyx has a very large RRVP (estimates range from 1800 up to > 4000 vesicles (Sakaba & Neher, 2001b; Yamashita et al. 2005), distributed across 500–600 active zones (Sätzler et al. 2002)). The dynamics of the RRVP is defined by:
 |
(3) |
The maximal rate of activity-dependent vesicle retrieval is given by kem. The factor (1 – n(t)) ensures that the pool has a limited maximal size, i.e. each release site (active zone) has a limited number of ‘docking’ sites for vesicles.
AP-evoked vesicular transmitter release is triggered by calcium entering through voltage-gated calcium channels, with a highly non-linear relation between calcium concentration and release rate (Borst & Sakmann, 1999; Sakaba & Neher, 2001b; Lou et al. 2005). Changes in the AP-evoked intracellular calcium concentration [Ca2+]i were explicitly modelled (see below), and a 4th power-law relation determines the corresponding release probability pr(t):
| (4) |
where C0 is a scaling factor. As a result, small changes in [Ca2+]i can translate into large changes in pr(t).
Experiments have shown that the presynaptic AP-evoked calcium transient amplitude [Ca2+]i is affected by a variety of processes. Calcium channel facilitation, causing an increase in calcium influx during repeated stimulation (Borst & Sakmann, 1998; Cuttle et al. 1998), accumulation of residual calcium (Felmy et al. 2003a) and the effect of calcium buffers (Müller et al. 2007) are candidates for facilitatory effects, and depressing effects are expected from calcium channel inactivation (Forsythe et al. 1998) and calcium channel suppression due to activation of G-proteins for instance by presynaptic mGluR (Takahashi et al. 1996) or AMPAR (Takago et al. 2005) activation. A phenomenological model of these effects was implemented by the following set of equations:
| (5) |
 |
(6) |
| (7) |
| (8) |
| (9) |
| (10) |
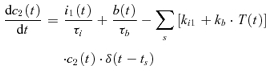
The variable c1(t) (eqn (5)) describes the evolution of [Ca2+]i = c1(t). Facilitation is modelled by increasing c1(t) by the amount kf after each presynaptic AP, which decays with τf to c2(t). The variable c2(t) accounts for the suppression of the calcium current by inactivation and mGluR/AMPAR activation (eqns (6)–(9)). Inactivation was modelled as a reversible process from a resting (c2) to the inactivated state i1 with a rate ki1 (eqn (7)) and relaxation time constant τi1. From i1, a further inactivated state is accessible with a rate ki2, which recovers slower than i1 with the time constant τi2 (eqn (8)). The effect of presynaptic mGluR/AMPAR activation was modelled by a transition from the resting state c2 to a blocked state b with a forward rate kb × T(t) (eqn (9)), and a recovery time τb. This represents a simple model of the effect of presynaptic glutamate autoreceptors (mGluRs or AMPARs) on calcium channels via G-protein activation (Billups et al. 2005), which ignores the activation kinetics of reaction intermediates in this process.
The postsynaptic response depends on the amount of released transmitter T(t), and is modulated by AMPAR desensitization (Wong et al. 2003). Desensitization was modelled by a reversible transition into a desensitized state of the receptors with an increment kd and recovery time τd:
| (11) |
The postsynaptic response was then calculated as:
| (12) |
The model was implemented in MATLAB (Version 7.2; MathWorks, Natick, MA, USA). The differential equations were numerically integrated using the ode45 function. All parameters used to simulate the pooled experimental data (see Results) are summarized in Table 1. The source code is available at ModelDB (http://senselab.med.yale.edu/modeldb/; accession number 113649).
Table 1.
The model parameters used in all simulations, except where noted differently
Model-fitting procedure
A combination of manual and automated non-linear curve fitting was used to fit simulated normalized EPSC amplitudes to experimentally obtained EPSCs during presynaptic stimulation with regular spike trains (Fig. 2A and B). The experimental data showed two characteristic features: transient depression that increased in strength with increasing stimulus frequency, and a second, slow exponential component at high frequencies. These, and the finding that AMPAR desensitization only contributes at stimulus frequencies ≥ 50 Hz (Wong et al. 2003), were exploited to fit different aspects of the model at a low (10 Hz) and high stimulus frequency (100 Hz).
Figure 2. Time course of synaptic depression at the calyx of Held and model fits.

A, depression of the EPSC amplitude (normalized, average data from n = 14 cells) during stimulation lasting 1 s at 10, 20, 50 and 100 Hz in linear (left) and double-logarithmic (right) coordinates. B, average EPSC amplitudes from all 14 cells (grey) and the population average (black) for 10 Hz (left) and 100 Hz (right) stimulation, plotted in double-logarithmic coordinates. Note that all cells show an initial depression approximating a power-law time course, which then terminates into a slower decay. C and D, experimental data for all frequencies (crosses) and model fits (black lines) for the whole population (C) and an individual cell (D) for the full model (left), and the reduced ‘depletion model’ (right), which does not include slow calcium channel inhibition. Only the full model can accurately fit the late, slow EPSC decay at high frequencies. Parameters are as follows. Pooled data, full model: Table 1; pooled data, depletion model: ke = 0.19 s−1, C0 = 0.2522, kd = 2.13 s−1, τd = 0.032 s; single cell, full model: ke = 0.57 s−1, C0 = 0.4071, kd = 2.56 s−1, τd = 0.019 s; single cell, depletion model: ke = 0.34 s−1, C0 = 0.3862, kf = 0.036 s−1, kd = 2.39 s−1, τd = 0.025 s. Error bars in A and B show ± 1 s.e.m.
First, several parameters were fixed to plausible values: the time constant for the slow vesicle retrieval was set to 4.4 s; the decay time for facilitation to 40 ms (Cuttle et al. 2001; Müller et al. 2007); the decay time for the calcium current inhibition mediated by mGluR activation to 10 s (Billups et al. 2005). The decay times for fast and slow calcium channel inactivation were set to 0.3 s and 20 s, respectively. These values are speculative, but were chosen to account for the multiple kinetic components identified in voltage-gated calcium channel inactivation (Forsythe et al. 1998; Patil et al. 1998; Hering et al. 2000; Lee et al. 2000). Then, the basal release probability (determined by C0), the rate and the decay time constant for activity-dependent vesicle recruitment were optimized against data recorded at low stimulus frequencies (10 and 20 Hz at room temperature, 50 Hz at physiological temperature; using the ‘fminsearch’ function in Matlab). These values were then kept fixed, and the rate and decay time of AMPAR desensitization was optimized against the 100 Hz data. At this stage, it was usually possible to improve the fit of the slow decay at 100 Hz either by manual adjustment or further optimization of the slow calcium channel inhibition, because, for fixed decay time constants, the activation constants primarily determine the (exponential) slope of the decay. The procedure was then repeated with fixed values for slow calcium channel inhibition until the data for all four frequencies tested were reproduced with a single set of parameters.
Results
Experimental data
A set of voltage-clamp recordings from 14 MNTB neurons was analysed and used to fit the model (Wong et al. 2003). EPSCs were recorded at room temperature during stimulation of the trapezoid body inputs with 1 s trains at 10, 20, 50 and 100 Hz stimulation frequency (Fig. 2A and B). A considerable variability of the first EPSC amplitude between individual cells was found (ranging from 1.2 nA to 9.4 nA, mean 3.5 ± 2.1 nA (mean ± s.d.); Fig. 2B). All neurons showed strong, frequency-dependent depression during the first 10 EPSCs, and the strength of depression was correlated with the initial EPSC amplitude (P < 0.002 for the first two EPSCs at frequencies ≥ 50 Hz). In addition to strong initial depression, a further slower component of depression was evident for stimulation at 50 or 100 Hz. These two components of depression are best illustrated in a double-logarithmic representation of the EPSC amplitudes (Fig. 2A, right, and B). At 10 and 20 Hz, the stimulus duration of 1 s was not sufficient to resolve this second phase of depression. Recordings using longer stimuli, however, indicated that the slow, late depression is not present at low frequencies (see below). The magnitude of the slow EPSC amplitude decay was variable from cell to cell and fitted by a single exponential function. The average decay time constant, measured at 100 Hz in the interval from 300 ms to 1 s, was 27 ± 20 s (mean ± s.d., range 9 s to 85 s). It will be shown below that this trend continues in longer recordings. We also note that the slow decay is also visible in recordings where postsynaptic AMPA receptor desensitization was minimized by application of γ-DGG (4 mm) or kynurenate (2 mm), indicating a presynaptic origin (data not shown; cf. Wong et al. 2003).
Modelling synaptic depression
To reproduce the observed dynamics of synaptic depression, mathematical descriptions of different experimentally identified activity-dependent processes were combined in a model to simulate EPSCs in response to trains of presynaptic APs (Fig. 1 and Methods). As in earlier studies (Liley & North, 1953; Tsodyks & Markram, 1997; Abbott et al. 1997), depletion of the readily releasable vesicle pool (RRVP) contributes to synaptic depression. Motivated by experimental results (Wang & Kaczmarek, 1998; Wu et al. 2005) and earlier theoretical work (Weis et al. 1999; Wong et al. 2003; Graham et al. 2004), a rapid calcium-dependent mode of vesicle retrieval was included, which reduces depletion and is necessary for maintained transmission at high frequencies. Postsynaptic AMPA receptor desensitization was included, which contributes to depression at stimulus frequencies ≥ 50 Hz (Wong et al. 2003). In addition, as a second site of activity-dependent regulation, modulation of the release probability pr was considered. Unlike in earlier studies, however, the release probability was calculated from the magnitude of the calcium transient at the release site (release transient), taking into account the highly non-linear relation between the calcium concentration [Ca2+]i and pr (Methods, eqn (4)). As a first step, release probability facilitation with a fast decay time was included, which contributes to facilitation at higher stimulus frequencies (Wong et al. 2003). In this configuration, the model is conceptually similar to classical depletion models with facilitation (Betz, 1970; Markram et al. 1998; Dayan & Abbott, 2001), which have also been used to model transmission at the calyx of Held (Wong et al. 2003; Graham et al. 2004). Because here synaptic depression results from vesicle pool depletion, it will in the following be referred to as the depletion model.
This basic model was further extended by including multiple, activity-dependent changes of the release probability resulting from suppression of calcium channels. The processes considered here are fast and slow modes of calcium channel inactivation and calcium channel inhibition by presynaptic autoreceptor (mGluR/AMPAR) activation. In this and the following sections, this full model will be compared to the depletion model to highlight the significant qualitative differences between these two model classes.
By combining non-linear optimization with manual parameter adjustment to physiologically plausible values (Methods), very tight fits to the experimental data were obtained (Fig. 2C and D, plots on left). Both the rapid entry into depression and the slow decay at high frequencies could be reproduced by a single set of parameters for all four stimulus frequencies. In comparison, the depletion model could reproduce the initial phase of depression, but could not account for the late slow decay (Fig. 2C and D; compare plots on left and right).
In total, for 12 of the 14 cells used here, good fits were obtained. Where the fitting procedure failed, the data were noisy, which prevented the fitting algorithm finding appropriate minima. For seven additional cells, the fit of the EPSCs at 10 Hz was unsatisfactory for the same reason, but fits at higher frequencies were still accurate. The parameter ranges encountered were (mean ± s.d.): C0 = 0.324 ± 0.165 (release probabilities: pr(t = 0) = 0.268 ± 0.118); ke+ = 0.31 ± 0.20 s−1; kd = 2.18 ± 0.78 s−1; τd = 0.026 ± 0.016 s.
The robustness of the optimization procedure can be investigated by considering solutions of eqn (3) at times when the fast varying quantities have settled to their steady-state values, and solve for dn(t)/dt = 0. Then we obtain < n > × < p > = (kr + kem < ke >)(1 – < n >), where < > denotes average quantities at steady state. At low frequencies around 10 Hz, we can assume a constant release probability < p > = pr(t = 0), as facilitation has no effect (Wong et al. 2003), and calcium channel inhibition develops very slowly (see below). Then, the steady-state EPSC amplitude is primarily a function of < p >, kr and < ke >. Passive vesicle retrieval kr is very slow, hence has little impact on the EPSC amplitude. This leaves the release probability and the rate of activity-dependent vesicle retrieval as the relevant parameters, which could be reliably optimized against the experimental data. In the fits to data from individual cells, we found that the estimated release probability was positively correlated with the first EPSC amplitude, indicating a heterogeneity in release probability between cells (Schneggenburger et al. 1999). There was, however, no systematic variation of the rate of activity-dependent vesicle retrieval with initial EPSC amplitude, which determines the steady-state EPSC amplitude.
At higher stimulus frequencies, facilitation and AMPAR desensitization contribute to STP (Wong et al. 2003), as well as the different mechanisms of calcium channel inhibition. The latter primarily determine the slope of the late, slow EPSC amplitude decay, and were kept fixed as they had a negligible effect on the optimization of other parameters. For a more accurate estimation of these parameters, we also used longer recordings (see below). The remaining parameters for facilitation and desensitization affect both the time course of the early entry into depression and the steady-state response, and different parameter combinations could yield fits of similar quality. Therefore, the parameters for facilitation were fixed at values that reproduced the time course of presynaptic calcium current recordings (Forsythe et al. 1998; Xu & Wu, 2005), and the optimization was restricted to parameters for desensitization. These parameters also showed a considerable variability, but no correlation with other parameters was evident. It is therefore not clear at this stage whether this heterogeneity is an artifact of the fitting procedure, or reflects true differences in the physiology.
Slow release probability reduction leads to partial vesicle pool recovery
To explain the qualitative differences between the two variants of the model, the evolution of the main state variables during stimulation at different frequencies are shown in Fig. 3 for both model types. We first consider responses at high frequencies ≥ 50 Hz. Here, an initial facilitation of the calcium release transient is accompanied by a corresponding increase of the release probability in both models (Fig. 3B). During the 100 Hz stimulus, facilitation of the calcium release transient peaks at about the 1.12-fold of its initial value, which is consistent with presynaptic recordings at the calyx of Held (Forsythe et al. 1998; Xu & Wu, 2005). This causes a 1.5-fold increase in release probability due to the non-linear relation between calcium concentration and release probability (Fig. 3C), and leads to a rapid depletion of the RRVP (Fig. 3D). It should be noted that, consistent with experimental findings, release probability facilitation leads to EPSC facilitation at high frequencies, but this effect is largely masked by AMPAR desensitization (data not illustrated, see also Wong et al. 2003).
Figure 3. Comparison of the full (left plots) and simpler depletion model (right plots).

Normalized mean EPSC amplitudes and model fits for 10, 20, 50 and 100 Hz stimulation, replotted from Fig. 2, are shown in A. Further shown are the normalized amplitude of the simulated calcium release transient (B), the resulting release probability (C) and the normalized vesicle pool occupancy (D). Note that a slow reduction of the release probability leads to partial vesicle pool recovery in the full model.
For the full model, facilitation becomes gradually less effective as calcium channel inhibition increases after about 80 ms (Fig. 3B). After a 1 s stimulus train at 100 Hz, the calcium release transient is reduced to about 88% of its initial value. A similar decrease of the presynaptic calcium current amplitude was found experimentally in presynaptic recordings (Forsythe et al. 1998; but note that these currents were recorded with 1 mm external Ca2+; see also Discussion), and an even stronger decrease was recently reported by Xu & Wu (2005). This leads to a slow reduction of the release probability to about 63% of its initial value. In parallel, a slow EPSC amplitude decay and a slow recovery of the releasable vesicle pool can be observed (Fig. 3D). The depletion model does not show this behaviour; here the release probability and the releasable vesicle pool occupancy quickly reach their steady-state values (Fig. 3C and D, plots on the right).
The different behaviour of the two models is easily understood when eqn (3) is solved and fast, non-stationary processes are ignored. This yields the expression n × pr ≈ < ke > × (1 – n), where < ke > is the average rate of activity-dependent vesicle recycling. This shows that a slow reduction of prel (as caused by calcium channel inhibition) is partially compensated by an increase in n, such that the amount of released transmitter n × prel remains almost constant. This behaviour depends on the amount of activity-dependent vesicle recycling, which also determines the steady-state EPSC amplitude. Due to the factor (1 – n), the compensation of a reduction in prel is stronger if n is smaller (i.e. during high frequency stimulation), but never complete, which leads to the observed slow decay of the EPSC amplitude. We note that this behaviour only occurs if the size of the releasable vesicle pool is limited to a maximum (i.e. a limited number of ‘docking’ sites exist); if the activity-dependent recycling is unbound, the compensation is complete and no slow EPSC decay is observed (Billups et al. 2005; Hennig et al. 2007).
At lower frequencies < 50 Hz, release probability facilitation is not implicated in the release process (Fig. 3B), and the initial phase of depression is mainly caused by depletion of the RRVP. In the full model, depletion develops slower than in the depletion model. After 1 s of 10 Hz stimulation, the occupancy is 46% in the full, but 40% in the depletion model. This difference is, again, a consequence of calcium channel inhibition in the full model, resulting in reduction of the release probability and concomitant refilling of the RRVP. This effect is weaker at low frequencies because calcium channel inhibition is less effective and because of an overall weaker RRVP depletion.
Overall, when simulating a prolonged stimulation, the response becomes stationary after about 35 s. At 100 Hz, the calcium release transient amplitude then settles to about 57%, causing a release probability reduction to 12% and a vesicle pool recovery to 61% from an initial depletion to 14%. At 10 Hz, a decrease in release probability is accompanied by a weaker recovery of the RRVP from 49% to 60%.
Experimental characterization of transmission during prolonged stimulation at physiological temperature
The simulations predict that a gradual reduction of the release probability should lead to a prolonged slow decay of the EPSC amplitude. The duration of the decay would depend on the slowest process affecting the release probability (here slow calcium channel inactivation), hence it should be clearly visible in experiments using long stimulation protocols. To test this, EPSCs obtained during 20 s stimulation at frequencies up to 400 Hz were analysed. These experiments were carried out at 37°C, where the calyx of Held is capable of maintaining accurate transmission even at high frequencies (Taschenberger & von Gersdorff, 2000).
In agreement with the theoretical results, a slow decay of the EPSC amplitude is clearly visible at frequencies ≥ 100 Hz in six cells investigated, following a rapid initial entry into depression (Fig. 4). In addition, presynaptic AP failures, identified by stimulus artifacts not followed by a measurable current response (Fig. 4B, red dots) were found to affect transmission at frequencies > 100 Hz. The frequency and time where AP failures were observed were different for each cell (200–400 Hz, after about 8–10 s), but highly reproducible in single cells (data not illustrated). While a slow EPSC amplitude decay was visible before the onset of AP failures in all recordings, the EPSCs became more irregular in the presence of failures, and no clear trend was visible anymore. Instead, the mean EPSC amplitude increased again slightly. This is possibly due to reduced stimulus-induced depression, because the stimulus frequency is effectively reduced in the presence of presynaptic AP failures. Hence it was not possible to fully assess the duration of the slow EPSC amplitude decay in these experiments.
Figure 4. A slow EPSC amplitude run-down continues during prolonged stimulation at high frequencies.

A, EPSCs recorded during 20 s stimulation at 200 Hz (A) and 400 Hz (B) at 37°C. Stimulation artifacts were removed for clarity. Blue dots indicate individual EPSC peaks, and grey lines show exponential fits of the EPSC peak amplitude decay. In B, red dots show presynaptic action potential failures. Insets show normalized EPSCs at different time points after stimulus onset (stimulus artifacts were rescaled for clarity). Below, the latency between the positive deflection of the stimulus artifact and the EPSC peak (time to peak) is shown. Grey lines show exponential fits.
The EPSC amplitude decay is well described by a single exponential function (Fig. 4, grey lines). This analysis was carried out in the interval from 1 s after stimulus onset to the point where action potential failures were first observed. For six cells investigated, the measured time constants are 20.7 ± 5.6 s (mean ± s.d.) at 200 Hz and 6.1 ± 2.2 s at 400 Hz. The frequency-dependent decrease is statistically significant (P < 0.001; 2-tailed t test).
We also investigated changes of the EPSC latency (measured from the positive deflection of the stimulus artifact to the EPSC peak), because a change in latency might indicate a change in presynaptic calcium influx, which in turn would affect the release probability (Felmy et al. 2003b). In all cells, a clear increase in EPSC latency, beginning at an initial value of about 0.5 ms was found (Fig. 4). During the course of the recording, the latency increase always showed three distinct phases. The first phase, which was well described by an exponential function, lasted about 8–10 s, and was followed by a shorter (1–3 s) phase of rapid increase. The rapid increase always coincided with the onset of action potential failures at high frequencies and could therefore indicate changes in AP waveform or other presynaptic effects. Finally, the EPSC latency reached a stationary value of about 1 ms. The time constants for the initial latency increase were estimated as 100 ± 39 s (mean ± s.d.) at 200 Hz and 18 ± 12 s at 400 Hz. This frequency-dependent acceleration was statistically significant (P < 0.001; 2-tailed t test).
When the EPSC latency is interpreted as a measure of the release probability, and the EPSC rundown is, as predicted by the model, caused by slow reduction of the release probability, the time constants for latency increase and EPSC rundown should be correlated. A statistically significant correlation was indeed found for the pooled data set (r = 0.92; P < 0.001) and at 400 Hz (r = 0.83; P < 0.05), but not at 200 Hz (r = 0.69; P > 0.05). It should be noted that the EPSC kinetics remained almost unchanged during the course of the stimulus (Fig. 4; insets), indicating no or little change in the calcium release transient waveform and AMPAR kinetics. In particular, no significant change in EPSC decay time constants were detected, but it became increasingly more variable, possibly indicating a loss in synchrony of release after prolonged stimulation.
The model further predicts that a reduction in release probability is accompanied by refilling of the RRVP. When binomial statistics are assumed for the release process, the mean EPSC amplitude is < E > = npq, where n is the number of releasable vesicles, p the release probability and q the quantal current, and its variance < (E – < E >)2 > = npq2(1 – p). If q is assumed constant, a reduction in p and increase in n would therefore lead to a decrease of the EPSC amplitude variance, and a reduction in p to an increase of the ratio of the variance to its mean (< (E – < E >)2 > / < E > = q(1 – p)). To estimate these quantities from single trials, we assume that after the first 0.5 s, AMPAR desensitization is stable and therefore the quantal current q is constant. We further assume that changes in the release probability and RRVP occupancy are very slow. Then the synaptic response may be considered stationary over short intervals of 1–2 s, and the mean and variance of the EPSCs can be calculated in a sliding window in data from single trials. The result of this analysis for four cells stimulated at 200 Hz for 20 s, where no transmission failures occurred, is shown in Fig. 5. To account for asynchronous release during the late part of the response, not the peak EPSC amplitude, but the EPSC charge, integrated over 1 ms, was used to quantify the release (calculating the charge over an adaptive window did not change the results). The response was analysed in 1 s intervals using a 2 s window. Consistent with the model prediction, a decrease in variance (Fig. 5A) and an increase in the variance/mean ratio during the late phase of the stimulus (Fig. 5B) is visible for all cells.
Figure 5. Single-trial variance/mean analysis of EPSCs during stimulation at 200 Hz.

Mean and variance of the EPSC charge, integrated over 1 ms, were estimated from the EPSCs in a sliding window (window size 2 s; step size 1 s; beginning at 0.5 s after stimulus onset). A, estimated variance for four single cells (grey curves) and the average variance (black curve). B, variance/mean ratio for single cells (grey curves) and the average ratio (black curve), normalized to the first bin. Error bars show ± 1 s.e.m.
Model fits for long stimulation
The model could also reproduce depression of the EPSC amplitude during prolonged stimulation at 37°C. Figure 6A illustrates a series of fits to recordings from a single cell during stimulation at 50, 100 and 200 Hz. As shown above, release probability inhibition is increasingly stronger at higher frequencies, which leads to stronger EPSC amplitude decay and partial refilling of the RRVP (Fig. 6B).
Figure 6. Model fits to a series of 15 s long recordings at physiological temperature from a single cell.

A, model (lines) and recorded EPSC amplitudes (dots) during stimulation at 50, 100 and 200 Hz (at 100 Hz every 5th and at 200 Hz every 10th data point is shown for clarity). Insets show the same data replotted in double-logarithmic coordinates to illustrate the slow EPSC amplitude decay (all data points are shown). The experimental EPSC amplitudes were normalized with respect to the mean first EPSC amplitude across all trials. Model parameters are as in Table 1, except: C0 = 0.1807 (pr = 0.16), kem = 63 s−1, τe = 0.025 s, ki1 = 0.0022 s−1, ki2 = 0.0013 s−1, kb = 0.0031 s−1. B, simulated time course of the release probability (left) and RRVP occupancy (right) for the three different frequencies. C, simulated EPSC amplitude during stimulation at 200 Hz for the full model, the model without mGluRs or inactivation and without any form of calcium channel inhibition.
The most prominent difference to the fits obtained at room temperature was that the rates for the activity-dependent vesicle retrieval were strongly increased. This is consistent with the experimental findings that temperature affects primarily endocytosis and AMPA receptor gating (Kushmerick et al. 2006; Postlethwaite et al. 2007; Renden & von Gersdorff, 2007), where the latter leads to overall larger EPSC amplitudes. No significant changes in parameters for AMPAR desensitization were required. In addition, in these fits it was possible to better constrain the rate constants for the slow processes mediating the slow EPSC amplitude decay via release probability inhibition, which differ from those estimated at room temperature (Table 1). A comparison of fits to data from different cells suggests that these rates are highly variable, causing the observed differences in magnitude and time course of the slow decay.
Removing the different components of calcium channel inhibition from the model shows their relative contribution to the final response (Fig. 6C). The model for calcium channel inactivation includes a fast and a slowly activating component, with fast and slow relaxation, respectively. Removing it therefore strongly reduces the EPSC amplitude decay and RRVP recovery. The effect of autoreceptor activation develops and decays slowly, and is therefore weaker and makes a significant contribution only 1–2 s after stimulus onset. Note that during the first 1 s of stimulation, all effects on the EPSC amplitude are very small and therefore probably not resolvable in experiments using short stimuli (Billups et al. 2005).
Effects of stimulus history on recovery from synaptic depression
The results discussed so far suggest that it may take a considerable time before transmission at the calyx of Held can be considered stationary, i.e. when all processes have reached their steady-state activity. Therefore, one would expect a strong influence of the stimulus history on the behaviour of the synapse. To test this in the model, the stimulus-dependence of recovery from depression was investigated. The time course of recovery from depression after 1 s stimulation was investigated at different stimulus frequencies (1, 10 and 100 Hz; Fig. 7A), and recovery curves were obtained for the EPSC amplitude (Fig. 7A, top), the RRVP occupancy (Fig. 7A, bottom left), the calcium release transient (Fig. 7A, top right) and the release probability (Fig. 7A, bottom right).
Figure 7. Recovery from synaptic depression is frequency-dependent in the model.

A, stimulation-evoked changes and recovery curves of the EPSC amplitude (top left), the RRVP occupancy (bottom left), calcium release transient (top right) and corresponding release probability (bottom right). Conditioning stimuli were presented for 1 s at 1, 10 and 100 Hz, and recovery curves were obtained by applying test stimuli at different intervals after the conditioning stimulus. B, the EPSC recovery curves from A, replotted in a double-logarithmic representation (data points shown by crosses). Dotted lines: exponential fits to the late part of the recovery curves; dashed lines: fits with a power-law function multiplied by an exponential (eqn (13)); continuous lines: fits with a sum of the product of a power-law and an exponential and an additional exponential.
A comparison of the recovery curves for the EPSC amplitude shows that their shape strongly depends on the stimulus frequency: with increasing frequency, the total recovery time increases, but in addition, a fast, non-exponential initial phase appears. The recovery of the RRVP on the other hand has a similar, exponential time course at all frequencies. For higher frequencies ≥ 10 Hz, however, an initial rapid recovery is visible, which is a consequence of fast, activity-dependent vesicle recruitment, which is activated more efficiently during high-frequency stimulation. The recovery of the release probability is also frequency-dependent, and, similar to the EPSC, has a fast early and slow late phase. The fast phase is mediated by the recovery of fast calcium channel inactivation, and the slow component by autoreceptor activation and slow inactivation. This shows that frequency-dependent recovery curves in this model are the result of different relative activation of multiple activity-dependent processes. This behaviour vanishes in the depletion model; here the EPSC recovery curves assume an exponential form and are identical at different frequencies apart from a slight initial acceleration at high frequencies, which is caused by a stronger activity-dependent vesicle recruitment (not illustrated).
To illustrate their non-exponential character, the EPSC recovery curves are replotted in Fig. 7B in a double-logarithmic representation. For all frequencies, their shape clearly differs from an exponential decay (parabolas shown as dotted lines), or a sum of two exponentials, as has been previously used to describe recovery from depression (Wang & Kaczmarek, 1998; Dittman & Regehr, 1998). A better description is given by a power law, which terminates with an exponential decay:
| (13) |
R(Δt) now describes the EPSC amplitude evoked by a test stimulus Δt seconds after the first stimulus, where α is the slope of the power law, τ the exponential decay time constant and A a scaling factor (Fig. 7B, dashed lines). At low frequencies (1–10 Hz), an additional exponential decay in eqn (13), which covers the very late, slow component of the EPSC recovery, could further improve the fit (Fig. 7B, continuous lines). However, this additional term only makes a very small, negligible contribution.
The combined effects of stimulus frequency and duration on the recovery from depression are summarized in Fig. 8. The exponential recovery time (τ) increases with stimulus frequency and duration, consistent with an increasing contribution of slowly decaying release probability inhibition. The exponent of the initial power-law recovery (α) is highest for short stimuli at high frequencies, and gradually decreases with increasing frequency and stimulus duration. For low-frequency stimuli at around 10 Hz, a significant power-law component is also visible for long stimulus durations.
Figure 8. Summary of the effects of stimulus frequency and duration on recovery from synaptic depression.

The exponential decay time constant τ (top) and the estimated slope α of the power law (bottom) according to eqn (13) as a function of stimulus duration for stimuli at 10, 50 and 100 Hz.
In summary, this shows that after several seconds of intense stimulation, recovery primarily follows a very slow exponential time course, as shown by Forsythe et al. (1998). For short high-frequency stimuli, however, recovery is initially dominated by a rapid, power-law time course before terminating in a slow exponential component. Importantly, the precise time course of recovery strongly depends on stimulus intensity and duration.
Synaptic transmission under natural conditions
Sound stimuli presented in vivo cause bursts of activity embedded in low-frequency background activity in auditory nerve fibres (Kopp-Scheinpflug et al. 2003). Background activity has been shown to chronically depress the calyx of Held (Hermann et al. 2007). To investigate the model behaviour under these conditions, the transmission of a short test stimulus, embedded into constant background firing, was simulated (Fig. 9). Different frequencies of the test stimulus (Fig. 9A) or background activity (Fig. 9B) were tested.
Figure 9. Transmission of stimuli in the presence of maintained background activity.

A, a 0.5 s stimulus at 20, 50, 100 or 200 Hz was embedded into constant 10 Hz background firing (80 s after onset of the background activity). The release probability (top left), the RRVP occupancy (top right) and the EPSC amplitudes (bottom) are shown. B, EPSC amplitudes for a 0.5 s stimulus at 100 Hz, embedded in background activity at 5, 10, 20 and 50 Hz (top: absolute EPSC amplitudes; bottom: EPSC amplitudes during stimulation (left) and recovery (right), normalized to the steady-state value during background activity). The inset (bottom right) shows the recovery curves normalized to the last EPSC amplitude during stimulation. Stimulation periods are indicated by the black bars, and background firing by grey bars.
Increasing the test stimulus frequency during constant background activity causes a stronger depression from the baseline level, accompanied by stronger release probability facilitation and RRVP depletion (Fig. 9A). The relative strength of depression, compared to the baseline during background activity, is lower than during stimulation of a rested synapse, as also recently reported by Hermann et al. (2007). Regardless as to whether the synapse is initially silent or in an already depressed state due to background activity, the EPSC amplitude converges to the same steady-state value. Only the time course of depression differs as the initial conditions are different. Hence the presence of background activity does not affect the stationary properties of depression. The same behaviour is also observed in the depletion model (not illustrated).
We also tested how changes of the background firing rate affect transmission of a 100 Hz stimulus (Fig. 9B). A comparison of the EPSC amplitudes during stimulation shows that the relative amount of depression decreases with increasing background firing frequency, but in absolute terms, the strength of depression is always the same. At higher background rates, an initial EPSC facilitation appears after stimulus onset (Fig. 9B, bottom left), which is partially masked by AMPAR desensitization. This effect depends on facilitation and is stronger when the initial release probability is reduced or the strength of facilitation increased. However, it is not observed in the depletion model, where strong RRVP depletion prevents facilitation (here facilitation is only observed under rested conditions).
The simulations show that recovery back to the baseline accelerates for increased background firing (Fig. 9B, bottom right), as reported by Hermann et al. (2007). A comparison of the recovery curves for different frequencies shows that this is only partially a relative effect resulting from the different baseline EPSC amplitudes, since the normalized and scaled recovery curves do not fully overlap (Fig. 9B, inset bottom right). Instead, this effect is caused by different relative activation of release probability inhibition by the stimulus. During lower background firing rates, there is little release probability inhibition so that the stimulus causes a relatively strong increase in this inhibition which prolongs recovery. However, at high background rates release probability inhibition is already high and is not much further activated by the stimulus, hence recovery is dominated by faster processes. The same effect is observed when the stimulus duration is increased (not illustrated). As a lower EPSC amplitude can reduce the probability of spiking of MNTB neurons, it is possible that this effect contributes to the observed stimulus-dependent suppression of spontaneous firing observed in MNTB neurons after sound stimulation (Kadner et al. 2006).
As the strength of this effect increases with stimulus frequency and duration, a regulation of spontaneous activity levels to different naturally occurring activity levels can potentially increase the fidelity of synaptic transmission at the calyx of Held. This would predict that auditory nerve fibres with lower excitation threshold have higher rates of spontaneous activity, which has been reported for different mammalian species (Tsuji & Liberman, 1997; Taberner & Liberman, 2005).
Discussion
This study presents an analysis of a phenomenological model of STP at the calyx of Held, which combines multiple processes acting at different sites and over a wide range of temporal scales. In addition to vesicle depletion and facilitation, the main components of typical models of STP, two further types of mechanism were required to reproduce the experimental data: (1) rapid, activity-dependent vesicle retrieval, and (2) multiple processes mediating slow, activity-dependent release probability inhibition. Both have been characterized at the calyx of Held, as well as in other synapses, but few studies have so far addressed the effects of an interaction of these multiple mechanisms, each acting on a very different temporal scale.
Our results reconcile several previous findings at the calyx of Held. Firstly, the model shows that a gradual reduction of the EPSC amplitude during sustained stimulation is caused by slow inhibition of the release probability, which is accompanied by a slow, partial recovery of the RRVP. An analysis of recordings using long stimulation protocols, as well as previous evidence (Billups et al. 2005), are consistent with this prediction. This result may be relevant for synaptic transmission under in vivo conditions, where responses to sound stimuli are embedded in constant random background activity (Kopp-Scheinpflug et al. 2003) which causes chronic synaptic depression (Hermann et al. 2007). Our results suggest that in this case depression is not primarily mediated by vesicle depletion, but that instead slow inhibition of the release probability gradually assumes control to reduce depletion. This suggests that the baseline conditions during transmission of stimulus-induced activity under natural conditions may differ significantly from those in a rested synapse.
Secondly, the model naturally explains stimulus-dependent effects on the recovery time course from synaptic depression. Increasing stimulus frequency and/or duration leads to a slower overall recovery, but also introduces a rapid initial component. Qualitatively similar behaviours have been reported in experimental studies (Forsythe et al. 1998; Xu & Wu, 2005), but further experiments are required to test this prediction more specifically. Our simulations demonstrate that these differences can result from a combined relaxation of multiple, differentially activated, processes with different relaxation rates.
Thirdly, the model reproduces the recently reported accelerated recovery from depression induced by stimuli embedded in background activity (Hermann et al. 2007). We further find that the recovery kinetics are strongly dependent on the stimulus intensity/duration, which as a result may affect subsequent transmission of spontaneous activity in a stimulus-dependent manner. This effect has been reported for MNTB neurons, and has been proposed to allow for encoding of temporal stimulus properties (Kadner et al. 2006). Finally, the simulations illustrate that increased levels of background activity accelerate recovery from depression after stimulation, suggesting a possible role for spontaneous firing in regulating the temporal fidelity of the synapse.
Release probability modulation
This study suggests that, in addition to the dynamics of vesicle depletion and retrieval, different forms of activity-dependent release probability modulation are implicated in STP at the calyx of Held. The model includes a single rapid, activity-dependent mode of calcium current facilitation, which has been characterized experimentally and implicated in EPSC amplitude facilitation when AMPAR desensitization is blocked (Borst & Sakmann, 1998; Cuttle et al. 1998; Tsujimoto et al. 2002; Wong et al. 2003). Experimental evidence, however, also shows that other factors, such as accumulation of residual calcium (Felmy et al. 2003a) which has been implicated in post-tetanic potentiation (Habets & Borst, 2005; Korogod et al. 2005), or calcium buffer saturation (Müller et al. 2007), can contribute to facilitation. These were not explicitly included in the model, which therefore implements only a simplified description of facilitation. Preliminary simulations including residual calcium accumulation suggest that it causes an opposing effect on calcium channel inhibition during continuous stimulation, but induces facilitation after stimulus offset and recovery from calcium channel inhibition due to its slow decay rate.
Slow release probability inhibition on multiple time scales is a central mechanism in this model that changes its behaviour in a non-trivial way. Inactivation and G-protein-mediated inhibition are well documented features of P-type calcium channels, which are responsible for transmitter release at the calyx of Held (Takahashi et al. 1996, 1998; Forsythe et al. 1998; Billups et al. 2005; Takago et al. 2005). A substantial reduction of the presynaptic calcium current, as predicted by the model, has been observed only after prolonged, intensive stimulation (Forsythe et al. 1998). Therefore, a substantial contribution to synaptic depression has, at least for short stimuli, so far been ruled out. In addition, recordings of calcium currents in mice have shown strong facilitation at high stimulation frequencies (Ishikawa et al. 2005), which are more consistent with a model without significant calcium channel inhibition (cf. Fig. 3B, ‘depletion model’). On the other hand, while blocking presynaptic mGluRs had no effect on the EPSC amplitude recorded during brief high-frequency stimulation, it accelerated recovery from depression and recovered the RRVP, suggesting a reduction of the release probability (Billups et al. 2005). In addition, a recent study has reported a small, but significant decrease of the presynaptic calcium current even during moderate stimulation in young rats, which was linked to calcium channel inactivation and proposed as a main cause for synaptic depression at low stimulus frequencies (Xu & Wu, 2005). Consistent with this hypothesis, deletion of the calmodulin-binding domain in Cav2.1 channels has been shown to cause a reduction of synaptic depression (Mochida et al. 2008). However, it was also recently reported that calmodulin-dependent inactivation is less pronounced in more mature animals (Nakamura et al. 2008). It is not entirely clear yet whether this lack of consistency between different studies is solely caused by species and age differences. It may also be possible that some studies have underestimated calcium current inhibition in presynaptic recordings, especially since even moderate concentrations of fast, soluble calcium buffers (e.g. BAPTA) in the pipette have been shown to strongly suppress calcium channel inactivation (Lee et al. 2000; Kreiner & Lee, 2006).
Here we found that a slow release probability inhibition is compensated by an increase of the RRVP. It is caused by activity-dependent vesicle recruitment, and is incomplete, if the RRVP has a limited maximal size (for an unlimited RRVP, the compensation is complete; Billups et al. 2005; Hennig et al. 2007). We show that this results in a slow decay of the EPSC amplitude during prolonged stimulation, which is also observed in long recordings (Figs 4 and 6; see also Hermann et al. 2007). We also show that the actual effect of removing a component of release probability inhibition on EPSC amplitude is very small, in particular for short stimuli (Fig. 6C), and hence potentially experimentally difficult to assess.
Stimulus-dependent recovery from depression
Our model shows strongly stimulus-dependent recovery dynamics from depression, possibly a rather common property of synapses that has been reported in a number of studies. An acceleration with increasing frequency was found for very short stimuli at the calyx of Held (Wang & Kaczmarek, 1998; Sakaba & Neher, 2001a) and in the somatosensory cortex (Fuhrmann et al. 2004). These results are most likely indicators of activity-dependent vesicle retrieval, and could be reproduced with the current model, although the effect observed with the parameters estimated for the recordings used in the study was smaller than reported by Wang & Kaczmarek (1998; data not shown). To reproduce it, the rate of activity-dependent vesicle recruitment had to be reduced such that it only contributed at high stimulus frequencies.
A slowing of recovery has been reported after increasing stimulus frequency (Xu & Wu, 2005; note that this study simultaneously varied stimulus duration and frequency) and duration (Forsythe et al. 1998) at the calyx of Held, in Purkinje cells (Silver et al. 1998) and motor neurons (Wu & Betz, 1998). The model behaviour is consistent with these findings, and suggests that recovery curves will generally assume the shape of a truncated power law (eqn (13)), with an initial fast component that terminates with a slow exponential decay.
Generally, a truncated power law for relaxation dynamics is obtained if all processes are summed in a common variable (the postsynaptic current), and their relaxation time constants differ. Then, the recovery dynamics are given by a sum of exponential decay functions: 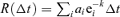 , where ai denotes the activation level of each process i, and ki its relaxation rate. If the sum is expressed in integral form, and the activation levels ai are chosen to follow a power law of the relaxation time constant (or any monotonously decreasing polynomial function), the following expression describes the recovery dynamics:
 |
(14) |
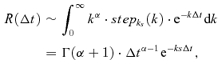
where stepks(k) = {1 if k ≥ ks; 0 otherwise} is the step function, which introduces a lower limit on the decay constant (the upper limit is ignored as it only makes a minor contribution; more complicated activation level distributions described by a polynomial will yield sums of this function). This integral is the Laplace transform of  , which yields the expression introduced in eqn (13). Further experiments are required to test this prediction, where recovery curves following different stimulus protocols have to be compared in the presence of variable calcium buffer concentrations or calmodulin blockers that selectively control the strength of the slow STP components.
Implications for signal transmission
The calyx of Held is part of the circuitry that computes interaural level and timing differences to estimate the location of sound sources, which requires precise and reliable transmission of sound-evoked activity (Trussell, 1999). It is thought to function as an inverting relay, converting excitatory globular bushy cell inputs into similar spike trains in the inhibitory MNTB neurons, which are sent to different brainstem nuclei to enable the comparison of ipsi- and contralateral sound-evoked activity (Oertel, 1999). Accordingly, this synapse has a very high safety factor, such that virtually every input spike will produce a postsynaptic EPSC, except during very intense, prolonged stimulation (cf. Fig. 4). Reliability and precision of transmission is further maintained by preventing temporal summation of the calyx input into MNTB neurons through expression of low- and high-voltage-activated potassium channels (Brew & Forsythe, 1995). This lack of temporal summation means that, due to the frequency-dependent character of synaptic depression, EPSP amplitudes are strongly related to the instantaneous input spike frequency. In addition, synaptic depression on multiple time scales extends this dependency to the wider input spike train history. This form of amplitude coding of input spike train features can potentially lead to, and allow for, further regulation of transmission of sound-evoked activity. It has indeed been demonstrated in vivo that the MNTB does not act as a simple relay, but strongly filters incoming spike trains, not transmitting every incoming spike, and improves frequency tuning and phase-locking in its output (Kopp-Scheinpflug et al. 2003). Furthermore, the calyx and MNTB neurons are known to receive further inhibitory and neuromodulatory inputs (Oertel, 1999; Schneggenburger & Forsythe, 2006), which can synergistically interact with the EPSC amplitude and membrane properties to shape the MNTB output. How precisely these factors interact is so far unclear and an interesting question for future modelling studies.
A further consequence of the multiple time scale mechanisms is that the EPSC amplitude remains sensitive to the preceding interspike interval (ISI) over a very wide range of ISIs or, equivalently, stimulus frequencies. When stimulated by Poisson trains of spikes the EPSCs contain information about the preceding ISIs, as measured by the Shannon mutual information between EPSC amplitude and ISI (Z. Yang, M. H. Hennig, M. Postlethwaite, I. D. Forsythe & B. P. Graham; unpublished data). High information rates are maintained for mean frequencies ranging from less than 1 Hz to several hundred hertz. The different mechanisms contribute most to information transfer over a frequency range determined by their major time constant.
Our results also suggest that the character of synaptic transmission at the calyx of Held under in vivo conditions differs profoundly from that encountered in rested slice preparations. Tonic background activity induces constant depression, which is mediated not only by RRVP depletion, but involves multiple, interacting processes. This may have several implications. Firstly, recovery to baseline during background activity is fast, and is accelerated for high-frequency or long stimuli during high spontaneous firing rates. This provides an advantage for reliable transmission of bursts evoked by tone stimuli in rapid succession. Secondly, slow inhibition of presynaptic calcium currents and the concomitant recovery of the RRVP during sustained activity may have metabolic advantages, as it relieves the load on calcium pumps and vesicle cycling processes. Here it is also interesting that these processes not only span multiple time scales, but also probe different locations: calcium channel inactivation senses presynaptic incoming activity, and autoreceptors provide a measure of the synaptic output. Long-term regulation of such processes, as for example documented in the calyx for mGluRs during development (Renden et al. 2005), may therefore also be linked to homeostatic regulation and maintenance of stable operation regimes.
Finally, the truncated power law we found for the relaxation dynamics of the synapse may have more general implications in the context of neural adaptation, and processing of sound stimuli. As recently discussed by Drew & Abbott (2006), this type of adaptation allows a system to carry a long memory of the past activity and to adapt to fluctuations on multiple time scales typical for natural stimuli. This result deserves further investigation, and raises the question of how far neural processing under natural conditions can be considered to take place under stationary conditions, even at the level of single synapses.
Acknowledgments
This work was funded by a BBSRC joint project grant to B.P.G. and I.D.F., MRC grants to I.D.F., and a MRC fellowship to M.H.H. M.H.H. thanks J. Cortes for stimulating discussions.
References
- Abbott LF, Varela JA, Sen K, Nelson SB. Synaptic depression and cortical gain control. Science. 1997;275:220–224. doi: 10.1126/science.275.5297.221. [DOI] [PubMed] [Google Scholar]
- Betz WJ. Depression of transmitter release at the neuromuscular junction of the frog. J Physiol. 1970;206:629–644. doi: 10.1113/jphysiol.1970.sp009034. [DOI] [PMC free article] [PubMed] [Google Scholar]
- Billups B, Graham B, Wong A, Forsythe I. Unmasking Group III metabotropic glutamate autoreceptor function at excitatory synapses. J Physiol. 2005;565:885–896. doi: 10.1113/jphysiol.2005.086736. [DOI] [PMC free article] [PubMed] [Google Scholar]
- Billups B, Wong AY, Forsythe ID. Detecting synaptic connections in the medial nucleus of the trapezoid body using calcium imaging. Pflugers Arch. 2002;444:663–669. doi: 10.1007/s00424-002-0861-6. [DOI] [PubMed] [Google Scholar]
- Borst JG, Helmchen F, Sakmann B. Pre- and postsynaptic whole-cell recordings in the medial nucleus of the trapezoid body of the rat. J Physiol. 1995;489:825–840. doi: 10.1113/jphysiol.1995.sp021095. [DOI] [PMC free article] [PubMed] [Google Scholar]
- Borst JG, Sakmann B. Facilitation of presynaptic calcium currents in the rat brainstem. J Physiol. 1998;513:149–155. doi: 10.1111/j.1469-7793.1998.149by.x. [DOI] [PMC free article] [PubMed] [Google Scholar]
- Borst JG, Sakmann B. Effect of changes in action potential shape on calcium currents and transmitter release in a calyx-type synapse of the rat auditory brainstem. Philos Trans R Soc Lond B Biol Sci. 1999;354:347–355. doi: 10.1098/rstb.1999.0386. [DOI] [PMC free article] [PubMed] [Google Scholar]
- Brew H, Forsythe I. Two voltage-dependent K+ conductances with complementary functions in postsynaptic integration at a central auditory synapse. J Neurosci. 1995;15:8011–8022. doi: 10.1523/JNEUROSCI.15-12-08011.1995. [DOI] [PMC free article] [PubMed] [Google Scholar]
- Cuttle M, Rusznák Z, Wong A, Owens S, Forsythe I. Modulation of a presynaptic hyperpolarization-activated cationic current (Ih) at an excitatory synaptic terminal in the rat auditory brainstem. J Physiol. 2001;534:733–744. doi: 10.1111/j.1469-7793.2001.00733.x. [DOI] [PMC free article] [PubMed] [Google Scholar]
- Cuttle M, Tsujimoto T, Forsythe I, Takahashi T. Facilitation of the presynaptic calcium current at an auditory synapse in rat brainstem. J Physiol. 1998;512:723–729. doi: 10.1111/j.1469-7793.1998.723bd.x. [DOI] [PMC free article] [PubMed] [Google Scholar]
- Dayan P, Abbott LF. Theoretical Neuroscience: Computational and Mathematical Modeling of Neural Systems. Cambridge, MA, USA: MIT Press; 2001. [Google Scholar]
- Dittman JS, Regehr WG. Calcium dependence and recovery kinetics of presynaptic depression at the climbing fiber to Purkinje cell synapse. J Neurosci. 1998;18:6147–6162. doi: 10.1523/JNEUROSCI.18-16-06147.1998. [DOI] [PMC free article] [PubMed] [Google Scholar]
- Drew PJ, Abbott LF. Models and properties of power-law adaptation in neural systems. J Neurophysiol. 2006;96:826–833. doi: 10.1152/jn.00134.2006. [DOI] [PubMed] [Google Scholar]
- Felmy F, Neher E, Schneggenburger R. Probing the intracellular calcium sensitivity of transmitter release during synaptic facilitation. Neuron. 2003a;37:801–811. doi: 10.1016/s0896-6273(03)00085-0. [DOI] [PubMed] [Google Scholar]
- Felmy F, Neher E, Schneggenburger R. The timing of phasic transmitter release is Ca2+-dependent and lacks a direct influence of presynaptic membrane potential. Proc Natl Acad Sci U S A. 2003b;100:15200–15205. doi: 10.1073/pnas.2433276100. [DOI] [PMC free article] [PubMed] [Google Scholar]
- Forsythe ID. Direct patch recording from identified presynaptic terminals mediating glutamatergic EPSCs in the rat CNS, in vitro. J Physiol. 1994;479:381–387. doi: 10.1113/jphysiol.1994.sp020303. [DOI] [PMC free article] [PubMed] [Google Scholar]
- Forsythe I, Tsujimoto T, Barnes-Davies M, Cuttle M, Takahashi T. Inactivation of presynaptic calcium current contributes to synaptic depression at a fast central synapse. Neuron. 1998;20:797–807. doi: 10.1016/s0896-6273(00)81017-x. [DOI] [PubMed] [Google Scholar]
- Fuhrmann G, Cowan A, Segev I, Tsodyks M, Stricker C. Multiple mechanisms govern the dynamics of depression at neocortical synapses of young rats. J Physiol. 2004;557:415–438. doi: 10.1113/jphysiol.2003.058107. [DOI] [PMC free article] [PubMed] [Google Scholar]
- Graham B, Wong A, Forsythe I. A multi-component model of depression at the calyx of Held. Neurocomputing. 2004;58–60:449–454. [Google Scholar]
- Habets RL, Borst JG. Post-tetanic potentiation in the rat calyx of Held synapse. J Physiol. 2005;564:173–187. doi: 10.1113/jphysiol.2004.079160. [DOI] [PMC free article] [PubMed] [Google Scholar]
- Hennig MH, Postlethwaite M, Forsythe ID, Graham BP. A biophysical model of short-term plasticity at the calyx of Held. Neurocomputing. 2007;70:1626–1629. [Google Scholar]
- Hering S, Berjukow S, Sokolov S, Marksteiner R, Weiss RG, Kraus R, Timin EN. Molecular determinants of inactivation in voltage-gated Ca2+ channels. J Physiol. 2000;528:237–249. doi: 10.1111/j.1469-7793.2000.t01-1-00237.x. [DOI] [PMC free article] [PubMed] [Google Scholar]
- Hermann J, Pecka M, von Gersdorff H, Grothe B, Klug A. Synaptic transmission at the calyx of Held under in vivo-like activity levels. J Neurophysiol. 2007;98:807–820. doi: 10.1152/jn.00355.2007. [DOI] [PubMed] [Google Scholar]
- Hosoi N, Sakaba T, Neher E. Quantitative analysis of calcium-dependent vesicle recruitment and its functional role at the calyx of Held synapse. J Neurosci. 2007;27:14286–14298. doi: 10.1523/JNEUROSCI.4122-07.2007. [DOI] [PMC free article] [PubMed] [Google Scholar]
- Ishikawa T, Kaneko M, Shin HS, Takahashi T. Presynaptic N-type and, P/Q-type Ca2+ channels mediating synaptic transmission at the calyx of Held of mice. J Physiol. 2005;568:199–209. doi: 10.1113/jphysiol.2005.089912. [DOI] [PMC free article] [PubMed] [Google Scholar]
- Kadner A, Kulesza RJ, Berrebi AS. Neurons in the medial nucleus of the trapezoid body and superior paraolivary nucleus of the rat may play a role in sound duration coding. J Neurophysiol. 2006;95:1499–1508. doi: 10.1152/jn.00902.2005. [DOI] [PubMed] [Google Scholar]
- Kopp-Scheinpflug C, Lippe WR, Dörrscheidt GJ, Rübsamen R. The medial nucleus of the trapezoid body in the gerbil is more than a relay: comparison of pre- and postsynaptic activity. J Assoc Res Otolaryngol. 2003;4:1–23. doi: 10.1007/s10162-002-2010-5. [DOI] [PMC free article] [PubMed] [Google Scholar]
- Korogod N, Lou X, Schneggenburger R. Presynaptic Ca2+ requirements and developmental regulation of posttetanic potentiation at the calyx of Held. J Neurosci. 2005;25:5127–5137. doi: 10.1523/JNEUROSCI.1295-05.2005. [DOI] [PMC free article] [PubMed] [Google Scholar]
- Kreiner L, Lee A. Endogenous and exogenous Ca2+ buffers differentially modulate Ca2+-dependent inactivation of Cav2.1 Ca2+ channels. J Biol Chem. 2006;281:4691–4698. doi: 10.1074/jbc.M511971200. [DOI] [PubMed] [Google Scholar]
- Kushmerick C, Renden R, von Gersdorff H. Physiological temperatures reduce the rate of vesicle pool depletion and short-term depression via an acceleration of vesicle recruitment. J Neurosci. 2006;26:1366–1377. doi: 10.1523/JNEUROSCI.3889-05.2006. [DOI] [PMC free article] [PubMed] [Google Scholar]
- Lee A, Scheuer T, Catterall WA. Ca2+/calmodulin-dependent facilitation and inactivation of, P/Q-type Ca2+ channels. J Neurosci. 2000;20:6830–6838. doi: 10.1523/JNEUROSCI.20-18-06830.2000. [DOI] [PMC free article] [PubMed] [Google Scholar]
- Liley AW, North KA. An electrical investigation of effects of repetitive stimulation on mammalian neuromuscular junction. J Neurophysiol. 1953;16:509–527. doi: 10.1152/jn.1953.16.5.509. [DOI] [PubMed] [Google Scholar]
- Lou X, Scheuss V, Schneggenburger R. Allosteric modulation of the presynaptic Ca2+ sensor for vesicle fusion. Nature. 2005;435:497–501. doi: 10.1038/nature03568. [DOI] [PubMed] [Google Scholar]
- Markram H, Wang Y, Tsodyks M. Differential signaling via the same axon of neocortical pyramidal neurons. Proc Natl Acad Sci U S A. 1998;95:5323–5328. doi: 10.1073/pnas.95.9.5323. [DOI] [PMC free article] [PubMed] [Google Scholar]
- Mochida S, Few AP, Scheuer T, Catterall WA. Regulation of presynaptic Cav2.1 channels by Ca2+ sensor proteins mediates short-term synaptic plasticity. Neuron. 2008;57:210–216. doi: 10.1016/j.neuron.2007.11.036. [DOI] [PubMed] [Google Scholar]
- Müller M, Felmy F, Schwaller B, Schneggenburger R. Parvalbumin is a mobile presynaptic Ca2+ buffer in the calyx of Held that accelerates the decay of Ca2+ and short-term facilitation. J Neurosci. 2007;27:2261–2271. doi: 10.1523/JNEUROSCI.5582-06.2007. [DOI] [PMC free article] [PubMed] [Google Scholar]
- Murthy VN, Sejnowski TJ, Stevens CF. Heterogeneous release properties of visualized individual hippocampal synapses. Neuron. 1997;18:599–612. doi: 10.1016/s0896-6273(00)80301-3. [DOI] [PubMed] [Google Scholar]
- Nakamura T, Yamashita T, Saitoh N, Takahashi T. Developmental changes in calcium/calmodulin-dependent inactivation of calcium currents at the rat calyx of Held. J Physiol. 2008;586:2253–2261. doi: 10.1113/jphysiol.2007.142521. [DOI] [PMC free article] [PubMed] [Google Scholar]
- Oertel D. The role of timing in the brain stem auditory nuclei of vertebrates. Annu Rev Physiol. 1999;61:497–519. doi: 10.1146/annurev.physiol.61.1.497. [DOI] [PubMed] [Google Scholar]
- Patil PG, Brody DL, Yue DT. Preferential closed-state inactivation of neuronal calcium channels. Neuron. 1998;20:1027–1038. doi: 10.1016/s0896-6273(00)80483-3. [DOI] [PubMed] [Google Scholar]
- Postlethwaite M, Hennig MH, Steinert JR, Graham BP, Forsythe ID. Acceleration of AMPA receptor kinetics underlies temperature-dependent changes in synaptic strength at the rat calyx of Held. J Physiol. 2007;579:69–84. doi: 10.1113/jphysiol.2006.123612. [DOI] [PMC free article] [PubMed] [Google Scholar]
- Renden R, Taschenberger H, Puente N, Rusakov DA, Duvoisin R, Wang LY, Lehre KP, von Gersdorff H. Glutamate transporter studies reveal the pruning of metabotropic glutamate receptors and absence of AMPA receptor desensitization at mature calyx of Held synapses. J Neurosci. 2005;25:8482–8497. doi: 10.1523/JNEUROSCI.1848-05.2005. [DOI] [PMC free article] [PubMed] [Google Scholar]
- Renden R, von Gersdorff H. Synaptic vesicle endocytosis at a CNS nerve terminal: faster kinetics at physiological temperatures and increased endocytotic capacity during maturation. J Neurophysiol. 2007;98:3349–3359. doi: 10.1152/jn.00898.2007. [DOI] [PubMed] [Google Scholar]
- Sakaba T, Neher E. Calmodulin mediates rapid recruitment of fast-releasing synaptic vesicles at a calyx-type synapse. Neuron. 2001a;32:1119–1131. doi: 10.1016/s0896-6273(01)00543-8. [DOI] [PubMed] [Google Scholar]
- Sakaba T, Neher E. Quantitative relationship between transmitter release and calcium current at the calyx of Held synapse. J Neurosci. 2001b;21:462–476. doi: 10.1523/JNEUROSCI.21-02-00462.2001. [DOI] [PMC free article] [PubMed] [Google Scholar]
- Sätzler K, Söhl L, Bollmann J, Borst J, Frotscher M, Sakmann B, Lübke J. Three-dimensional reconstruction of a calyx of Held and its postsynaptic principal neuron in the medial nucleus of the trapezoid body. J Neurosci. 2002;22:10567–10579. doi: 10.1523/JNEUROSCI.22-24-10567.2002. [DOI] [PMC free article] [PubMed] [Google Scholar]
- Schneggenburger R, Forsythe ID. The calyx of Held. Cell Tissue Res. 2006;326:311–337. doi: 10.1007/s00441-006-0272-7. [DOI] [PubMed] [Google Scholar]
- Schneggenburger R, Meyer AC, Neher E. Released fraction and total size of a pool of immediately available transmitter quanta at a calyx synapse. Neuron. 1999;23:399–409. doi: 10.1016/s0896-6273(00)80789-8. [DOI] [PubMed] [Google Scholar]
- Silver RA, Momiyama A, Cull-Candy SG. Locus of frequency-dependent depression identified with multiple-probability fluctuation analysis at rat climbing fibre–Purkinje cell synapses. J Physiol. 1998;510:881–902. doi: 10.1111/j.1469-7793.1998.881bj.x. [DOI] [PMC free article] [PubMed] [Google Scholar]
- Taberner AM, Liberman MC. Response properties of single auditory nerve fibers in the mouse. J Neurophysiol. 2005;93:557–569. doi: 10.1152/jn.00574.2004. [DOI] [PubMed] [Google Scholar]
- Takago H, Nakamura Y, Takahashi T. G protein-dependent presynaptic inhibition mediated by AMPA receptors at the calyx of Held. Proc Natl Acad Sci U S A. 2005;102:7368–7373. doi: 10.1073/pnas.0408514102. [DOI] [PMC free article] [PubMed] [Google Scholar]
- Takahashi T, Forsythe I, Tsujimoto T, Barnes-Davies M, Onodera K. Presynaptic calcium current modulation by a metabotropic glutamate receptor. Science. 1996;274:594–597. doi: 10.1126/science.274.5287.594. [DOI] [PubMed] [Google Scholar]
- Takahashi T, Kajikawa Y, Tsujimoto T. G-protein-coupled modulation of presynaptic calcium currents and transmitter release by a GABAB receptor. J Neurosci. 1998;18:3138–3146. doi: 10.1523/JNEUROSCI.18-09-03138.1998. [DOI] [PMC free article] [PubMed] [Google Scholar]
- Taschenberger H, von Gersdorff H. Fine-tuning an auditory synapse for speed and fidelity: developmental changes in presynaptic waveform, EPSC kinetics, and synaptic plasticity. J Neurosci. 2000;20:9162–9173. doi: 10.1523/JNEUROSCI.20-24-09162.2000. [DOI] [PMC free article] [PubMed] [Google Scholar]
- Trommershäuser J, Schneggenburger R, Zippelius A, Neher E. Heterogeneous presynaptic release probabilities: functional relevance for short-term plasticity. Biophys J. 2003;84:1563–1579. doi: 10.1016/S0006-3495(03)74967-4. [DOI] [PMC free article] [PubMed] [Google Scholar]
- Trussell LO. Synaptic mechanisms for coding timing in auditory neurons. Annu Rev Physiol. 1999;61:477–496. doi: 10.1146/annurev.physiol.61.1.477. [DOI] [PubMed] [Google Scholar]
- Tsodyks MV, Markram H. The neural code between neocortical pyramidal neurons depends on neurotransmitter release probability. Proc Natl Acad Sci U S A. 1997;94:719–723. doi: 10.1073/pnas.94.2.719. [DOI] [PMC free article] [PubMed] [Google Scholar]
- Tsuji J, Liberman MC. Intracellular labeling of auditory nerve fibers in guinea pig: central and peripheral projections. J Comp Neurol. 1997;381:188–202. [PubMed] [Google Scholar]
- Tsujimoto T, Jeromin A, Saitoh N, Roder JC, Takahashi T. Neuronal calcium sensor 1 and activity-dependent facilitation of, P/Q-type calcium currents at presynaptic nerve terminals. Science. 2002;295:2276–2279. doi: 10.1126/science.1068278. [DOI] [PubMed] [Google Scholar]
- Varela JA, Sen K, Gibson J, Fost J, Abbott LF, Nelson SB. A quantitative description of short-term plasticity at excitatory synapses in layer 2/3 of rat primary visual cortex. J Neurosci. 1997;17:7926–7940. doi: 10.1523/JNEUROSCI.17-20-07926.1997. [DOI] [PMC free article] [PubMed] [Google Scholar]
- Wang L, Kaczmarek L. High-frequency firing helps replenish the readily releasable pool of synaptic vesicles. Nature. 1998;394:384–388. doi: 10.1038/28645. [DOI] [PubMed] [Google Scholar]
- Weis S, Schneggenburger R, Neher E. Properties of a model of Ca-dependent vesicle pool dynamics and short term synaptic depression. Biophys J. 1999;77:2418–2429. doi: 10.1016/S0006-3495(99)77079-7. [DOI] [PMC free article] [PubMed] [Google Scholar]
- Wong A, Graham B, Billups B, Forsythe I. Distinguishing between presynaptic and postsynaptic mechanisms of short-term depression during action potential trains. J Neurosci. 2003;23:4868–4877. doi: 10.1523/JNEUROSCI.23-12-04868.2003. [DOI] [PMC free article] [PubMed] [Google Scholar]
- Wu LG, Betz WJ. Kinetics of synaptic depression and vesicle recycling after tetanic stimulation of frog motor nerve terminals. Biophys J. 1998;74:3003–3009. doi: 10.1016/S0006-3495(98)78007-5. [DOI] [PMC free article] [PubMed] [Google Scholar]
- Wu W, Xu J, Wu XS, Wu LG. Activity-dependent acceleration of endocytosis at a central synapse. J Neurosci. 2005;25:11676–11683. doi: 10.1523/JNEUROSCI.2972-05.2005. [DOI] [PMC free article] [PubMed] [Google Scholar]
- Xu J, Wu LG. The decrease in the presynaptic calcium current is a major cause of short-term depression at a calyx-type synapse. Neuron. 2005;46:633–645. doi: 10.1016/j.neuron.2005.03.024. [DOI] [PubMed] [Google Scholar]
- Yamashita T, Hige T, Takahashi T. Vesicle endocytosis requires dynamin-dependent GTP hydrolysis at a fast CNS synapse. Science. 2005;307:124–127. doi: 10.1126/science.1103631. [DOI] [PubMed] [Google Scholar]
- Zucker RS, Regehr WG. Short-term synaptic plasticity. Annu Rev Physiol. 2002;64:355–405. doi: 10.1146/annurev.physiol.64.092501.114547. [DOI] [PubMed] [Google Scholar]