

Abstract
We studied inactivation of Ca2+-induced Ca2+ release (CICR) via ryanodine receptors (RyRs) in bullfrog sympathetic neurons. The rate of rise in [Ca2+]i due to CICR evoked by a depolarizing pulse decreased markedly within 10–20 ms to a much slower rate despite persistent Ca2+ entry and little depletion of Ca2+ stores. The Ca2+ entry elicited by the subsequent pulse within 50 ms, during which the [Ca2+]i level remained unchanged, did not generate a distinct [Ca2+]i rise. This mode of [Ca2+]i rise was unaffected by a mitochondrial uncoupler, carbonyl cyanide p-trifluromethoxy-phenylhydrazone (FCCP, 1 μm). Paired pulses of varying interval and duration revealed that recovery from inactivation became distinct ≥ 50 ms after depolarization and depended on [Ca2+]i. The inactivation was prevented by BAPTA (≥ 100 μm) but not by EGTA (≤ 10 mm), whereas the activation was less affected by BAPTA. When CICR was partially activated, some of the non-activated RyRs were also inactivated directly. Thus, the inactivation in these neurons is induced by Ca2+ binding to the high-affinity regulatory sites residing very close to Ca2+ channels and/or RyRs, although the sites for activation are located much closer to those Ca2+ sources. The rate of [Ca2+]i decay after the pulse decreased with increasing pulse duration longer than 10 ms, and this was abolished by BAPTA. Thus, some mechanism counteracting Ca2+ clearance is induced after full inactivation and potentiated during the pulse. Possible models for RyR inactivation were proposed and the roles of inactivation in Ca2+ signalling were discussed.
CICR is caused by Ca2+-mediated activation of RyRs. In physiological situations, the initial trigger Ca2+ is provided by Ca2+ entry via voltage-gated or receptor-operated Ca2+ channels. Then, the released Ca2+ activates adjacent RyRs and probably reactivates the initially activated RyRs. This regenerative process is believed to be the basis for CICR in a cluster of RyRs. Thus, it is conceivable that, if there is no mechanism for limiting the regenerative process, CICR would continue until Ca2+ stores are depleted. Under physiological conditions, the process is usually terminated before depletion of Ca2+ stores by a negative feedback mechanism, called ‘inactivation’ (Fabiato, 1985). The mechanism operates locally within a cluster of RyRs and it would ensure the graded activation of CICR according to the number of open Ca2+ channels in cardiac muscles (Sham et al. 1998; Stern et al. 1999; Wang et al. 2001). In bullfrog sympathetic neurons, it has been known that CICR can contribute to a major component of a [Ca2+]i rise (Kuba, 1980; Friel & Tsien, 1992; Hua et al. 1993, 2000; Akita & Kuba, 2000) and its graded activation is observed under physiological conditions (Hua et al. 1993). The existence of inactivation, however, has not yet been confirmed.
In this paper, we demonstrate that CICR inactivation indeed takes place in bullfrog sympathetic neurons. The mechanism of inactivation was found to be Ca2+ dependent and to sense the Ca2+ near the orifices of open Ca2+ channels and/or RyRs. Evidence further implicates a rather intricate mechanism of inactivation; it acts on both the activated and non-activated RyRs, and induces another mechanism counteracting Ca2+ clearance.
Preliminary reports were already made at several meetings (Akita & Kuba, 2002, 2003).
Methods
Cell preparations
Neurons from lumbar paravertebral sympathetic ganglia of adult bullfrogs (Rana catesbeiana) were cultured as in previous studies (Hua et al. 1993; Akita & Kuba, 2000). Bullfrogs were killed by pithing both the spinal cord and brain after gentle wash, the procedure approved by Animals Ethics Committee of Nagoya University (Nagoya, Japan). After individual ganglia were isolated and desheathed, neurons were first dissociated enzymatically in 3 mg ml−1 type I collagenase (Sigma-Aldrich) for 90 min, and then with the addition of 0.5 mg ml−1 trypsin (Sigma-Aldrich) for 20 min at 30°C. After the enzymatic treatment, individual neurons were further isolated mechanically by gentle trituration through a polished Pasteur pipette. The neurons were plated on coverslip-bottom dishes coated with poly l-lysine (Sigma-Aldrich) and cultured in medium containing 70% L-15 (Gibco BRL), 7% fetal bovine serum (Sigma-Aldrich), 200 ng ml−1 nerve growth factor-7S (Wako Chemicals) and 50 μg ml−1 gentamicin (Gibco BRL) at room temperature (20–25°C) for 7–10 days before use in most cases. For neurons used for intracellular EGTA or BAPTA treatment, we cultured them at 8°C to prevent sprouting of long axons in an attempt to yield better space voltage clamp. The general properties of CICR were essentially unchanged by the temperature setting, but the ICa in neurons cultured at 8°C (3.3 ± 0.3 nA, elicited by a 100 ms depolarizing pulse to 0 mV; n = 17) was smaller than that in neurons cultured at room temperature (6.0 ± 0.5 nA; n = 16). Other minor differences are mentioned in Table 1. All the recordings were made from neurons possessing a large, spherical soma (40–60 μm in diameter) at room temperature.
Table 1.
Effects of BAPTA and EGTA on the F/F0 rise evoked by a 100 ms depolarizing pulse to 0 mV
| A. BAPTA (for parameters not shown in Fig. 9) | ||||
|---|---|---|---|---|
| 0.1 mm (n = 9) | 0.3 mm (n = 9) | 1 mm (n = 10) | 3 mm (n = 11) | |
| Peak amplitude (ΔF/F0) | 0.73 ± 0.04* | 0.64 ± 0.04* | 0.43 ± 0.06* | 0.11 ± 0.01* |
| Resting fluorescence (12-bit a.u)a | 852.8 ± 106.1 | 857.9 ± 61.6 | 539.0 ± 83.7 | 783.7 ± 53.6 |
| ICa peak (nA) | 3.3 ± 0.3 | 4.0 ± 0.5 | 4.9 ± 0.6* | 4.8 ± 0.3* |
|
ICa at end (% of peak) |
83.5 ± 2.1 |
83.3 ± 1.0 |
86.7 ± 3.3 |
87.6 ± 1.3 |
| B. EGTA | ||||
|---|---|---|---|---|
| Controlc (n = 17) | 1 mm (n = 12) | 3 mm (n = 15) | 10 mm (n = 10) | |
| Rate of rise in F/F0 (s−1) | 17.2 ± 0.9 | 17.7 ± 1.7 | 14.9 ± 0.7 | 12.7 ± 1.7* |
| Rise time (ms) | 9.2 ± 0.5 | 13.2 ± 1.0* | 12.2 ± 0.5* | 11.0 ± 0.7* |
| fCa 50–100ms/fCa initial (%)b | 4.5 ± 0.6 | 5.5 ± 0.6 | 2.5 ± 0.3* | 2.8 ± 0.7* |
| Peak amplitude (ΔF/F0) | 0.30 ± 0.02 | 0.50 ± 0.05* | 0.31 ± 0.02 | 0.24 ± 0.04 |
| Decay time constant (ms) | — | 32.8 ± 1.9 | 19.1 ± 1.3* | 22.6 ± 2.0* |
| ΔF/F0 after decay (% of the peak) | — | 21.3 ± 2.4 | 20.2 ± 1.5 | 6.2 ± 3.5* |
| Resting fluorescence (12-bit a.u)a | 829.2 ± 57.3 | 583.4 ± 77.2 | 505.2 ± 46.6* | 795.5 ± 102.5 |
| ICa peak (nA) | 3.3 ± 0.3 | 3.3 ± 0.3 | 3.6 ± 0.3 | 2.9 ± 0.4 |
| ICa at end (% of peak) | 81.7 ± 2.4 | 83.8 ± 1.8 | 86.2 ± 0.8 | 83.9 ± 1.4 |
Significantly different from control judged by multiple comparisons. (Decay time constant and ΔF/F0 after decay were compared with those in 1 mm EGTA.)
The intensity of resting fluorescence were measured in the cytoplasm within 2 μm of the plasma membrane with the Olympus system on a 12-bit scale (a.u., arbitrary units) under the same acquisition settings of the photomultiplier voltage (700 V), gain (1.0 ×) and offset (0%) values of the amplifier, laser power (0.5 mW), confocal aperture (100 μm) and the distance from the coverslip (15–17 μm). The background dark current signals of the photomultiplier were subtracted from raw values.
The slope of the F/F0 rise during the last 50 ms of a depolarizing pulse was converted to the estimated rate of CICR (fCa 50–100ms; see Fig. 9 legend) and compared with its initial value (fCa initial).
The data of controls were obtained from the neurons cultured at 8°C. In neurons cultured at room temperature, the rate of rise in F/F0 and the peak amplitude were 20.0 ± 1.0 s−1 and 0.38 ± 0.02, respectively. Other parameters were not affected by the culture condition.
Confocal [Ca2+]i imaging
A high-affinity Ca2+ indicator, Oregon green BAPTA-1 (OGB-1, K+ salt; Molecular Probes), at a low concentration of 10 μm was used for two reasons. First, since an increase in the normalized fluorescence (ΔF/F0) of OGB-1 evoked by depolarizing pulses was relatively small (∼0.5) in this neuron, it was expected that low-affinity Ca2+ indicators, e.g. OGB-2 or -5N, which have been suggested as being suitable for measuring Ca2+ release flux (Escobar et al. 1994; Song et al. 1998), produce much smaller rises in ΔF/F0. Indeed, OGB-2 or −5N at 10 μm showed < 0.2 of a ΔF/F0 rise in response to a depolarizing pulse. Second, although increasing their concentration (say, 1 mm; DiGregorio et al. 1999) might have solved the problem through increasing signal-to-noise ratios of ΔF/F0 signals, we found that such a high dose of ‘mobile fast’ Ca2+ indicators prevented CICR inactivation in this neuron through shrinking ‘Ca2+ microdomains’ in the vicinity of open Ca2+ channels and/or RyRs (see Results).
OGB-1 was loaded into neurons via whole-cell patch pipettes (Akita & Kuba, 2000). Changes in the OGB-1 fluorescence were recorded by a confocal laser-scanning microscope system (Bio-rad MRC-600 or Olympus FV300 equipped with a 488 nm argon laser, used at < 0.6 mW) mounted on a Nikon TMD300 (with a 40 × water NA 1.15 objective) or an Olympus IX71 (a 40 × water NA 0.9 objective) inverted microscope, respectively. Measurement was started usually 30–40 min after establishing the whole-cell mode, when the fluorescence intensity of cytoplasmic OGB-1 reached a plateau, unless otherwise stated. Linescans were performed at a rate of 2 or 4 ms per scan. The regions of interest were selected preferably in the cytoplasm around the nucleus or the axon hillock, which were recognized in the bright-field view as wide translucent portions near the plasma membrane (see Fig. 1 of Akita & Kuba, 2000), since there is a dense and thick distribution of RyRs in these regions (Akita & Kuba, 2000; McDonough et al. 2000; Cseresnyés & Schneider, 2004). The selected regions were usually magnified 400 ×, and the scanned images were digitized into 768 pixels in space (0.041 μm intervals) in the Bio-rad system or 512 pixels (0.069 μm intervals) in the Olympus system. Background signals were reduced to less than 5% of the cytoplasmic fluorescence of OGB-1. The fluorescence intensity in each pixel of images was normalized to that before stimulation (F/F0), which was further multiplied by an arbitrary constant to enhance image contrast for presentation purposes. The image reconstruction and modification were done in ImageJ software. The X–Y and Z resolutions of the confocal systems were 0.42 ± 0.0035 μm and 1.58 ± 0.019 μm, respectively, in Bio-rad (confocal aperture, 3.1 mm), and 0.33 ± 0.0042 μm and 1.39 ± 0.028 μm, respectively, in Olympus (aperture, 100 μm), which were assessed from the full-width at half-maximum of the images of 0.21 μm fluorescent beads.
Figure 1. Inward spread of a [Ca2+]i rise evoked by membrane depolarization.

A, fluorescence image of a neuronal soma in pseudocolour. The round, bright region is the nucleus. The white bar indicates the position of linescans (10 μm in length). B, linescan images of the inward spread of a [Ca2+]i rise evoked by two 50 ms depolarizing pulses from −80 to 0 mV, shown in raw fluorescence (upper) and in F/F0 (lower). The pulse interval was 50 ms. The arrow to the left of the raw image indicates the edge of the neuron determined by sigmoidal fitting (see Methods). The portion of the image below the arrow is clipped in the F/F0 image because of signal saturation. The images represent the average of 2 images obtained at 2 ms line−1. Membrane voltage (Vm) and current (ICa) are shown on the same time scale as the image. Traces at the bottom show the time courses of F/F0 changes in different cytosolic compartments (1 μm in width) at varying distances from the plasma membrane, indicated by the brackets to the left of the F/F0 image in corresponding colours. The F/F0 traces were smoothed by moving average over 10 ms.
Processing and analysis of F/F0 records
Except for the data obtained with EGTA, BAPTA, ryanodine or thapsigargin, the data showing a shift in resting fluorescence >10% during one series of measurements were discarded from the analysis.
Loss of fluorescence intensity during linescans due to photobleaching of the indicator was compensated for by dividing the time course of F/F0 by a single exponential function, (1 − B)exp(−t/τ) + B, whose time constant (τ) and base (B) were determined by fitting the time course without stimulus in the same cytoplasm. On average τ and B were 965 ms and 0.92, respectively, for 2 s linescans in the Bio-rad system, and 483 ms and 0.93 for 1 s in the Olympus system. The initial rate of rise in F/F0, which was the maximum, in the cytoplasm within 2 μm of the plasma membrane was measured as the rate of CICR. F/F0 records were usually averaged over two to three traces obtained at 2–3 min intervals, and smoothed by moving average over 10–12 ms. The maximal rate of rise was determined as the slope of linear regression over the initial 8–12 ms of the F/F0 rise. A F/F0 rise induced by a long depolarizing pulse usually consisted of the initial fast and the following slow rising phases. When the initial fast rising phase was obscured, the slope of the slow rising phase was first determined by linear regression over the F/F0 trace during the later part of a depolarizing pulse (e.g. the last 30 ms for a 50 ms pulse). Then, the end point of the fitting for the initial rate of rise was determined as the point where the initial F/F0 rise crosses for the first time the backward extrapolation of the regression line over the slow rising phase. If the two rising phases were not clearly separated even with this procedure, the rate of rise was defined as the slope over the entire period of depolarization. Furthermore, when the trace was so noisy or the slope was so nearly flat that the r2 value of the regression was < 0.1, the slope was reassessed under the condition of reduced noise by expanding the depth of the observed cytoplasm to 3 μm. When appropriate, F/F0 values were converted to [Ca2+]i values with 438 nm of the in vivo KD of OGB-1, 8.16 of the max-to-min fluorescence ratio and 96 nm or 34 nm of resting [Ca2+]i, as described in our previous study (Akita & Kuba, 2000).
The edge of the neuron in a linescan image was determined by two-step sigmoidal fitting as follows. The first fitting was made on the spatial profile in raw fluorescence around the transition site from the non-cellular to cellular regions delimited arbitrarily. Then, the second fitting was made over the region defined on its intracellular side at 2 μm away from the midpoint of the sigmoidal curve determined by the first fitting, and the final midpoint was adopted as the edge. The linear regression and other non-linear fittings were performed with the quasi-Newton routine in Microsoft Excel Solver.
Electrophysiology and drugs
The composition of the extracellular perfusion solution was (mm): 109 NMGCl, 10 TEACl (Sigma-Aldrich), 2 CaCl2 (Wako Chemicals), 5 Hepes and 10 d-glucose (Wako Chemicals) (pH 7.2). The solution in the patch pipettes consisted of (mm): 136 NMGCl, 10 Hepes, 4 MgATP, 0.3 Li3GTP (these were from Sigma-Aldrich) and 0.01 OGB-1 (pH 7.2). The liquid junction potential between these solutions was 0 mV. When an exogenous Ca2+ chelator of EGTA (Sigma-Aldrich) or BAPTA (Cs+ salt; Molecular Probes) was added to the pipette solution, an equal concentration of NMGCl was removed to adjust osmolarity. Neurons were continuously perfused at room temperature during experiments. The tip resistance of patch pipettes soaked in the bath was 6–8 MΩ. The series resistance during whole-cell patch clamping was usually within 10–15 MΩ. ICa were recorded via a single electrode amplifier (CEZ-3100, Nihon-Kohden) in the switching clamp mode at 25 kHz, filtered via 4-pole Bessel at 2–5 kHz for anti-aliasing and digitized at 10–20 kHz in the pCLAMP8 system (Axon Instruments). The linear membrane leak and capacitance were subtracted from the records by using the average of 20 consecutive currents evoked by 20 mV hyperpolarizing step pulses from the holding potential (−80 mV). Traces of ICa tail currents generated at the end of depolarization are partly truncated in most figures because of their much larger amplitude and the consequent uncertainty in the amplitude due to incomplete voltage clamp.
Caffeine (10 mm; Wako chemicals) was applied as a puff (about 4.5 μl) through a polyethylene tube (with 250 μm of the tip diameter) placed at 400–500 μm above the surface of a neuron. The application was controlled with an electromagnetic valve (EXAK-3, Takasago Electric, Nagoya, Japan). After evoking Ca2+ release in the focal neuron, one caffeine puff must have been immediately diluted by 100 times in the bath (500 μl) and washed out within 10 s at a bath flow rate of 30–50 μl s−1. Ryanodine and thapsigargin (both were from Wako Chemicals) were applied via bath perfusion. FCCP (Sigma-Aldrich) was first dissolved in 100% ethanol to yield a 10 000 × stock solution, then diluted in the extracellular perfusion solution just before the experiments and applied to neurons via bath perfusion.
Statistics
Data are presented as mean ± s.e.m. Before determining the mean value and its statistical differences, the data belonging to the range outside 2s.d.s of the initial sample data set were discarded. Error bars in graphs show the s.e.m.
Statistical comparisons were made on the concentration dependence of the effect of EGTA or BAPTA with Peritz's multiple comparison method of the closed testing procedure with the F statistic (Marcus et al. 1976; Hsu, 1996). In this method, standard one-way ANOVA was performed for all possible combinations of differently treated sample groups (one combination may include two or more groups). To ensure statistical coherence among the decisions for subset null hypotheses and to set the probability of making at least one incorrect assertion in one set of multiple comparisons, called the familywise error rate, to be < 0.05, the critical values of the F statistic for individual subset hypotheses were varied.
Results
Termination of CICR-induced F/F0 rise during continuous Ca2+ entry
Linescans over the cytoplasm near the plasma membrane in the radial direction of the neuronal soma (Fig. 1A) revealed the inward spread of a F/F0 signal, i.e. a [Ca2+]i rise, in response to a depolarizing pulse (Fig. 1B). The amplitude and rate of rise of the F/F0 signal in the cytoplasm within ∼2 μm of the plasma membrane were almost constant (black and red traces in Fig. 1B) and they diminished gradually in the deeper cytoplasm (grey traces in Fig. 1B), as observed in our previous studies (Hua et al. 1993, 2000; Akita & Kuba, 2000). The submembrane cytoplasm generating the constant, fastest rise in F/F0 roughly corresponded to the region highly stained with fluorescent ryanodine, and the deeper cytoplasm usually contained the region stained diminishingly up to 5–6 μm from the plasma membrane (Fig. 1 of Akita & Kuba, 2000). We have previously shown that the [Ca2+]i rise was abolished by removal of extracellular Ca2+ (Hua et al. 1993) and suppressed by application of ryanodine, dantrolene or thapsigargin (Hua et al. 1993, 2000; Akita & Kuba, 2000). In the present study, we further confirmed that very strong suppression of the rise by ryanodine or thapsigargin can be induced after repeated application of caffeine puffs (Fig. 3). Thus, CICR activated by Ca2+ entry through voltage-gated Ca2+ channels is predominantly involved in the depolarization-induced F/F0 rise.
Figure 3. Parallel suppression of [Ca2+]i rises elicited by depolarization and caffeine in the presence of 10 μm ryanodine or 1 μm thapsigargin.

A, suppression of [Ca2+]i rises by 10 μm ryanodine. B, suppression by 1 μm thapsigargin in another neuron. X–Y scans were performed over a 64 × 64 pixels box frame covering the whole soma at 396 ms intervals (Bio-rad). F/F0 changes in a cytoplasmic region within 2 μm of the plasma membrane (dotted region in the image in A) were traced and converted to [Ca2+]i values. The traces were obtained before (light grey), 5 min (dark grey) and 10 min (black) after the beginning of drug application. In each trace, a caffeine puff (double-shaft arrow, second from left) was applied 10 s after the first depolarizing pulse, and the pulses (filled arrows) were repeated after the puff at 10 s intervals. Inset shows superimposed ICa traces recorded at the times marked with the dots below the arrows. Note the elevated basal [Ca2+]i (61.2 ± 8.9 nm by ryanodine (9 neurons) and 67.7 ± 7.0 nm by thapsigargin (10 neurons) at 5 min) and the simultaneous suppression of both types of [Ca2+]i rises by the drugs.
An important characteristic of the rise newly found in this study is that the growth of the rise in the submembrane cytoplasm apparently ceased at 10–20 ms after the beginning of a voltage pulse and the level of F/F0 became almost unchanged even when the pulse and the accompanying ICa still continued (Fig. 1B). The F/F0 level was maintained for at least 50 ms after the end of the pulse. Moreover, when one more depolarizing pulse was applied 50 ms after the first one, no further clear rise in F/F0 was evoked. Thus, there must be a mechanism that stops the F/F0 rise produced by CICR. Such a mechanism is also inferred from the previous observation that a [Ca2+]i rise evoked by an action potential was progressively reduced during its repetition in spite of an increase in Ca2+ entry due to spike broadening of action potential (Akita & Kuba, 2000).
The mechanisms that are obviously excluded for the cessation of the F/F0 rise are an acceleration of normally operating Ca2+ removal processes and/or that of Ca2+ diffusion, since [Ca2+]i did not decay after the first and second pulses at least for a period of 50 ms, albeit it decayed later over several seconds (see Figs 2 and 3). The accelerated Ca2+ removal and/or diffusion should have caused rapid [Ca2+]i decay, as soon as the Ca2+ sources stop operating after the end of depolarization. There are at least four more possible mechanisms for the cessation of F/F0 rise during depolarization. They are (1) saturation of Ca2+ indicators, (2) depletion of Ca2+ stores, (3) time- and/or Ca2+-dependent temporary recruitment of some very fast Ca2+ removal system, which should operate only during the period of depolarization, and (4) an intrinsic negative feedback mechanism of CICR, ‘inactivation’.
Figure 2. Comparison of [Ca2+]i rises evoked by depolarization and caffeine in the same submembrane cytoplasm.

A, X–Y image of a neuron. The white bar indicates the position of linescans (10 μm in length). B, a linescan image of [Ca2+]i rises evoked by 50 ms depolarizing pulses (from −80 to 0 mV) and a caffeine (10 mm) puff. The image was obtained at 110 ms line−1 using twofold Kalman averaging. A caffeine puff (double-shaft arrow, second from left)was delivered 10 s after the first depolarizing pulse, and the pulses were repeated after the caffeine puff at 10 s intervals (filled arrows). The F/F0 trace averaged over the cytoplasm within 2 μm of the plasma membrane, indicated by the bracket to the left of the image, is shown below. Note that the two pulses applied during a caffeine-induced [Ca2+]i rise did not elicit clear [Ca2+]i rises by themselves. Inset shows superimposed traces of ICa induced by individual pulses. The slightly wide width of the superimposed traces during depolarization indicates a little (but not significant) increase in ICa during the caffeine-induced [Ca2+]i rise.
Neither Ca2+ indicator saturation nor Ca2+ store depletion is involved in F/F0 growth termination
To test the first two possibilities, we examined interactions of depolarization-induced F/F0 rises with those elicited by caffeine, a well-known activator of RyRs. Caffeine (10 mm) applied as a puff onto a neuron produced a rise in F/F0 three times larger (275 ± 15.0% in [Ca2+]i, 32 neurons) than that induced by a depolarizing pulse (50 ms, to 0 mV) in the same submembrane cytoplasm (Figs 2B and 3). The rising phase of the caffeine-induced F/F0 rise was smooth and continued for a much longer time (7.9 ± 0.8 s) than that elicited by depolarization. Depolarizing pulses applied during the caffeine-induced rise evoked no or small F/F0 rises by themselves (Figs 2B and 3). ICa elicited by the pulses was not affected during the caffeine-induced F/F0 rise (Figs 2B and 3, inset). Ryanodine (10 μm; Fig. 3A) or a blocker of endoplasmic reticulum (ER) Ca2+ pump, thapsigargin (1 μm; Fig. 3B), diminished simultaneously both the F/F0 rises induced by depolarization and caffeine, confirming the same Ca2+ stores involved. Thus, saturation of Ca2+ indicators and Ca2+ depletion cannot explain the cessation of the F/F0 rise during a depolarizing pulse. Instead, a very fast temporary Ca2+ removal or the inactivation of CICR would have prevented incessant increases in [Ca2+]i during continuous Ca2+ entry in a time- and/or Ca2+-dependent manner. Furthermore, the mechanism might be inhibited, more or less, by caffeine.
Mitochondrial Ca2+ uptake does not participate in [Ca2+]i growth termination
If the fast temporary Ca2+ removal system were to terminate the [Ca2+]i rise caused by CICR, such a mechanism might respond to a high [Ca2+]i in the ‘Ca2+ microdomains’ created in the vicinity of open RyRs since they would be generated only during the period of the pulse. The mechanism might capture all the released Ca2+ before they bind to the indicator OGB-1, causing the cessation of the F/F0 rise. The mechanism, however, should begin to operate with a 10–20 ms delay and would not interfere with the initial fast F/F0 rise. Moreover, to abolish the F/F0 response elicited by the subsequent pulse (Fig. 1B), the mechanism, by contrast, should operate promptly as the subsequent pulse begins. These properties are unlikely to be explained by usual Ca2+ clearance mechanisms. On the other hand, it has been reported that the Ca2+ uptake by mitochondria is mediated by Ca2+ microdomains (Rizzuto et al. 1993). Therefore, to explore whether the mitochondria in this neuron might fulfil all the above properties, we examined the effects of a mitochondrial uncoupler, FCCP, on depolarization-induced [Ca2+]i rises.
FCCP at 1 μm facilitated the run-down of ICa to 61.2 ± 5.1% (9 neurons) in 5 min, elevated the basal [Ca2+]i by 68.4 ± 11.7 nm that remained throughout the experiment (69.0 ± 16.2 nm at 10 min), and reduced the rate of CICR evoked by a depolarizing pulse (50 ms, to 0 mV) to 66.7 ± 6.3% (Fig. 4A). Even under these circumstances, termination of the [Ca2+]i rise during depolarization still took place (Fig. 4A, upper traces). This termination was not due to the Ca2+ store depletion induced by loss of mitochondrial ATP production, since the caffeine-induced [Ca2+]i rise was somewhat enhanced under the influence of FCCP (139 ± 16.7% of control, P < 0.05 by Student's paired t test; 9 neurons; Fig. 4B; see also Friel & Tsien, 1994). (Note also that 4 mm ATP was continuously supplied to neurons via patch pipettes; see Methods.) Furthermore, the depolarizing pulse applied 1 s after the preceding one elicited only a small amount of CICR in the presence of FCCP (34.6 ± 11.6% of the first; Fig. 4C, dark grey at 5 min and black at 10 min) as observed in its absence (Fig. 4C, pale grey). Thus, the termination of [Ca2+]i rises is not caused by acceleration of mitochondrial Ca2+ uptake.
Figure 4. Lack of effect of FCCP on the termination of [Ca2+]i rises during depolarization.

A, effects of 1 μm FCCP on [Ca2+]i rises elicited by 10–50 ms depolarizing pulses to 0 mV. Original F/F0 traces were obtained by linescans at 4 ms scan−1 over the cytoplasm within 2 μm of the plasma membrane, averaged over 2 traces, smoothed by moving average over 12 ms and converted to [Ca2+]i. The lower thin and the upper thick traces show the [Ca2+]i rises before and after FCCP application for 5 min, respectively. The upper traces are also shown on a longer time scale in inset. The ICa records with smaller amplitudes show those in the presence of FCCP. B, a caffeine-induced [Ca2+]i rise in the presence of FCCP. [Ca2+]i rises evoked by a caffeine puff (double-shaft arrow, second from left) and depolarizing pulses (filled arrows) were recorded as in Fig. 3. The traces were obtained before (grey) and 5 min (black) after the beginning of application of 1 μm FCCP. Inset shows superimposed ICa traces recorded at the times marked with the dots below the arrows. Note that the suppression of ICa-induced [Ca2+]i rises during a caffeine-induced [Ca2+]i rise was also observed in the presence of FCCP. C, suppression of the second [Ca2+]i rise elicited 1 s after the preceding pulse. Both depolarizing pulses were from −80 to 0 mV for 50 ms. Traces in light grey, dark grey and black are those before, 5 min and 10 min after application of 1 μm FCCP, respectively. Vm and ICa are shown below.
Time course of CICR inactivation
The foregoing results thus indicate that the termination of the [Ca2+]i rise during depolarization is very unlikely to be explained by any known mechanisms of Ca2+ uptake or extrusion. Hence, the termination must have reflected the inactivation of CICR, i.e. that of RyRs.
The time course of CICR inactivation was examined in detail by varying the duration of the pulse. The rate of rise in F/F0, i.e. that of CICR, evoked by a pulse to 0 mV in the cytoplasm within 2 μm of the plasma membrane increased with increasing pulse duration up to 10 ms (Fig. 5A). Since the amplitude of Ca2+ current (ICa) also increased during this period, the enhancement of CICR must have been caused by an increased number of open Ca2+ channels. Indeed, ICa reached its maximum within 6–8 ms, and so did the rate of CICR (Fig. 5A, inset). This indicates that the rate of CICR certainly varies according to the number of open Ca2+ channels on the plasma membrane, i.e. graded activation of CICR. When the pulse duration was prolonged to more than 10 ms, the growth of the F/F0 rise was terminated despite the maintenance of ICa (Fig. 5B). Extending the duration to much longer than 100 ms, however, revealed that the second phase of the slow F/F0 rise in fact occurred after the termination of the fast F/F0 rise during a long depolarizing pulse (Fig. 5C). The amplitude of the second phase reached only less than half of the initial fast F/F0 rise at the end of a 500 ms pulse, at which > 60% of ICa still remained. Thus, most of the initial CICR was suppressed by inactivation within 10–20 ms, and a small residual CICR remained in the subsequent period.
Figure 5. Time course of CICR during continuous Ca2+ entry.

A–C, F/F0 rises elicited by depolarizing pulses to 0 mV with various durations. Pulse durations were 2–10 ms in A, 10–50 ms in B, 100–500 ms in C, respectively. The darker trace was the F/F0 rise elicited by the pulse of longer duration. F/F0 traces were obtained at 4 ms linescan−1 from the cytoplasm within 2 μm of the plasma membrane, averaged over 2 traces and smoothed by moving average over 12 ms. The traces in different panels were from different neurons. Vm and ICa are shown below. The inset in A shows the correlation of ICa at the ends of 2–10 ms depolarizing pulses with the resulting rates of CICR (fCa), obtained from 12 neurons. ICa and fCa were normalized to those evoked by a 10 ms pulse (ICa10ms and fCa10ms, respectively). The plot was fitted with a straight line (dashed line; slope, 0.89; r2 value, 0.68).
Ca2+ dependence of CICR inactivation
To examine the process of recovery from inactivation, double pulses (to 0 mV) of varying interval and duration were applied. The pulse given at < 50 ms after a preceding 10 ms pulse could not elicit a distinct [Ca2+]i rise without a change in ICa (Fig. 6A). The second [Ca2+]i rise, i.e. CICR, was progressively restored with increasing pulse interval from 50 ms to 1 s (Fig. 6A and B; summarized by circles in Fig. 7A). When the pulse duration was increased to 50 ms, the recovery of the second CICR was markedly retarded (Fig. 6C; squares in Fig. 7A). This retarded recovery was accompanied by a slower [Ca2+]i decay after the first pulse, which was more clearly shown when the pulse duration was varied with a fixed pulse interval of 1 s (Fig. 6D). Thus, the results indicate no direct correlation of the recovery with the time interval from the preceding activation of CICR. Instead, when the rate of the second CICR (see Appendix for the basis for its estimation) was plotted against the net increase in [Ca2+]i from the resting level (Δ[Ca]) immediately before the pulse, the correlation was collectively fitted well by a common Δ[Ca] dependence curve. This indicates the half-maximal suppression at 59.6 nm with a Hill coefficient of 6.4 (from 41 neurons, Fig. 7B, open symbols).
Figure 6. Suppression and recovery of CICR examined with paired depolarizing pulses of varying interval and duration.

A–C, suppression of the second [Ca2+]i rise and its recovery with increasing pulse interval. Pulse intervals were 10, 20 and 50 ms in A, and 100, 200, 500 and 1000 ms in B and C, respectively, and pulse durations were 10 ms in A and B, and 50 ms in C. All pulses were from −80 to 0 mV. Original F/F0 traces were obtained at 4 ms linescan−1 from the cytoplasm within 2 μm of the plasma membrane. Traces were averaged over 2 traces, smoothed by moving average over 12 ms and converted to [Ca2+]i. The darker trace shows the [Ca2+]i trace obtained with a longer pulse interval. Superimposed Vm and ICas are shown below. The inset in A shows the expanded traces around the peaks of [Ca2+]i rises below the bracket. Arrows indicate the beginnings of the second pulses. D, effects of varying pulse duration on [Ca2+]i decay and on the second response. The duration was varied from 10 ms to 20, 50 and 100 ms at a fixed pulse interval of 1 s. The darker trace shows the trace obtained with longer duration. E and F, stronger suppression of the second [Ca2+]i rise elicited 10 ms (E) and 20 ms (F) after the first 10 ms pulse, respectively, with the second pulse of 100 ms duration. All pulses were from –80 to 0 mV. The [Ca2+]i traces were obtained at 2 ms linescan−1. Thick dashed lines show linear regression slopes over the initial rising phase of the second [Ca2+]i rise, whereas thin continuous lines represent extrapolations of the slopes over the data points during the last 80 ms of the second pulse. The end of the initial rising phase was defined as the point where the [Ca2+]i rise crosses first the thin continuous line.
Figure 7. Ca2+ dependence of CICR inactivation.

This Δ[Ca] dependence, however, did not hold for the second CICR elicited after an interval of < 50 ms, as shown in Fig. 6A where the Δ[Ca] level before the second pulses was almost constant. The absence of distinct CICR within this period thus indicated a much greater extent of inactivation. This was confirmed with another protocol, in which the second pulse of 100 ms duration was applied < 50 ms after the first 10 ms pulse (Fig. 6E and F). The long second pulse indeed evoked apparently only a slow [Ca2+]i rise. When the initial rate of the second CICR was estimated by two-step linear regression (dashed lines in Fig. 6E and F; see Methods and legend for details), the rates of CICR elicited at 10 ms and 20 ms after the first pulse were certainly somewhat smaller than those expected from the Δ[Ca] dependence curve (filled circles in Fig. 7B). The rate evoked at 50 ms with this protocol recovered to the value on the curve (not shown). Hence, these results suggest that the extent of CICR inactivation during Ca2+ entry must have been much greater than would be expected from the Δ[Ca] dependence and it was lessened gradually to the expected level within ∼50 ms after the end of Ca2+ entry.
CICR inactivation is prevented by BAPTA, not by EGTA
The results above thus raise the possibility that CICR inactivation during Ca2+ entry would be mediated by a [Ca2+]i much higher than estimated on the assumption of the equilibrium between Ca2+ and the indicators; such a [Ca2+]i must be that in Ca2+ microdomains in the immediate vicinity of open Ca2+ channels and/or RyRs. This possibility was explored by applying BAPTA or EGTA at varying concentrations to the cytoplasm. As is well known, BAPTA shrinks drastically the microdomains in a dose-dependent way, whereas EGTA affects them less (Neher, 1986).
As expected, the inactivation was affected drastically by BAPTA, but not by EGTA. The characteristic transition from the initial fast F/F0 rise to the much slower one due to inactivation was obscured by BAPTA at 0.1–0.3 mm and finally abolished at > 1 mm, resulting in the linear F/F0 rise throughout the period of a depolarizing pulse (Fig. 8A). This effect of BAPTA reflected the dose-dependent changes in two factors. One was the rise time of the initial fast F/F0 rise (Fig. 8A, dotted lines; and Fig. 9B). Another was the relative rate of CICR during the slow rising phase compared to the initial rate (fCa 50–100ms/fCa initial, Fig. 9C). Both factors increased substantially at 0.1–0.3 mm, causing the large increase in peak ΔF/F0 amplitude generated by a 100 ms pulse at those concentrations (Table 1A). Note that the rate of the initial fast F/F0 rise was also decreased markedly by BAPTA especially at >0.3 mm (Figs 8A and 9A), whose mechanism is discussed below. In contrast to BAPTA, EGTA affected little the transition to the slow F/F0 rise during a pulse (Fig. 8B). Even in the presence of 1–10 mm EGTA, the rise time of the initial fast F/F0 rise was prolonged only slightly by several milliseconds and fCa 50–100ms/fCa initial was unchanged or rather suppressed (Table 1B). These results clearly indicate that CICR inactivation is prevented by BAPTA, but not by EGTA. This means that the Ca2+ sensors for inactivation must be exposed to a high [Ca2+]i in Ca2+ microdomains, which is affected strongly by BAPTA but less by EGTA. The prolonged rise time and the increased fCa 50–100ms/fCa initial by BAPTA must reflect the decrease in the speed of inactivating reactions due to the reduced [Ca2+]i on the Ca2+ sensors.
Figure 8. BAPTA, but not EGTA, prevents CICR inactivation.

A, effect of BAPTA on the F/F0 rise evoked by a depolarizing pulse. BAPTA was introduced via a whole-cell patch pipette at the concentration indicated above each F/F0 trace. The grey trace in the leftmost panel was from a neuron not loaded with BAPTA. Vertical dotted lines indicate the presumed end points of the initial fast rising phase. The pulse was from −80 to 0 mV for 100 ms. Records were from neurons cultured at 8°C and taken at 40 min after establishing the whole-cell mode. Each F/F0 trace was obtained at 2 ms linescan−1 from the cytoplasm within 2 μm of the plasma membrane, averaged over 3 traces and smoothed by moving average over 10 ms. Differences in resting fluorescence (F0) were not considered here. B, effect of EGTA on the F/F0 rise. The concentration of EGTA introduced via the pipette is indicated above each trace. The grey trace in the leftmost panel was from a neuron not loaded with EGTA. Other explanations are the same as those in A. C, paired pulses of 50 ms duration were applied at an interval of 50 ms to a neuron loaded with 1 mm EGTA.
Figure 9. Dose-dependent effects of BAPTA on two rising phases of a depolarization-induced F/F0 rise.

The reduction of the rate of the initial F/F0 rise by BAPTA is evidently independent of the removal of CICR inactivation by BAPTA. The initial openable fractions of RyRs before pulse application would have been similar at all the examined concentrations of 0.1–3 mm, because the intensity of resting basal fluorescence in the cytoplasm, reflecting resting [Ca2+]i, did not vary significantly (Table 1A). Thus, the decrease in the initial rate of rise would be caused by two mechanisms. One is the competitive Ca2+ binding by BAPTA with respect to the Ca2+ indicator, OGB-1. Because Ca2+-binding rates of BAPTA and OGB-1 must be similar, the fraction of released Ca2+ immediately bound to BAPTA should increase with increasing BAPTA concentrations. This obviously reduces reciprocally the fraction bound to OGB-1, i.e. the rate of rise in F/F0 in response to a given rate of CICR. It should be noted, however, that the competition occurs not only between BAPTA and OGB-1, but also with endogenous Ca2+ buffers if they bind Ca2+ as fast as BAPTA. Thus, the extent of decrease in the rate of rise in fact should also be determined by the amount of such endogenous buffers. Another mechanism would be the inhibition of RyR activation by BAPTA. High concentrations of BAPTA would also reduce the [Ca2+]i on the Ca2+ sensors for activation as well as that for inactivation, thereby reduce the open probability of RyRs. Which of these mechanisms was dominant, however, cannot be determined from the present data. Nevertheless, it is evident that the effect of BAPTA on RyR activation was weaker than that on inactivation, because the significant F/F0 rise indicating RyR activation was still certainly generated even in the presence of 3 mm BAPTA where the inactivation was abolished perfectly. This indicates that the sensors for activation must be located much closer to the centres of Ca2+ microdomains, i.e. the pores of Ca2+ channels and RyRs. On the other hand, EGTA did not reduce so much the initial rate of rise in F/F0 (Fig. 8B). The decrease in the rate was significant only at 10 mm by about 25% (Table 1B). This evidently indicates that EGTA was less effective both in competing for Ca2+ and also in inhibiting CICR activation compared with BAPTA. This must reflect the fact that most of the observed F/F0 signals during a depolarizing pulse are derived from the Ca2+ microdomains of open RyRs and that EGTA binds less Ca2+ during its rapid movement across the microdomains because of its much slower Ca2+-binding rate.
The two different effects of Ca2+ buffering by BAPTA on the initial rate of rise are expressed collectively with eqn (A7) in the Appendix. We could use eqn (A7) to estimate the capacity of endogenous BAPTA-type fast Ca2+ buffers, κBn. By fitting the dose-dependent reduction of the initial rate with eqn (A7) (Fig. 9A, continuous line) on the assumption of no effect of BAPTA on CICR activation (ω = 1 in eqn (A7)), it was estimated to be 487.6. This is 32 times larger than the capacity of OGB-1 at 10 μm (κD ≈ 15). If BAPTA, in fact, inhibited CICR activation to some extent (ω < 1) in a dose-dependent way, full activation of CICR without inhibition should have produced a much larger rate of rise and thus the real κBn must be much greater. The existence of such a large capacity of endogenous fast Ca2+ buffers would explain the negligible contribution of ICa to the observed F/F0 signals in this neuron (Figs 1–3).
In contrast to the F/F0 rise during a depolarizing pulse, the decay phase of the rise after the end of the pulse was markedly affected by EGTA, but less by BAPTA. In the presence of EGTA, F/F0 decayed rapidly to a quasi-steady level after the pulse (Fig. 8B). The decay time constant and the steady ΔF/F0 level (% of peak) became smaller at higher concentrations of EGTA (Fig. 8B, Table 1B). This must indicate that the potentially high Ca2+-binding capacity of EGTA was revealed after the pulse because of disappearance of the Ca2+ microdomains produced by residual CICR during the pulse. The rapid removal of Ca2+ by EGTA from the Ca2+ sensors for inactivation after the pulse was also indicated by the clear [Ca2+]i rise evoked by the second depolarizing pulse given 50 ms after the preceding one (Fig. 8C). On the other hand, such a rapid dose-dependent F/F0 decay just after the pulse was not observed in the presence of BAPTA (Fig. 8A). This is because all Ca2+-binding species in this condition should react equally to Ca2+ even within the microdomains, and the F/F0 decay after the pulse must be driven purely by the usual Ca2+ clearance mechanism.
CICR inactivation takes place on both activated and non-activated RyRs
The high Ca2+ sensitivity of the inactivation mechanism (Fig. 7B) raises the question of whether the Δ[Ca] in the global bulk cytoplasm affects also the state of non-activated RyRs when only a fraction of RyRs are activated by a weak preceding stimulus. This was examined by changing the fraction of RyRs opened by a conditioning depolarizing pulse and applying a fully activating test pulse (to 0 mV) 50 ms later (Fig. 10A). If non-activated RyRs during the conditioning pulse are not affected by the global Δ[Ca], CICR evoked by the test pulse must be due to the opening of the non-activated RyRs plus some of the activated RyRs that recovered from inactivation during the pulse interval. Then, it is expected that the sum of the fractions of RyRs activated by the conditioning and test pulses becomes larger than unity. The actual sum, on the contrary, was less than unity over a wide range of initial activated fractions (23 neurons, Fig. 10B). Thus, there is no doubt that some of the non-activated RyRs during the conditioning pulse are also inactivated before the test pulse. When the rate of CICR evoked by the test pulse was plotted against the Δ[Ca] level just before the pulse, it was found that the rate was much smaller than would be expected from the Δ[Ca] dependence curve in Fig. 7B, especially in the mid- to low-Δ[Ca] range (Fig. 10C). Evidently, this also supports the inactivation of non-activated RyRs, because a much larger rate of CICR evoked by a test pulse would otherwise be expected. The much smaller rate than expected further suggests the possibility that some of the non-activated RyRs might also have been inactivated through a [Ca2+]i higher than the bulk Δ[Ca] in some way.
Figure 10. Inactivation of non-activated RyRs under the conditions of partially activated CICR.

A, [Ca2+]i rises evoked by the conditioning and test depolarizing pulses given at an interval of 50 ms. A 50 ms conditioning pulse of varying amplitude in the voltage range of −30 to 0 mV was followed by a 50 ms test pulse to 0 mV. Original F/F0 traces were obtained at 2 ms linescan−1 from the cytoplasm within 2 μm of the plasma membrane, averaged over 2 traces and smoothed by moving average over 10 ms. The trace obtained with a smaller conditioning pulse is shown in darker grey. Thick dashed lines over the [Ca2+]i traces indicate linear regression slopes over the initial rising phase determined as described in Methods. Thin dotted lines are to show clearly the changes in slope. The slope for the top trace during the test pulse was determined as the slope over the entire period of the pulse, because fast and slow rising phases were not clearly separated. Despite this uncertainty, note the evidently smaller changes in the slope elicited by the test pulse. Superimposed Vm and ICa are shown below. B, dependence of the sum of the fractions of RyRs activated by the conditioning and test pulses on the conditioning voltage level. The initial rates of rise in F/F0 elicited by both the pulses were normalized to the maximum rate evoked by a pulse to 0 mV under the resting conditions (fCa1st/fCamax and fCa2nd/fCamax, respectively) and indicated as a stack bar (white bars for fCa1st/fCamax and grey bars for fCa2nd/fCamax, respectively). The data were from 23 neurons cultured at room temperature. C, the plot of fCa2nd/fCamax against the Δ[Ca] just before the test pulse. When the ICa evoked by the test pulse was smaller than that evoked under resting conditions, fCa2nd was corrected as described in Fig. 7. The Δ[Ca] dependence curve shown in Fig. 7B is reproduced with the thick dashed line.
A mechanism counteracting Ca2+ clearance is linked to CICR inactivation
One remaining problem is the progressive decrease in the [Ca2+]i decay rate after a depolarizing pulse with increasing pulse duration (Fig. 6D). The speed of operation of Ca2+ clearance mechanisms in general should increase with increasing Δ[Ca] and should reach a plateau of the maximum in a high Δ[Ca] range where the Ca2+-binding sites of the mechanisms are saturated. The ‘decrease’ in the decay rate thus indicates that some counteracting effect against Ca2+ clearance, i.e. active suppression of the clearance mechanisms or induction of additional Ca2+ sources, must be introduced and augmented with increasing pulse duration. To estimate the magnitude of the counteracting effect introduced by each pulse, we plotted the decay rates of [Ca2+]i rises evoked by the pulses (to 0 mV) of various durations against Δ[Ca], determined a possible Δ[Ca]-dependence curve of the intrinsic clearance mechanisms when the counteracting effect was weak or absent, and then examined the deviation of each decay rate from the curve.
When the pulse duration was in the range ≤ 10 ms, an increase in duration caused a larger [Ca2+]i rise and a faster [Ca2+]i decay after the end of the pulse (Fig. 11A). The decay rates at 0.25 s (circles in Fig. 11D), 0.5 s (squares) and 1 s (triangles) after the beginning of the pulse were collectively described by a function of Δ[Ca] to the power of 1.2–1.6 (the area bounded by dashed curves in Fig. 11D). It is evident that the faster decay must have been caused by Δ[Ca]-dependent enhancement of the clearance mechanisms. Thus, the plot suggests that the counteracting effect introduced during a ≤ 10 ms pulse was small, if any, and the power function would reflect mainly the intrinsic Δ[Ca] dependence of the clearance mechanisms in the absence of the counteracting effect. By contrast, when the duration was prolonged to more than 10 ms, during which the fast growth of the [Ca2+]i rise was terminated through inactivation, the decay rate decreased progressively with increasing pulse duration (Fig. 11B). The slowed decay rate persisted over > 1 s, resulting in the rate at 1 s much slower than that just after the end of a 10 ms pulse even at a higher Δ[Ca]. Extending the pulse duration to more than 100 ms caused almost no decay or a weak rising phase persisting over > 0.5 s after the end of the pulse (Fig. 11C). These changes thus resulted in the downward deflection of the plot of decay rates from the power function with increasing pulse duration and Δ[Ca] levels, reaching even in the negative range (Fig. 11D). Since the extent of deflection at a given Δ[Ca] should indicate roughly that of the counteracting effect, the plot clearly demonstrates that a large effect was introduced abruptly when the pulse duration became > 10 ms and the effect was augmented very strongly for a longer pulse duration. Furthermore, the effect was lessened little even 1 s after the pulse.
Figure 11. Evidence for the link between CICR inactivation and a mechanism counteracting Ca2+ clearance.

A–C, enhancement and suppression of the [Ca2+]i decay after a depolarizing pulse to 0 mV with increasing pulse duration. The duration was varied from 2 to 10 ms in A, 10 to 50 ms in B and 100 to 500 ms in C, respectively. Upward brackets indicate the periods of the longest pulse in A and B, and the periods of 100, 200 and 500 ms in C, respectively. The records were taken from those in Fig. 5A–C, demonstrated on a longer time scale and converted to [Ca2+]i. The decay time courses after the pulses of < 50 ms duration were fitted with double exponentials, while those after 50 ms and 100 ms pulses and some of those after a 200 ms pulse were with single exponentials. Further longer pulses caused slow exponential rises over the period of linescans for 2 s. The slow rises later turned into decay, and [Ca2+]i was restored to the initial resting level within 30–60 s (not shown). The fitted exponentials are shown by thin lines on the [Ca2+]i traces. Thick bars are placed tangentially on the fits at 0.25, 0.5 and 1 s after the beginning of depolarization. D, the plot of the decay rate against Δ[Ca]. The symbols of circles, squares and triangles indicate the mean values at 0.25, 0.5 and 1 s, respectively, over 33 neurons. The decay rates were normalized to the rate at 0.25 s after a 10 ms pulse. Each number above the symbols indicates the pulse duration. Dashed lines show the fits of power functions over the data points generated by 2–10 ms depolarizing pulses. The line on the circles represents the function of Δ[Ca] expressed as 1.1 × 10⁻² Δ[Ca]1.2, and another line on the squares and triangles shows the function as 1.6 × 10⁻³ Δ[Ca]1.6. E, effects of BAPTA on the [Ca2+]i decay after a 100 ms depolarizing pulse to 0 mV. The traces in the presence of BAPTA at 0.1–1 mm, shown in pale grey, are the same as those in Fig. 8C, but shown on a longer time scale and converted to Δ[Ca]. The trace in dark grey is that in the absence of BAPTA. The decay time course in the presence of BAPTA was fitted with double exponentials. Thin lines and thick bars are placed similarly to those in A–C. F, the plot of the decay rate against Δ[Ca] in the presence of BAPTA at 0.1 mm, 0.3 mm (single shaft arrows) and 1 mm (double shaft arrows). The decay rate at each moment was corrected for the amount of Ca2+ librated from BAPTA as described in Appendix. The corrected rate was then normalized to the mean value of the rate at 0.25 s after a 10 ms pulse in the absence of BAPTA (−51.6 ± 5.8 nm s−1; n = 17), and plotted against Δ[Ca] similarly to that in D. The power functions in D are reproduced with the same lines. The data produced by 10–500 ms depolarizing pulses in D were represented by three continuous curves connecting the same symbols. Data were from 9 neurons for 0.1 mm and 0.3 mm, and 10 neurons for 1 mm, respectively.
The occurrence of the significant counteracting effect after CICR inactivation strongly suggests that the inactivation is a prerequisite for the counteracting effect. To confirm this idea, we examined whether BAPTA, which blocks inactivation, also prevents induction of the counteracting effect. This was explored by examining the effect of BAPTA on the [Ca2+]i decay after a 100 ms pulse, in which a very large counteracting effect was involved in the absence of BAPTA (Fig. 11D). The decay rate after a 100 ms pulse was enhanced at all times in the presence of 0.1–1 mm BAPTA (pale grey traces in Fig. 11E), when it was compared with that in its absence (dark grey trace in Fig. 11E). It should be noted that the decay rate in the presence of BAPTA at a given Δ[Ca] would have decreased with increasing BAPTA concentrations, if the counteracting effect had not been affected. This is because the Ca2+ liberated from BAPTA as its buffering action during the decay phase should burden Ca2+ clearance mechanisms (cf. eqns (A4) and (A8) in Appendix). The enhancement of the decay in the presence of BAPTA therefore strongly suggests that induction of the counteracting effect must have been greatly prevented by BAPTA. Indeed, when the decay rates in the presence of BAPTA were converted to those expected for the absence of the buffering action of BAPTA (see Appendix for details), the rates at 0.5 s and 1 s after the pulse in the presence of 0.1 mm BAPTA were lower only slightly than those expected from the power function, and the rates in 0.3–1 mm BAPTA came to lie on the function (squares and triangles in Fig. 11F). The rate at 0.25 s was much higher than the function at higher concentrations of BAPTA (circles in Fig. 11F). Thus, the counteracting effect was indeed removed out by BAPTA dose dependently. Since the removal followed the dose-dependent inhibition of CICR inactivation during the pulse (Figs 8A, and 9B and C), the result confirms that a mechanism counteracting Ca2+ clearance is certainly linked to CICR inactivation.
Discussion
The present study demonstrates Ca2+-dependent inactivation of CICR/RyRs in bullfrog sympathetic neurons. The [Ca2+]i rise evoked by a depolarizing pulse in this neuron is produced predominantly by CICR, and the rise mostly stopped growing within 10–20 ms, then switched to a much slower rising phase during persistent Ca2+ entry. This mode of the rise was unaffected by a mitochondrial uncoupler, FCCP. The depolarization-induced [Ca2+]i rise after a preceding one was restored in a Δ[Ca]-dependent manner. Thus, Ca2+-dependent inactivation of CICR must take place during persistent Ca2+ entry.
A number of important characteristics were further revealed. First, the extent of inactivation immediately (< 50 ms) after the end of a depolarizing pulse was in fact greater than expected from the Δ[Ca] dependence. Second, the inactivation during the pulse was inhibited by BAPTA (> 0.1 mm) but not by EGTA (≤ 10 mm). These indicate that the inactivation during the pulse must be mediated by a high [Ca2+]i in the Ca2+ microdomains created in the vicinity of open Ca2+ channels and/or RyRs. The Ca2+ sensors for inactivation, however, must be somewhat remote from the centres of microdomains compared with those for activation, because the activation was less sensitive to BAPTA. Third, it was found that RyRs can be inactivated without preceding activation, especially when CICR is partially activated by weak depolarization. Finally, a mechanism counteracting Ca2+ clearance was found to be linked to CICR inactivation. The counteracting effect was introduced and potentiated progressively during a > 10 ms depolarizing pulse, and the effect persisted over > 1 s after the pulse. This resulted in the slower [Ca2+]i decay after a longer depolarizing pulse. Based on these characteristics, possible mechanisms for RyR inactivation in bullfrog sympathetic neurones are discussed below.
Possible mechanisms for RyR inactivation
The evidence for the direct inactivation of non-activated RyRs (Fig. 10) should indicate that either of two different types of Ca2+-mediated state transitions can occur on every RyR in the resting (R) state at the beginning of depolarization: one is the transition to the open (O) state, and another is that to the inactivated (I) state. Evidently, which transition dominantly occurs on each RyR must be determined by whether its Ca2+-binding regulatory sites for activation are exposed to a sufficiently high [Ca2+]i or not. Thus, possible reaction schemes of state transitions of RyRs in this neuron would be as follows: 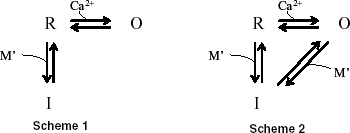
where M′ denotes the Ca2+-bound form of the mediator molecule M, assumed to interact with RyRs to convert them into the I state. The M was introduced because the half-maximum inhibition of inactivation at ∼0.4 mm BAPTA (Fig. 9B and C) suggests that the Ca2+ sensors for inactivation would be located ∼60 nm away from the centres of Ca2+ micodomains (according to the Neher (1986) equation); it is far longer than the diameter of a single RyR molecule (∼30 nm; Serysheva et al. 1999). The difference between Schemes 1 and 2 resides in whether the I state can derive only from R or both from R and O. In terms of the open–close structural conformational change of a single RyR molecule (Serysheva et al. 1999), the difference means whether the conformational change affects the M′ binding to a RyR very strongly (Scheme 1) or little (Scheme 2). In any case, most of the RyRs in the R state must be rapidly converted to O when fully activating Ca2+ entry begins, although the entering Ca2+ should act also on M for the conversion to I. The R–O transition would be directly regulated by a very high [Ca2+]i near the centres of Ca2+ microdomains of adjacent open Ca2+ channels and/or RyRs. After reaching the equilibrium between the populations in the R and O states, the conversion to I should proceed slowly from the remaining R (Scheme 1) or both from R and O (Scheme 2). In either case, the process must be mediated by the M′ exposed to a [Ca2+]i in the ‘periphery’ of the microdomains, i.e. the [Ca2+]i lower than that for activation but still affected little by EGTA. Then, when the sizable population of I is generated, the final equilibrium between R, O and I must be attained and maintained as long as Ca2+ entry continues. The remaining O in the final equilibrium explains the sustained residual CICR during continuous Ca2+ entry, which was resistant to the EGTA treatment (Fig. 8B). Obviously, in the case of a weak stimulus the non-activated RyRs must be converted directly to I in both schemes through a [Ca2+]i rise generated by other activated RyRs. After the end of Ca2+ entry, the high [Ca2+]i regulating both the transitions to O and I should disappear and the Δ[Ca] in the bulk cytoplasm remains. At that time the residual RyRs in the O state must be rapidly flipped back to R. On the other hand, due to the high Ca2+ sensitivity of the inactivation mechanism, the relaxation process from I to R should proceed much more slowly, and then the next equilibrium is finally reached in the Δ[Ca]. This must be reflected in the greater extent of inactivation immediately after the end of Ca2+ entry and the following Δ[Ca]-dependent recovery of the second CICR (Figs 6 and 7).
There is still no evidence to suggest a possible candidate for the inactivation mediator M. One might expect the involvement of calmodulin, since it is known to inhibit RyRs at a high [Ca2+]i (Rodney et al. 2000; Balshaw et al. 2002). A peptide (10–100 μm) of a calmodulin-binding domain of rat calmodulin-dependent protein kinase II (290–309; Calbiochem) introduced via patch pipettes into this neuron, however, did not affect the extent of inactivation, but reduced the initial maximal rate of CICR (T. Akita, unpublished observation). Thus, calmodulin seems, at the least, not to be involved in the inactivation process of CICR, but rather to stabilize or facilitate CICR in this neuron, as seen in frog skeletal muscle fibres (Rodney & Schneider, 2003).
The remaining question is about the mechanism counteracting Ca2+ clearance. The mechanism must be either the suppression of Ca2+ clearance or the additional Ca2+ release from somewhere in the cytoplasm. The former mechanism is unlikely because it should not generate the slow [Ca2+]i rising phase persisting over > 0.5 s after the end of a depolarizing pulse. For the latter mechanism of additional Ca2+ release, mitochondria can be excluded from possible sources because the slower [Ca2+]i decay after a longer depolarizing pulse was still observed in the presence of FCCP (Fig. 4A, inset). Furthermore, we used a Na+-free patch electrode solution (see Methods) to block mitochondrial Ca2+ release as reported by Colegrove et al. (2000) in this neuron. Therefore, considering that CICR inactivation is a prerequisite for the mechanism operation, the most straightforward idea of the mechanism is the Ca2+ release via RyRs in the additional ‘fourth’ open state. This state must be generated very slowly from I with the help of Ca2+ entry and/or residual CICR during a depolarizing pulse, and the state must be maintained over > 1 s after the end of the pulse. Furthermore, the state must be different from O in that it cannot generate a steady Ca2+ microdomain, as indicated by the rapid [Ca2+]i decay after the end of the pulse in the presence of EGTA. Thus, the RyR in the fourth state should not stay open; it should open and close quickly and repetitively with a short open time like ‘flickers’.
Comparison with our previous observations
The removal of CICR inactivation by BAPTA at relatively low concentrations (half-maximal inhibition at ∼400 μm; Figs 8A and 9) alerts us to the possibility of yielding different experimental results depending on the concentration of the Ca2+ indicator used. Our early CICR study (Hua et al. 1993) using 100 μm of fura-2 or indo-1, which was 10 times higher concentration than that used in this study (10 μm), did indeed yield seemingly contradicting results of [Ca2+]i changes in response to depolarizing pulses in this neuron. Especially contrasting were the enhancement of [Ca2+]i rises with increasing pulse duration (Fig. 7 of Hua et al. (1993)) and the paired-pulse facilitation of CICR (Figs 10–13 of Hua et al. (1993)). Evidently, under the condition of inhibited CICR inactivation, the amplitude of a [Ca2+]i rise should be markedly enhanced by longer duration or repetition of the pulse.
In addition, most of the [Ca2+]i data in Hua et al. (1993) were obtained as averaged changes over the entire cytoplasm of the neuronal soma. This must have blunted the distinction between the fast and slow rising phases of a [Ca2+]i rise (see Fig. 4F of Hua et al. (1993)).
Comparison with the RyR inactivation in other preparations
The inactivation mechanisms of Ca2+ release via RyRs have been studied well, especially in muscles. There are large differences, however, in two respects between the mode of inactivation in intact cell preparations and that in the preparations of single RyR channels, skinned muscle fibres or fractionalized SR vesicles. Ca2+ release flux terminates within several tens of milliseconds in intact cell preparations (Schneider & Simon, 1988; Sham et al. 1998), whereas the open probability of RyRs decreases over several seconds in response to a large step increase in [Ca2+]i in single RyR preparations (Schiefer et al. 1995; Laver & Lamb, 1998). A relatively high Ca2+ sensitivity (to sub-micromolar [Ca2+]i) of the inactivation mechanism with a high degree of cooperativity was reported in intact skeletal muscles (Schneider & Simon, 1988; Simon et al. 1991). By contrast, a very low Ca2+ sensitivity (> 100 μm) of inactivation was shown in many studies of single RyRs, skinned muscle fibres or fractionalized SR vesicles (Endo, 1982; Nagasaki & Kasai, 1983; Ma et al. 1988; Bezprozvanny et al. 1991; Laver et al. 1995; Murayama et al. 2000). These differences are very likely to be explained by the absence (or washing out) of the Ca2+-sensing mediator molecules for inactivation in the isolated preparations of single channels, skinned fibres or SR vesicles. However, the presumed Ca2+ sensors for inactivation within a single RyR molecule has been suggested as a basis for local control of inactivation even in intact skeletal muscle preparations (Jong et al. 1995; Pizarro et al. 1997; Pape et al. 1998). This inevitably means that the released Ca2+ via a single RyR immediately binds to the sensors on the same RyR through a very high [Ca2+]i on the order of, at least, tens of micromolar, then causing the inactivation within several tens of milliseconds. Nevertheless, such a mechanism is intrinsically incompatible with the characteristics in intact preparations cited above (Schneider & Simon, 1988; Simon et al. 1991). (Assuming that the RyR inactivation in skeletal muscles follows the scheme 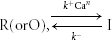 , the time constant of state transition in either direction at a constant [Ca2+]i can be expressed as . Thus, the ratio of the backward time constant after depolarization (τR) to the forward time constant during depolarization (τI) must be
where  is the equilibrium constant. [CaI] is a constant [Ca2+]i assumed to be involved in inactivation during depolarization and Δ[Ca] is the bulk Δ[Ca] remaining after depolarization. The high Ca2+ sensitivity of inactivation should mean K ≈ Δ[Ca]. Thus, when possible values are assigned as [CaI] = 10 μm, K = Δ[Ca] = 100 nm and n = 2, the ratio τR/τI becomes 5000. This means that the backward relaxation from the maximum inactivation after depolarization should take > 100 s and this is evidently incompatible with the observations.) Hence, the issue on the role of a Ca2+-sensing mediator in RyR inactivation in muscles does not appear to be settled. By contrast, our results indicating the differential effects of BAPTA on the activation and inactivation of CICR (Figs 8A and 9) and the high Ca2+ sensitivity and cooperativity of the inactivation mechanism (Fig. 7B) may implicate some mediator molecules for inactivation in bullfrog sympathetic neurons.
Physiological significance of CICR inactivation
One of the important roles of CICR inactivation must evidently be the prevention of excessive [Ca2+]i rises throughout the bulk cytoplasm in response to depolarizing stimuli. The high Ca2+ sensitivity of the mechanism guarantees the prevention when high frequency presynaptic inputs are delivered onto the neuron. Furthermore, the direct inactivation of non-activated RyRs ensures strong suppression of repetitive [Ca2+]i rises even when each input does not elicit full activation of CICR.
Although the primary function of inactivation is undoubtedly to prevent noxious high amplitudes of [Ca2+]i rises, the mechanism counteracting Ca2+ clearance linked to inactivation sustains the suppressed small Δ[Ca] level after depolarizing stimuli. The larger counteracting effect after a longer depolarizing pulse means that the mechanism converts the information of the period of depolarization into the total duration of the Δ[Ca] rise. The sustained Δ[Ca] rise must be reflected by prolonged activation of SK-type Ca2+-sensitive K+ channels, causing longer duration of afterhyperpolarization of repetitive action potentials (Akita & Kuba, 2000). This should provide a prolonged depressant effect on subsequent stimuli onto the neuron through the reduced membrane excitability.
Another important role of inactivation would be related to the mechanism of propagation of intracellular Ca2+ signals just after the delivery of each input. The ER in this neuron is composed of a meshwork of threads of membrane cisterns, and its most peripheral part, called subsurface cisterns, is apposed to the plasma membrane at a distance of 10–12 nm (Watanabe & Burnstock, 1976; Fujimoto et al. 1980; Pivovarova et al. 1999). Our present study strongly suggests the possibility that focal Ca2+ entry on the neuron would trigger regenerative activation of RyRs mediated by Ca2+ microdomains along a specific sequential array of ER cisterns toward the deeper cytoplasm to some extent. The direct inactivation of non-activated RyRs would help confine the area of RyR activation in response to the focal stimulus and shape the spatial pattern of Ca2+ signalling in the cytoplasm.
Acknowledgments
This work was supported by Grants-in-Aid for Scientific Research (No. 01J01226) and Research Fellowships of the Japan Society for the Promotion of Science for Young Scientists to T.A., and Grants-in-Aid from the Japanese Ministry of Education, Science and Culture to K.K. (Nos 04454139 and 06557003).
Appendix
Theoretical basis for estimation of the rate of CICR and Ca2+ extrusion
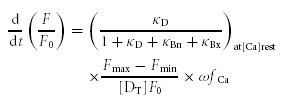
The rate of CICR evoked under resting conditions and the subsequent [Ca2+]i decay
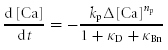
Since the regenerative activation of RyRs in the cytoplasm within 2–3 μm of the plasma membrane was accomplished very fast within several milliseconds, no apparent spatial movements of Ca2+ and mobile Ca2+ buffers can be assumed in the submembrane cytoplasm during the F/F0 rise. Thus, the changes in the cytoplasmic concentrations of free Ca2+ ([Ca]), Ca2+-bound forms of the Ca2+ indicator ([CaD]) and endogenous Ca2+ buffers ([CaBn]) produced by CICR can be simply described by the equation,
| (A1) |
where fCa represents the rate of CICR in a unitary compartment defined arbitrarily in the submembrane cytoplasm. The term  represents the slow Ca2+ removal system governed by [Ca2+]i rises in the bulk cytoplasm (Δ[Ca]). kp and np denote the rate constant and cooperativity coefficient for the removal, respectively.
To estimate the initial maximal fCa,  can be deleted because Δ[Ca] ≈ 0. Thus,
| A2 |
where κD and κBn are Ca2+ buffering capacities ( ,
,  ; Neher & Augustine, 1992) of the indicator and endogenous Ca2+ buffers, respectively. Using the relation of fluorescence intensity F to [CaD], i.e.
 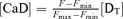 ,
,
| (A3) |
[DT] is the total concentration of the indicator. Fmin and Fmax are the minimum and maximum fluorescence intensities, respectively.
The rate of [Ca2+]i decay in the absence of fCa can be derived from eqn (A1) by rearranging for 
 |
(A4) |
Comparison of the rates of CICR evoked by double pulses
In the analyses of double-pulse experiments (Figs 6, 7 and 10), the rate of CICR evoked by the second pulse (fCa2nd) was normalized to that evoked by the first pulse (fCa1st). When the second pulse was applied during the decay phase of the first [Ca2+]i rise, the  term in the expression of fCa2nd might not have been negligible. However, this term must have been very small when compared to fCa1st. By inserting appropriate values into eqns (A3) and (A4), it can be shown that the magnitude of
  was always < 0.025 of fCa1st in our experiments. Thus fCa2nd/fCa1st can be expressed as
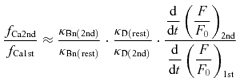 |
(A5) |
Here κBn ≫ κD is also considered. κD(rest) and κD(2nd) are the κD values at the resting [Ca2+] ([Ca]rest) and the [Ca2+] just before the generation of fCa2nd([Ca]2nd ≡ [Ca]rest + Δ[Ca]), respectively, and so are κBn(rest) and κBn(2nd).
The buffering capacity decreases with increasing [Ca2+]i, depending on its Ca2+ affinity 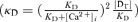 . Although the affinity of endogenous buffers in this neuron is yet unknown, we assumed for analysis that the affinity was so low that a decrease in κBn during a depolarization-induced [Ca2+]i rise was negligible, i.e.
  . Thus,
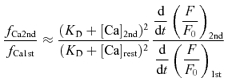 |
(A6) |
The value of  at the peak of a depolarization-induced [Ca2+]i rise ([Ca]2nd ≈ 80 nm + [Ca]rest) was ∼ 1.32, and this became smaller during the [Ca2+]i decay. The fCa2nd/fCa1st values thus calculated were shown in Results and figures. In real situations, κBn should decrease to some extent (i.e.
  ), and
  must be partly cancelled out as indicated by eqn (A5). Thus, the real fCa2nd/fCa1st must have been more or less smaller than those shown in Results and figures, especially at high [Ca]2nd.
ER Ca2+ depletion might also have affected fCa2nd. This effect, however, must have been very small in this neuron, as indicated by the clear second [Ca2+]i rise in the presence of EGTA (Fig. 8C) although most of the released Ca2+ during the first pulse had been bound to EGTA before the second [Ca2+]i rise. Thus, we did not attempt to correct for the effect of depletion on fCa2nd in this study.
Effects of BAPTA on the rate of CICR and the [Ca2+]i decay
When neurons are loaded with BAPTA, the equation for  becomes,
 |
(A7) |
where κBx is the buffering capacity of BAPTA. This is a modified version of eqn (A3). ω denotes the factor for a possible reduction in fCa by BAPTA.
Similarly, the decay rate in the presence of BAPTA becomes (cf. eqn (A4))
 |
(A8) |
Thus, to compare the power of Ca2+ removal in the presence and absence of BAPTA, the measured decay rate in the presence of BAPTA was multiplied by a factor of  at the Δ[Ca] at which the rate occurred. This yielded the corresponding value if it were not for BAPTA (precisely, only for the action of BAPTA on the counteracting effect), which was plotted in the graph in Fig. 11F.
References
- Akita T, Kuba K. Functional triads consisting of ryanodine receptors, Ca2+ channels, and Ca2+-activated K+ channels in bullfrog sympathetic neurons. Plastic modulation of action potential. J Gen Physiol. 2000;116:697–720. doi: 10.1085/jgp.116.5.697. [DOI] [PMC free article] [PubMed] [Google Scholar]
- Akita T, Kuba K. Jpn J Physiol. 2002;52:S139. [Google Scholar]
- Akita T, Kuba K. Abstr Soc Neurosci. 2003;366.6 [Google Scholar]
- Balshaw DM, Yamaguchi N, Meissner G. Modulation of intracellular calcium-release channels by calmodulin. J Membr Biol. 2002;185:1–8. doi: 10.1007/s00232-001-0111-4. [DOI] [PubMed] [Google Scholar]
- Bezprozvanny I, Watras J, Ehrlich BE. Bell-shaped calcium-response curves of Ins(1,4,5),P3- and calcium-gated channels from endoplasmic reticulum of cerebellum. Nature. 1991;351:751–754. doi: 10.1038/351751a0. [DOI] [PubMed] [Google Scholar]
- Colegrove SL, Albrecht MA, Friel DD. Dissection of mitochondrial Ca2+ uptake and release fluxes in situ after depolarization-evoked [Ca2+]i elevations in sympathetic neurons. J Gen Physiol. 2000;115:351–370. doi: 10.1085/jgp.115.3.351. [DOI] [PMC free article] [PubMed] [Google Scholar]
- Cseresnyés Z, Schneider MF. Peripheral hot spots for local Ca2+ release after single action potentials in sympathetic ganglion neurons. Biophys J. 2004;86:163–181. doi: 10.1016/S0006-3495(04)74094-1. [DOI] [PMC free article] [PubMed] [Google Scholar]
- DiGregorio DA, Peskoff A, Vergara JL. Measurement of action potential-induced presynaptic calcium domains at a cultured neuromuscular junction. J Neurosci. 1999;19:7846–7859. doi: 10.1523/JNEUROSCI.19-18-07846.1999. [DOI] [PMC free article] [PubMed] [Google Scholar]
- Endo M. Mechanism of calcium-induced calcium release in the SR membrane. In: Ohnishi ST, Endo M, editors. The Mechanism of Gated Calcium Transport Across Biological Membranes. New York: Academic Press; 1982. pp. 257–264. [Google Scholar]
- Escobar AL, Monck JR, Fernandez JM, Vergara JL. Localization of the site of Ca2+ release at the level of a single sarcomere in skeletal muscle fibres. Nature. 1994;367:739–741. doi: 10.1038/367739a0. [DOI] [PubMed] [Google Scholar]
- Fabiato A. Time and calcium dependence of activation and inactivation of calcium-induced release of calcium from the sarcoplasmic reticulum of a skinned canine cardiac Purkinje cell. J Gen Physiol. 1985;85:247–289. doi: 10.1085/jgp.85.2.247. [DOI] [PMC free article] [PubMed] [Google Scholar]
- Friel DD, Tsien RW. A caffeine- and ryanodine sensitive Ca2+ store in bullfrog sympathetic neurones modulates effects of Ca2+ entry on [Ca2+]i. J Physiol. 1992;450:217–246. doi: 10.1113/jphysiol.1992.sp019125. [DOI] [PMC free article] [PubMed] [Google Scholar]
- Friel DD, Tsien RW. An FCCP-sensitive Ca2+ store in bullfrog sympathetic neurons and its participation in stimulus-evoked changes in [Ca2+ J Neurosci. 1994;14:4007–4024. doi: 10.1523/JNEUROSCI.14-07-04007.1994. [DOI] [PMC free article] [PubMed] [Google Scholar]
- Fujimoto S, Yamamoto K, Kuba K, Morita K, Kato E. Calcium localization in the sympathetic ganglion of the bullfrog and effects of caffeine. Brain Res. 1980;202:21–32. [PubMed] [Google Scholar]
- Hsu JC. Multiple Comparisons. Theory and Methods. Boca Raton: Chapman & Hall/CRC; 1996. [Google Scholar]
- Hua SY, Liu C, Lu FM, Nohmi M, Kuba K. Modes of propagation of Ca2+-induced Ca2+ release in bullfrog sympathetic ganglion cells. Cell Calcium. 2000;27:195–204. doi: 10.1054/ceca.2000.0114. [DOI] [PubMed] [Google Scholar]
- Hua SY, Nohmi M, Kuba K. Characteristics of Ca2+ release induced by Ca2+ influx in cultured bullfrog sympathetic neurones. J Physiol. 1993;464:245–272. doi: 10.1113/jphysiol.1993.sp019633. [DOI] [PMC free article] [PubMed] [Google Scholar]
- Jong DS, Pape PC, Baylor SM, Chandler WK. Calcium inactivation of calcium release in frog cut muscle fibers that contain millimolar EGTA or Fura-2. J Gen Physiol. 1995;106:337–388. doi: 10.1085/jgp.106.2.337. [DOI] [PMC free article] [PubMed] [Google Scholar]
- Kuba K. Release of calcium ions linked to the activation of potassium conductance in a caffeine-treated sympathetic neurone. J Physiol. 1980;298:251–269. doi: 10.1113/jphysiol.1980.sp013079. [DOI] [PMC free article] [PubMed] [Google Scholar]
- Laver DR, Lamb GD. Inactivation of Ca2+ release channels (ryanodine receptors RyR1 and RyR2) with rapid steps in [Ca2+] and voltage. Biophys J. 1998;74:2352–2364. doi: 10.1016/S0006-3495(98)77944-5. [DOI] [PMC free article] [PubMed] [Google Scholar]
- Laver DR, Roden LD, Ahern GP, Eager KR, Junankar PR, Dulhunty AF. Cytoplasmic Ca2+ inhibits the ryanodine receptor from cardiac muscle. J Membr Biol. 1995;147:7–22. doi: 10.1007/BF00235394. [DOI] [PubMed] [Google Scholar]
- Ma J, Fill M, Knudson CM, Campbell KP, Coronado R. Ryanodine receptor of skeletal muscle is a gap junction-type channel. Science. 1988;242:99–102. doi: 10.1126/science.2459777. [DOI] [PubMed] [Google Scholar]
- McDonough SI, Cseresnyes Z, Schneider MF. Origin sites of calcium release and calcium oscillations in frog sympathetic neurons. J Neurosci. 2000;20:9059–9070. doi: 10.1523/JNEUROSCI.20-24-09059.2000. [DOI] [PMC free article] [PubMed] [Google Scholar]
- Marcus R, Peritz E, Gabriel KR. On closed testing procedures with special reference to ordered analysis of variance. Biometrika. 1976;63:655–660. [Google Scholar]
- Murayama T, Kurebayashi N, Ogawa Y. Role of Mg2+ in Ca2+-induced Ca2+ release through ryanodine receptors of frog skeletal muscle: modulations by adenine nucleotides and caffeine. Biophys J. 2000;78:1810–1824. doi: 10.1016/S0006-3495(00)76731-2. [DOI] [PMC free article] [PubMed] [Google Scholar]
- Nagasaki K, Kasai M. Fast release of calcium from sarcoplasmic reticulum vesicles monitored by chlortetracycline fluorescence. J Biochem. 1983;94:1101–1109. doi: 10.1093/oxfordjournals.jbchem.a134453. [DOI] [PubMed] [Google Scholar]
- Neher E. Concentration profiles of intracellular Ca2+ in the presence of diffusible chelator. In: Heinemann U, Klee M, Neher E, Singer W, editors. Calcium Electrogenesis and Neuronal Functioning. Berlin: Springer; 1986. pp. 80–96. [Google Scholar]
- Neher E, Augustine GJ. Calcium gradients and buffers in bovine chromaffin cells. J Physiol. 1992;450:273–301. doi: 10.1113/jphysiol.1992.sp019127. [DOI] [PMC free article] [PubMed] [Google Scholar]
- Pape PC, Jong DS, Chandler WK. Effects of partial sarcoplasmic reticulum calcium depletion on calcium release in frog cut muscle fibers equilibrated with 20 mM EGTA. J Gen Physiol. 1998;112:263–295. doi: 10.1085/jgp.112.3.263. [DOI] [PMC free article] [PubMed] [Google Scholar]
- Pivovarova NB, Hongpaisan J, Andrews SB, Friel DD. Depolarization-induced mitochondrial Ca accumulation in sympathetic neurons: spatial and temporal characteristics. J Neurosci. 1999;19:6372–6384. doi: 10.1523/JNEUROSCI.19-15-06372.1999. [DOI] [PMC free article] [PubMed] [Google Scholar]
- Pizarro G, Shirokova N, Tsugorka A, Rios E. Quantal’ calcium release operated by membrane voltage in frog skeletal muscle. J Physiol. 1997;501:289–303. doi: 10.1111/j.1469-7793.1997.289bn.x. [DOI] [PMC free article] [PubMed] [Google Scholar]
- Rizzuto R, Brini M, Murgia M, Pozzan T. Microdomains with high Ca2+ close to IP3-sensitive channels that are sensed by neighboring mitochondria. Science. 1993;262:744–747. doi: 10.1126/science.8235595. [DOI] [PubMed] [Google Scholar]
- Rodney GG, Schneider MF. Calmodulin modulates initiation but not termination of spontaneous Ca2+ sparks in frog skeletal muscle. Biophys J. 2003;85:921–932. doi: 10.1016/S0006-3495(03)74531-7. [DOI] [PMC free article] [PubMed] [Google Scholar]
- Rodney GG, Williams BY, Strasburg GM, Beckingham K, Hamilton SL. Regulation of RYR1 activity by Ca2+ and calmodulin. Biochemistry. 2000;39:7807–7812. doi: 10.1021/bi0005660. [DOI] [PubMed] [Google Scholar]
- Schiefer A, Meissner G, Isenberg G. Ca2+ activation and Ca2+ inactivation of canine reconstituted cardiac sarcoplasmic reticulum Ca2+-release channels. J Physiol. 1995;489:337–348. doi: 10.1113/jphysiol.1995.sp021055. [DOI] [PMC free article] [PubMed] [Google Scholar]
- Schneider MF, Simon BJ. Inactivation of calcium release from the sarcoplasmic reticulum in frog skeletal muscle. J Physiol. 1988;405:727–745. doi: 10.1113/jphysiol.1988.sp017358. [DOI] [PMC free article] [PubMed] [Google Scholar]
- Serysheva II, Schatz M, van Heel M, Chiu W, Hamilton SL. Structure of the skeletal muscle calcium release channel activated with Ca2+ and AMP-PCP. Biophys J. 1999;77:1936–1944. doi: 10.1016/S0006-3495(99)77035-9. [DOI] [PMC free article] [PubMed] [Google Scholar]
- Sham JS, Song LS, Chen Y, Deng LH, Stern MD, Lakatta EG, Cheng H. Termination of Ca2+ release by a local inactivation of ryanodine receptors in cardiac myocytes. Proc Natl Acad Sci U S A. 1998;95:15096–15101. doi: 10.1073/pnas.95.25.15096. [DOI] [PMC free article] [PubMed] [Google Scholar]
- Simon BJ, Klein MG, Schneider MF. Calcium dependence of inactivation of calcium release from the sarcoplasmic reticulum in skeletal muscle fibers. J Gen Physiol. 1991;97:437–471. doi: 10.1085/jgp.97.3.437. [DOI] [PMC free article] [PubMed] [Google Scholar]
- Song LS, Sham JS, Stern MD, Lakatta EG, Cheng H. Direct measurement of SR release flux by tracking ‘Ca2+ spikes’ in rat cardiac myocytes. J Physiol. 1998;512:677–691. doi: 10.1111/j.1469-7793.1998.677bd.x. [DOI] [PMC free article] [PubMed] [Google Scholar]
- Stern MD, Song LS, Cheng H, Sham JS, Yang HT, Boheler KR, Rios E. Local control models of cardiac excitation-contraction coupling. A possible role for allosteric interactions between ryanodine receptors. J Gen Physiol. 1999;113:469–489. doi: 10.1085/jgp.113.3.469. [DOI] [PMC free article] [PubMed] [Google Scholar]
- Wang SQ, Song LS, Lakatta EG, Cheng H. Ca2+ signalling between single L-type Ca2+ channels and ryanodine receptors in heart cells. Nature. 2001;410:592–596. doi: 10.1038/35069083. [DOI] [PubMed] [Google Scholar]
- Watanabe H, Burnstock G. Junctional subsurface organs in frog sympathetic ganglion cells. J Neurocytol. 1976;5:125–136. doi: 10.1007/BF01176186. [DOI] [PubMed] [Google Scholar]