Abstract
Phosphorylation of inositol 1,4,5-trisphosphate receptors (InsP3R) by PKA represents an important, common route for regulation of Ca2+ release. Following phosphorylation of the S2 splice variant of InsP3R-1 (S2– InsP-1), Ca2+ release is markedly potentiated. In this study we utilize the plasma membrane (PM) expression of InsP3R-1 and phosphorylation state mutant InsP3R-1 to study how this regulation occurs at the single InsP3R-1 channel level. DT40-3KO cells stably expressing rat S2– InsP3R-1 were generated and studied in the whole-cell mode of the patch clamp technique. At hyperpolarized holding potentials, small numbers of unitary currents (average ∼1.7 per cell) were observed which were dependent on InsP3 and the presence of functional InsP3R-1, and regulated by both cytoplasmic Ca2+ and ATP. Raising cAMP markedly enhanced the open probability (Po) of the InsP3R-1 and induced bursting activity, characterized by extended periods of rapid channel openings and subsequent prolonged refractory periods. The activity, as measured by the Po of the channel, of a non-phosphorylatable InsP3R-1 construct (Ser1589Ala/Ser1755Ala InsP3R-1) was markedly less than wild-type (WT) InsP3R-1 and right shifted some ∼15-fold when the concentration dependency was compared to a phosphomimetic construct (Ser1589Glu/Ser1755Glu InsP3R-1). No change in conductance of the channel was observed. This shift in apparent InsP3 sensitivity occurred without a change in InsP3 binding or Ca2+ dependency of activation or inactivation. Biophysical analysis indicated that channel activity can be described by three states: an open state, a long lived closed state which manifests itself as long interburst intervals, and a short-lived closed state. Bursting activity occurs as the channel shuttles rapidly between the open and short-lived closed state. The predominant effect of InsP3R-1 phosphorylation is to increase the likelihood of extended bursting activity and thus markedly augment Ca2+ release. These analyses provide insight into the mechanism responsible for augmenting InsP3R-1 channel activity following phosphorylation and moreover should be generally useful for further detailed investigation of the biophysical properties of InsP3R.
Three inositol 1,4,5-trisphosphate receptor (InsP3R) genes code for distinct Ca2+ release channels of molecular mass ∼300 kDa, named InsP3R-1, InsP3R-2 and InsP3R-3 (Furuichi et al. 1989; Sudhof et al. 1991; Maranto, 1994). Additional diversity is generated by alternative splicing of the InsP3R-1 and InsP3R-2 genes (Danoff et al. 1991; Iwai et al. 2005). InsP3R-1 is the founding member of the family and was purified from cerebellum based on the abundance of the protein in this tissue (Supattapone et al. 1988b). In addition to the high relative expression level in cerebellum, this tissue is perhaps unique given that the InsP3R-1 gene is expressed essentially in isolation in the Purkinje cells, whereas in other tissues the expression of multiple InsP3R types is the norm (Nakagawa et al. 1991; Wojcikiewicz, 1995; Taylor et al. 1999). The basic structural, biochemical and biophysical properties have also been defined largely based on the template of the InsP3R-1 (reviewed in Foskett et al. 2007). For example, the domain structure of the receptors has been established in a linear array of ∼2700 amino acids as consisting of three general regions (Patel et al. 1999). Two major domains of high sequence homology between InsP3R types exist: the binding site for InsP3 in the N-terminus (Yoshikawa et al. 1996), and a region in the C-terminus which constitutes the ion-conducting pore and determinants of tetramer formation (Galvan et al. 1999; Ramos-Franco et al. 1999; Joseph et al. 2000; Parker et al. 2004). The third domain, consisting of the intervening sequence, has been termed the ‘regulatory and coupling domain’ or ‘modulatory’ domain and is considerably more variable among InsP3R types. Regulation of Ca2+ release by factors such as Ca2+, ATP, phosphorylation and interaction with protein binding partners occurs principally in this region (Berridge, 1993; Bezprozvanny & Ehrlich, 1993; Wojcikiewicz & Luo, 1998; Patel et al. 1999; Tang et al. 2003; Wagner et al. 2003, 2004; Bezprozvanny, 2005).
One of the earliest forms of InsP3R-1 regulation described was via phosphoregulation by protein kinase A (Supattapone et al. 1988a; Danoff et al. 1991). Indeed the protein was described as a phospho-protein prior to its identification as an intracellular Ca2+ release channel (Walaas et al. 1983, 1986). Phosphorylation of InsP3R by PKA serves as an important locus for cross-talk between two predominant, ubiquitous signal transduction pathways and has been suggested to play roles in such diverse Ca2+ regulated events as neural adaptation, epithelial cell fluid secretion and modulation of insulin secretion (Bruce et al. 2002, 2003; Tang et al. 2003; Chaloux et al. 2007). PKA activation results in stoichiometric phosphorylation of only two serine residues present in ideal predicted consensus motifs (RRXS) at Ser1589 and Ser 1755 in S2– InsP3R-1 (Danoff et al. 1991; Soulsby et al. 2004). A series of studies from our laboratory have shown by measurement of [Ca2+]i using fluorescent indicators that phosphorylation per se, or mimicking phosphorylation by introducing charge mutations at either residue, results in markedly enhanced InsP3-induced Ca2+ release through S2– InsP3R-1 (Wagner et al. 2003, 2004).
While these studies have unequivocally established which residues are functionally relevant for enhancing Ca2+ release through the InsP3R-1, [Ca2+]i measurements using fluorescent dyes as the functional readout are rather indirect and consequently provide limited mechanistic information regarding effects of phosphorylation on channel gating at the single InsP3R level. Indeed, in general, despite the important insight into InsP3R function provided by both biochemical studies and measurement of Ca2+ release, characterization of the electrophysiological and biophysical properties of the channel have lagged significantly. Until recently, the majority of studies of InsP3R function have been conducted following incorporation of InsP3R into planar lipid bilayers (Bezprozvanny et al. 1991; Bezprozvanny & Ehrlich, 1993; Ramos-Franco et al. 1998a,b). A general caution which complicates interpretation of bilayer data is that this preparation is likely to be missing regulatory input from the lipid environment as well as from protein binding partners and thus may not faithfully reflect the channel in its native environment.
Largely circumventing this issue, significant progress has been made by Foskett and colleagues studying InsP3R in the outer membrane leaflet of isolated nuclei using an ‘on nucleus’ configuration of the patch-clamp technique. This technique has yielded fundamental biophysical information regarding the gating and regulation of endogenous InsP3R in native membranes (Mak & Foskett, 1994, 1997; Stehno-Bittel et al. 1995; Mak et al. 1999, 2000, 2001, 2003; Boehning & Joseph, 2000; Boehning et al. 2001). A caveat which applies to both isolated nuclei and bilayer studies is that modulation from any endogenous cytosolic or PM input is necessarily absent and hence study of the regulation by endogenous signalling pathways is not generally possible.
Recently, a further methodological advance has been reported with the potential to significantly further our understanding of the electrophysiological and biophysical properties of InsP3R. Surprisingly, it has been reported that a small number of InsP3Rs are resident in the PM of the chicken pre-B-lymphocyte cell line DT40. The limited PM expression permits the measurement of single InsP3R channel activity using the whole-cell mode of the patch-clamp technique (Dellis et al. 2006). Whether endogenously expressed in the wild-type DT40 cell, or stably expressed in a variant of the cell line where the native chicken receptors are ablated (DT40-3KO), one to four InsP3Rs are reliably present in the PM (Dellis et al. 2008). A particular utility of this system is the ability to express InsP3R and mutant constructs such that structure–function studies can be performed on an unambiguously InsP3R null background. In this system, the PM resident InsP3Rs are reported to be orientated such that the N and C termini retain their normal orientation in the cytoplasm and presumably are regulated in a relatively normal manner by cellular factors. This important attribute is, however, still to be established. The lipid environment of the receptor is also likely to be largely similar to the resident ER protein, although cholesterol and phospholipid levels may be somewhat greater in the PM than ER (Lange et al. 1999). Regulation by ER luminal factors will, however, clearly be absent. Important differences in activity may therefore be related to regulation by bath (luminal) Ca2+ and the absence of luminal accessory proteins such as the redox sensor ERp44 and chromagranin (Thrower et al. 2002; Higo et al. 2005). While the route of trafficking to the PM and the generality of this expression are at present unclear, the localization could provide an unprecedented opportunity to further define the key properties of InsP3Rs at the electrophysiological level.
Historically, there have been several studies describing PM resident InsP3R (Kuno & Gardner, 1987; Fadool & Ache, 1992; Vaca & Kunze, 1995; Tanimura et al. 2000; Kaur et al. 2001; Vazquez et al. 2002). It should be noted, however, that some of these reports have relied on characterization by indirect techniques and have subsequently not been substantiated. Thus, initially in this study we felt it imperative to validate the utility of this potentially important technique following stable expression of mammalian InsP3R-1 constructs in DT40-3KO cells. We initially confirm that channel activity is InsP3R-1 dependent and that the activity has characteristics shared with the receptor in its more conventional intracellular environment. The major focus of this work was then to investigate the modulation and regulation of gating of the InsP3R-1 at the single channel level by PKA. Importantly, we demonstrate that PKA phosphorylation of S2– InsP3R-1 increases the open probability of the InsP3R-1 when the endogenous adenylate cyclase/PKA signalling pathway is activated by forskolin. By comparing the gating characteristics of non-phosphorylatable (S-A) mutations with phosphomimetic (S-E) mutations in the defined PKA phosphorylation sites, we show that PKA phosphorylation results in an increase in Po of the InsP3R-1. The increase in Po primarily occurs by destabilizing a long lived closed state of the channel to facilitate bursting activity. This appears to take place by increasing the apparent affinity of the InsP3R-1 for InsP3 in the absence of marked effects of InsP3 binding or modulation by cytosolic Ca2+.
Methods
Electrophysiology
K+ was utilized as the charge carrier in all experiments. In the majority of experiments intracellular free Ca2+ was clamped to favour activation of InsP3R-1 unless otherwise stated (bath: 140 mm KCl, 10 mm Hepes, 500 μm BAPTA, free Ca2+ 250 nm, pH 7.1; pipette: 140 KCl, 10 mm Hepes, 100 μm BAPTA, 0.5 mm ATP, 200 nm free Ca2+, pH 7.1). Pipette [Ca2+] was calculated using MAXCHELATOR and verified by fluorimetry. The ATP was in the form of Na-ATP except in the in vivo phosphorylation experiments where Mg-ATP was included. Borosilicate glass pipettes were pulled and fire polished to resistances of about 20 MΩ. Following establishment of stable high resistance seals, the membrane patches were ruptured to form the whole-cell configuration with resistances > 5 GΩ and capacitances > 8 pF. The holding potential was set to −100 mV during the recording, except where noted, and currents were recorded under voltage clamp conditions using an Axopatch 200B amplifier and pCLAMP 9. Channel recordings were digitized at 20 kHz and filtered at 5 kHz with a −3 dB, 4-pole Bessel filter. Activity was typically evident 3–5 min after establishing the whole cell configuration at 1 μm InsP3, but occurred essentially immediately following breakthrough with 100 μm InsP3 in the pipette. In a similar fashion, channel activity occurred immediately when the pipette solution contained the high affinity InsP3R agonist, adenophostin A (ADO) (Adkins et al. 2000). A gravity fed multibarrelled glass perfusion pipette was used for local bath exchange during forskolin experiments.
Analyses were performed using the event detection protocol in Clampfit 9. Channel openings were detected by half-threshold crossing criteria. We assumed that the number of channels in any particular cell is represented by the maximum number of discrete stacked events observed during the experiment. All-points current amplitude histograms were generated from the current records and fitted with a normal Gaussian probability distribution function. The coefficient of determination (R2) for every fit was > 0.95. The Po was calculated using the multimodal distribution for the open and closed current levels. The effects on Po of phosphorylation were calculated following 2 min of exposure to forskolin. Channel dwell time constants for the open and closed states were determined from exponential fits of all-points histograms of open and closed times from records appearing to contain one channel. The threshold for an open event was set at 50% of the maximum open current and events shorter than 0.1 ms were ignored. Closed times were only calculated for cells that contained one channel. A ‘burst’ was defined as a period of channel opening following a period of no channel activity which was greater than five times the mean closed time within a burst. The slope conductances were determined from the linear fits of the current–voltage relationships where g = Ik/(V−Vk). Equation parameters were estimated using a nonlinear, least squares algorithm. Two tailed heteroscedastic t tests with P-values < 0.05 were considered to have statistical significance. Ca2+ dependency curves were fitted separately for activation and inhibition with the logistic equation:
Where A1 is the minimal value, A2 is the maximal value, X is the concentration of Ca2+, X0 is the half-maximal concentration and p is the slope related to the Hill coefficient.
Stable expression in DT40-3KO cells
Cell lines were created which stably express either wild-type (WT) S2– InsP3R-1, a non-phosphorylatable construct in which the PKA phosphorylation sites at serine 1589 and serine 1755 were mutated to alanine (S2– InsP3R-1S1589A/A1755A; henceforth termed ‘AA’) and a phosphomimetic construct in which these PKA phosphorylation sites were mutated to glutamate residues (S2– InsP3R-1S1589E/S1755E; termed ‘EE’). As previously described (Wagner et al. 2006), NruI digested plasmids were introduced into DT40 cells lacking expression of all InsP3R types (DT40-3K0 cells) by nucleofection using programme B23 and solution T as per the manufacturer's instructions (Amaxa, Inc., Gaithersburg, MD, USA). After nucleofection, the cells were incubated in growth media for 24 h prior to dilution in selection media containing 2 mg ml−1 geneticin (Invitrogen, Inc.). Cells were then seeded into 96-well tissue culture plates at approximately 1000 cells per well and incubated in selection media for at least 7 days. Wells exhibiting growth after the selection period were picked for expansion.
Binding assays
COS-7 cells were harvested by trypsinization, centrifuged at 150 g for 1 min and resuspended in HRB-HEDTA buffer containing 120 mm KCl, 20 mm Tris–Hepes (pH 7.2), 2 mm HEDTA and 1 mm PMSF, and permeabilized with saponin (10 μg mg−1 protein). A 0.8 ml aliquot of the permeabilized cells was incubated with 0.8 ml of a label mix containing 120 mm KCl, 20 mm Tris–Hepes (pH 7.2), 10 nm[3H]IP3 and different concentrations of unlabelled IP3. After incubation on ice for 5 min, triplicate 0.5 ml samples were vacuum-filtered through A/E glass-fibre filters (Gelman Science, Ann Arbor, MI, USA), and the filters were washed with buffer containing 10 ml of 50 mm Tris-HCl (pH 7.8), 1 mm EDTA and 1 mg ml−1 bovine serum albumin. The filters were counted in Budget Solve (RPI, Mt Prospect, IL, USA) scintillation fluid. In order to normalize the binding measurements for variation in the expression of IP3R constructs we always carried out transfections with WT InsP3R-1 in parallel as a reference control. The expression of each of the constructs relative to the wild-type IP3R was quantified densitometrically from immunoblots and used to calculate a factor (R) for the ratio of expression of the mutant relative to WT receptors. Normalized binding was obtained by dividing the binding values for each mutant by R. Control values are the mean ±s.e.m. of three independent experiments.
Results
Verification of InsP3R-1 activity in DT40 cell PM
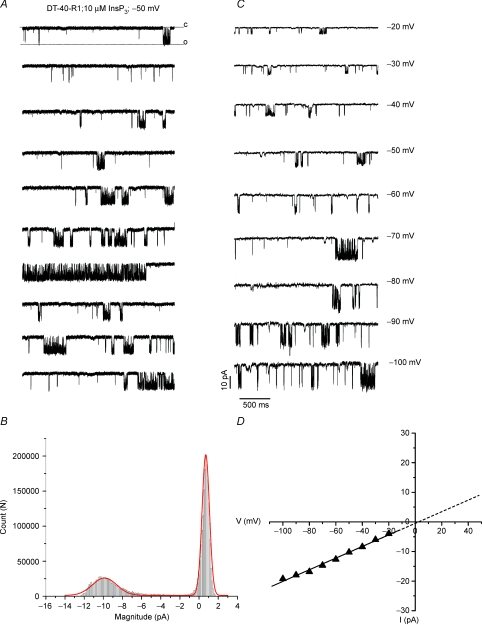
Initial experiments were performed to confirm that conditions could be established to unambiguously monitor single channel InsP3R-1 activity in the PM of DT40-3KO cells stably expressing mammalian WT S2– InsP3R-1. Unless otherwise indicated, all experiments were performed using S2– InsP3R-1 or mutants constructed on this background. Following establishment of a high resistance seal (typically > 5 GΩ), the membrane patch was ruptured and the holding potential was maintained at 0 mV. Measurements were only continued in recordings with cellular capacitance of greater than 8 pF. Under these conditions, channel activity following pulses to negative potentials was entirely InsP3R-1 dependent and was observed in > 90% of cells (see Fig. 2). In a minority of recordings, where the cellular capacitance recordings were under ∼4 pF, channel activity with a conductance of ∼190 pS was observed which was not dependent on InsP3 or InsP3R-1. The identity/localization of this channel is unknown but the low capacitance may reflect unmasking of InsP3-independent channel activity following the formation of a bleb or intracellular vesicle after the attempt to achieve the whole cell configuration. A representative example of channel activity recorded with 10 μm InsP3 in the patch pipette following pulses from 0 mV to −50 mV in WT DT40-3KO expressing InsP3R-1 is shown in Fig. 1. Discrete single channel openings were observed punctuated intermittently by periods of bursting activity as shown in Fig. 1A. The average Po was 0.3 ± 0.1 under these conditions. The high open probability during the bursts (Po > 0.8) suggests that this particular experiment represents a cell with a single InsP3R-1 present in the entire PM. In some cells, multiple channels were observed, but as previously reported (Dellis et al. 2006), never more than four channels were present. The average number of channels observed was 1.75 in 30 recordings of InsP3R-1. Figure 1B shows the all-points current amplitude distribution for this particular cell at −50 mV for 102 concatenated sweeps. Little evidence of rundown was observed (> 5 min of acquisition) in any of these recordings. While a marked rundown in channel activity in Xenopus or Cos 7 cell nuclear patches has been reported, the PM InsP3R-1 activity in DT40 cells appears similar to Sf9 cell nuclear patches where activity has been reported to be sustained over prolonged periods of time (Ionescu et al. 2006; Ionescu et al. 2007). The distribution illustrates a single major open state at a current amplitude of 10 pA with little evidence of obvious long lived subconductance states. Figure 1C shows representative sweeps acquired following pulses to increasing negative potentials and illustrates that as the driving force increases, the current amplitude similarly is larger. Figure 1D shows the current versus voltage (I–V) relationship for this channel generated from the peak K+ conductance at each potential in Fig. 1C. At negative potentials, the I–V relationship behaved as an ohmic conductance and thus in symmetrical 140 mm K+, the I–V relationship was linear with an extrapolated reversal potential at 0 mV (Fig. 1D). The I–V relationship revealed a calculated slope conductance of 202 ± 5 pS, a value close to that previously reported for InsP3R-1 under these conditions (Dellis et al. 2006). The I–V relationship at positive potentials could not be resolved because of the presence of a large outwardly rectifying K+ current seen even in the absence of InsP3 and in DT-40-3KO cells as shown in Supplemental Fig. 1 (Dellis et al. 2006).
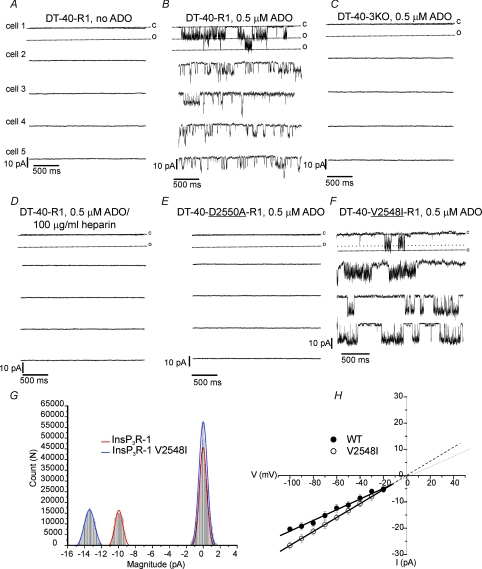
Figure 2. Verification of InsP3R-1 dependent channel activity.
A–F, single sweeps from multiple cells following a pulse to −50 mV. A, recording from WT InsP3R-1 in the absence of ADO. B, presence of ADO. C, DT40-3KO cells (InsP3R null cells). D, ADO in the presence of the InsP3R antagonist heparin. E, from a stable DT40-3KO cell line expressing S2+ splice variant D2550A InsP3R-1, a ‘pore-dead’ mutant InsP3R-1. F, from a stable DT40-3KO cell-line expressing S2+ splice variant V2548I InsP3R-1, a mutation in a residue in the putative pore of InsP3R-1 which corresponds to the residue present in ryanodine receptors. G, all-points amplitude histogram; red and blue traces are Gaussian fits of the data. H, I–V relationship for the WT and V2548I InsP3R-1.
Figure 1. Channel activity in the PM of DT40 cells expressing InsP3R-1.
A, whole cell patch clamp recording of single channel InsP3R-1 activity in an individual DT-40 cell stably expressing WT InsP3R-1 using the standard recording solutions as described in Methods. Individual 3 s sweeps at −50 mV. C = closed; O = open state. B, all-points current amplitude histogram. Activity was detected using pCLAMP's event detection paradigm. Red trace shows bimodal Gaussian fit of the data. C, individual sweeps at the indicated potential. D, I–V relationship generated from the peak current amplitudes at each potential in C; the slope conductance is ∼200 pS.
Next, experiments were performed to demonstrate that activation of InsP3R-1 is responsible for the channel activity observed. For these experiments the high affinity InsP3R agonist ADO was used because like saturating [InsP3], no delay in the initiation of activity was seen following breakthrough. This characteristic was deemed important for an accurate appreciation of mean Po for comparison in later experiments where lower levels of InsP3R-1 stimulation were tested. Each panel in Fig. 2 shows single representative sweeps from multiple cells for a particular condition in which a recording was maintained for greater than 5 min. Figure 2A demonstrates that in the absence of ADO, no activity is observed in cells stably expressing InsP3R-1 (n = 5 cells, total recorded time > 20 min). In contrast, activity was always evident under otherwise identical conditions but in the presence of ADO (Fig. 2B; n = 5). Note that in the examples shown, clear evidence of stacking events, i.e. the activity of multiple channels, was observed. These data clearly indicate the dependence on the presence of InsP3R agonist for the channel activity. In DT-40-3KO cells (in the absence of InsP3R), ADO failed to stimulate channel activity (Fig. 2C, n = 5, total recording time > 40 min). Similarly, in the presence of heparin, an InsP3R antagonist, ADO also failed to initiate channel activity (Fig. 2D; n = 5, total recording time > 20 min). Channel activity was also refractory in a cell stably expressing a mutant of S2+ InsP3R-1, which is expressed normally and binds InsP3 but which under these conditions (Ca2+ present; K+ as the charge carrier) is rendered ‘pore-dead’ by a mutation in a residue lining the putative conduction pathway (Boehning & Joseph, 2000; Boehning et al. 2001; van Rossum et al. 2004) (Fig. 2E, n = 12, total recording time > 60 min). This mutatant has been reported to conduct K+ in the absence of Ca2+ (Dellis et al. 2008). In our hands, with bath [Ca2+] reduced to < 10 nm similarly no channel activity was observed (data not shown). In total these data provide substantial evidence that functional InsP3R-1 is necessary for the channel activity seen. Although, the recording conditions are such that intracellular Ca2+ is relatively well buffered, it is formally possible that the activity observed is a consequence of InsP3-induced Ca2+ release, i.e. a Ca2+ activated conductance, rather than a direct assay of the InsP3R-1 itself. Similar activity was, however, observed when intracellular buffering was considerably more stringent as the [BAPTA] was increased to 5 mm (data not shown). Perhaps most compelling, experiments were also performed recording activity from cells stably expressing a construct which has a mutation in the ion conducting pore. This mutation results in rational and documented changes in the characteristics of the conductance. Specifically, when the valine present in the putative pore of the S2+ InsP3R-1 is mutated to isoleucine, the corresponding amino acid present in the RYR, a channel with similar selectivity but higher conductance, has been observed (Boehning et al. 2001). As predicted, expression of this construct resulted in a current of larger single channel amplitude (Fig. 2F, n = 4). The all-points amplitude for events recorded at −50 mV shows a distribution for the V2548I mutant left shifted to centre around 13.3 pA. The slope conductance generated from the I–V relationship shows an increased conductance of 266 ± 8 pS versus 202 ± 5 pS for the WT InsP3R-1 activated by ADO. Because these mutations directly modify the core biophysical properties of the InsP3R-1 in a predictable manner, they provide considerable strength to the argument that these data reflect direct measurement of the InsP3R-1 single channel activity.
Regulation of PM InsP3R-1 activity by Ca2+ and ATP
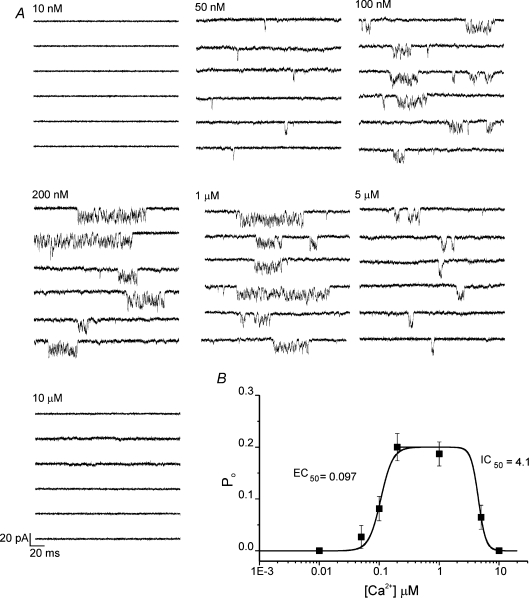
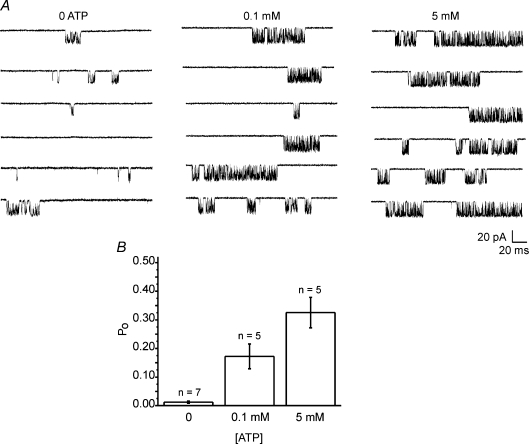
InsP3R-1 activity, whether monitored in the ER or reconstituted in bilayers, is well documented to be regulated in a predicable manner by both cytosolic Ca2+ and ATP (Iino, 1990, 1991; Bezprozvanny et al. 1991; Finch et al. 1991; Bezprozvanny & Ehrlich, 1993). To further strengthen the contention that channel activity observed in these recordings is a result of InsP3R-1 activity and importantly that the channel behaves in an appropriate fashion, preliminary experiments were performed to characterize both the Ca2+ and ATP dependence of PM channel activity. The pipette solution contained an activating concentration of ADO and the [Ca2+] as indicated. As shown in Fig. 3A and summarized in Fig. 3B, the channel activity was enhanced as the [Ca2+] was increased in the pipette solution. Under these conditions, maximal channel activity was achieved with ∼200 nm Ca2+ (EC50 for activation kact= 97 ± 15 nm). Consistent with other reports, at [Ca2+] greater than 1 μm channel activity subsequently decreased (EC50 for inhibition kinh= 4.1 ± 0.6 μm). A further characteristic mode of regulation of InsP3R-1 activity is through allosteric modulation by cytosolic ATP (Iino, 1991; Bezprozvanny & Ehrlich, 1993; Mak et al. 1999; Maes et al. 2000, 2001). Figure 4A (individual traces) and Fig. 4B (pooled data) clearly show that at 0.5 μm ADO and activating [Ca2+] (200 nm) increasing [ATP] results in an increased InsP3R-1 Po. In total, these data strongly suggest that whole-cell channel activity observed is the result of ectopically expressed mammalian InsP3R-1 localized in the PM. Importantly, key characteristics and fundamental regulatory inputs of InsP3R-1 activity are retained in this environment.
Figure 3. Cytosolic Ca2+ dependency of InsP3R-1 activity.
A, pairs of representative 500 ms sweeps recorded at −100 mV at the indicated intracellular [Ca2+] and 0.5 μm ADO. Traces are shown from 3 cells under each condition. Channel activity is absent at 10 nm Ca2+, but activity increases as the [Ca2+] is increased. Maximal open probability occurs at ∼200 nm Ca2+. At concentrations greater than 1 μm, the activity is reduced and is again absent at [Ca2+] > 5 μm. B, the Hill equation fits of the pooled data (n > 5, for each [Ca2+]).
Figure 4. Cytosolic ATP dependency of InsP3R-1 activity.
A, pairs of representative 500 ms sweeps recorded at −100 mV at the indicated intracellular [ATP]. The pipette recording solution contained 0.5 μm ADO and 200 nm Ca2+. Traces are shown from 3 cells under each condition. Channel activity is enhanced as the [ATP] is increased. B, pooled data.
Regulation of InsP3R-1 following PKA activation
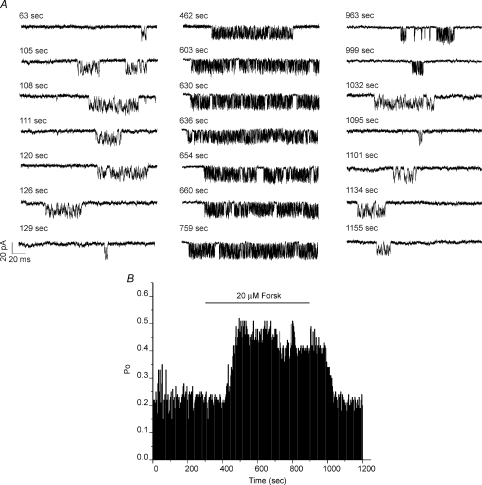
Regulation of InsP3R-1 channel activity in bilayers has been monitored following addition of catalytic subunits of PKA (Tang et al. 2003). However, because elements of the signalling cascade are absent, regulation following activation of endogenous pathways is unlikely to be observable in bilayers or in nuclear patches. The measurement of PM InsP3R-1 activity by whole cell patch clamp provides a unique opportunity to monitor the dynamic regulation of the channel following the activation of adenylate cyclase and appropriately targeted PKA. Channels were activated under whole-cell recording conditions with a pipette solution containing 0.5 μm ADO, activating [Ca2+] and [ATP] (200 nm and 0.5 mm, respectively). After establishing a stable recording, cells were exposed to 20 μm forskolin by superfusion via a pipette placed close to the patch-clamped cell. As shown in Fig. 5A (individual representative sweeps from one cell at the times indicated, typical of 5 experiments) and Fig. 5B (cumulative plot), following incubation with forskolin, the mean InsP3R-1 Po markedly increased. No channel activity was observed following forskolin exposure in DT40-3KO (absence of InsP3R). These data are consistent with the reported effects of addition of catalytic PKA subunits to S2+ InsP3R-1 incorporated in lipid bilayers (Tang et al. 2003). InsP3R-1 activity during forskolin treatment appeared to alter the predominant gating mode of the channel as activity was characterized by more extended episodes of ‘bursting activity’ during which the InsP3R-1 exhibited very high Po for extended periods of time followed by periods when channel opening was refractory. Of note, exposure to forskolin and the resultant marked increase in Po never resulted in the obvious appearance of stacking events, as evidence of additional InsP3R-1 in the PM (mean channel number ∼1.7 before and after forskolin treatment). Following washout of forskolin, the channel Po returned towards basal values.
Figure 5. Forskolin enhances InsP3R-1 channel activity.
A, representative sweeps at −100 mV from an individual cell at the indicated time points. The left panel is sweeps before forskolin application, the middle panel is sweeps during forskolin application to activate adenylate cyclase and PKA, and the right panel contains sweeps after wash-out of the forskolin. B, a diary plot of the Poversus time, demonstrating that activation of adenylate cyclase markedly enhances Poversus channel activity prior to stimulation (P = 0.0012).
Electrophysiological characterization of phosphomimetic and non-phosphorylatable InsP3R-1 constructs
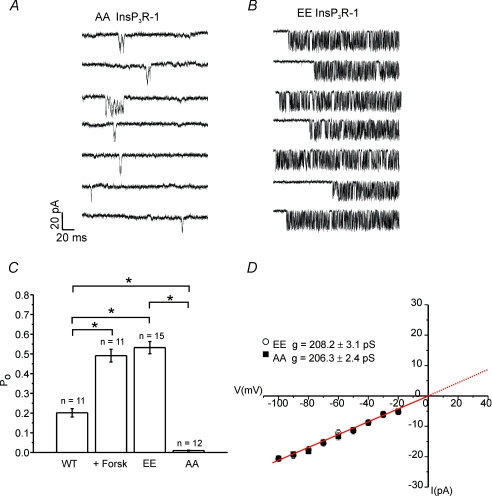
Several factors complicate the analysis of InsP3R-1 activity following PKA activation. First, phosphorylation and subsequent dephosphorylation are dynamic events and thus the observed activity cannot be considered to be at steady-state. Second, phosphorylation of individual sites could occur in a cell type specific manner as a result of targeting. Third, raising cAMP will result in phosphorylation of numerous additional substrates which could conceivably affect channel activity. Furthermore, a degree of constitutive phosphorylation may occur which may attenuate the observed effects (Wagner et al. 2006). To circumvent these issues, we next chose to study the electrophysiological characteristics of phosphorylation state mutant InsP3R-1. The rationale was that an analysis of the behaviour of these channels would provide powerful tools to glean mechanistic insight into the effects of PKA phosphorylation of InsP3R-1. We have previously documented that substitution of the serine residues in the phosphorylation sites with glutamate, presumably by virtue of the change in charge, mimics the characteristics of phosphorylation (EE InsP3R-1), while substitution with alanine at these sites renders the InsP3R-1 non-phosphorylatable (AA InsP3R-1) (Wagner et al. 2003, 2004). Figure 6 shows representative sweeps from multiple cells stably expressing either AA InsP3R-1 (Fig. 6A) or EE InsP3R-1 (Fig. 6B) and exposed to a pipette solution identical to that used in Fig. 5 (0.5 μm ADO, 200 nm Ca2+ and 0.5 mm ATP). The I–V relationships and slope conductances derived for AA and EE InsP3R-1 were indistinguishable from WT InsP3R-1 indicating that the mutation did not alter the conductance of the channel (Fig. 6D). The average number of channels observed in cells expressing these constructs was not different when compared to WT InsP3R-1, consistent with phosphorylation not increasing the absolute number of channels at the PM (1.74 for EE, 171 cells; and 1.78 for AA, 23 cells). Single channel activity in AA InsP3R-1 was characterized by sparse, brief openings resulting in a low mean Po of 0.01 ± 0.02. This low mean Po of AA InsP3R-1 compared to WT InsP3R-1 at this [ADO] is consistent with our previous interpretation that WT InsP3R-1 is likely to be, at least partially, constitutively phosphorylated under basal conditions (Wagner et al. 2006). In contrast, activation of EE InsP3R-1 resulted in a channel exhibiting a high mean Po of 0.53 ± 0.03 and extended periods of bursting activity which was comparable to the activity observed for WT InsP3R-1 exposed to forskolin (Fig. 6C). The activity of AA or EE InsP3R-1 was unaffected by treatment with forskolin (AA Po following forskolin 0.01 ± 0.01 (n = 4); EE Po following forskolin 0.44 ± 0.07 (n = 4)), presumably because, as expected, no further functionally important PKA phosphorylation sites are amenable to regulation in these construct (Wagner et al. 2003, 2004; Soulsby et al. 2004).
Figure 6. Comparison of phosphorylation state mutant InsP3R-1 constructs.
A, representative sweeps at −100 mV from individual cells expressing AA InsP3R-1, a mutant InsP3R-1 which cannot be phosphorylated by PKA. The pipette solution contained 500 nm ADO–0.5 mm ATP–200 nm Ca2+. B, representative sweeps from individual cells expressing EE InsP3R-1, a mutant InsP3R-1 which by virtue of charge largely mimics phosphorylation by PKA. Channel activity is greater in the EE InsP3R-1 versus AA InsP3R-1 and WT InsP3R-1 under identical conditions (P = 0.001 EE versus AA; P = 0.001 WT versus EE). WT InsP3R-1 exhibits significantly higher Po than AA InsP3R-1 (P = 0.001). C, pooled data; asterisks indicate statistical significance. D, the I–V relationship for AA and EE InsP3R-1. The slope conductances derived from these data show that the conductance of these constructs are very similar and not different from WT InsP3R-1 (see Fig. 1).
Phosphorylation alters the functional affinity of InsP3R-1 but does not affect binding of InsP3
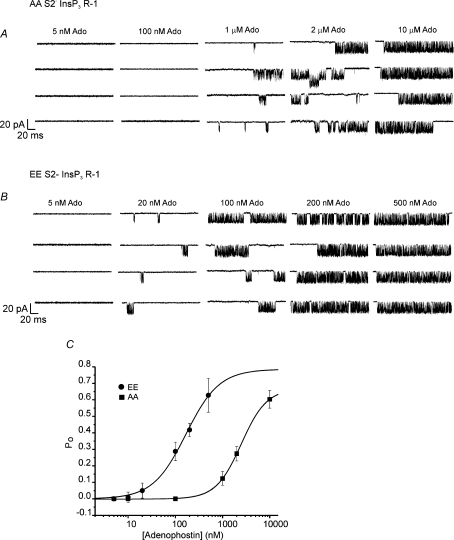
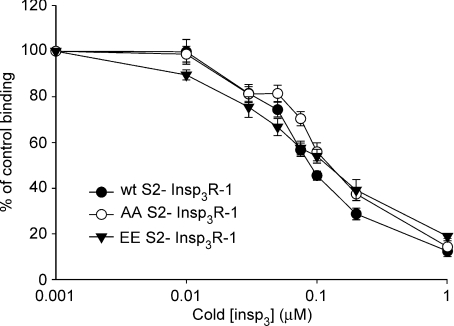
Next, channel activities of AA InsP3R-1 and EE InsP3R-1 were compared over a range of [ADO]. As shown in Fig. 7B, channel activity was readily evident at 20 nm ADO in EE InsP3R-1 and reached a maximal Po at ∼0.5 μm. AA InsP3R-1 was refractory to ADO until much higher concentrations and the maximum Po was not reached until 10 μm ADO (Fig. 7A). Indeed, the EC50 was left shifted some 15-fold from 2495 ± 52.2 nm to 168.5 ± 28.1 nm when comparing AA to EE InsP3R-1 (Fig. 7C). Of note, the maximum achievable Po was comparable for both phosphorylation state mutants and the tendency of each mutant to exhibit bursting activity increased with [ADO]. These data indicate that phosphoregulation of InsP3R-1 appears to increase the functional affinity of the receptor for InsP3. This observation could be simply explained by an increased InsP3 affinity for the PKA phosphorylated InsP3R-1. To test this idea, we performed radioligand competition assays in permeabilized Cos-7 cells transiently expressing InsP3R-1 constructs. This experimental system was chosen as a convenient screen based on high transfection efficiency, and low endogenous levels of InsP3R (Boehning et al. 2001). As shown in Fig. 8, while [3H]InsP3 binding could be readily measured for each construct although slightly lower in AA and EE, the relative affinity of the InsP3R-1 did not appear to be markedly altered when comparing WT, AA and EE InsP3R-1 (Fig. 8). Thus, an alteration in InsP3 binding per se does not appear to account for the increased apparent functional sensitivity of the InsP3R-1 following PKA phosphorylation. These data are consistent with an earlier study which reported the absence of any effect of incubation with PKA catalytic subunit on [3H]InsP3 binding to cerebellar microsomes (Supattapone et al. 1988a).
Figure 7. Functional sensitivity of phosphorylation state mutant InsP3R-1 constructs.
A, representative records from individual AA InsP3R-1 expressing cells at the indicated [ADO] and a pipette solution containing 200 nm Ca2+ and 0.5 mm ATP. B, representative sweeps under identical conditions to A in cells expressing EE InsP3R-1. C, concentration–response relationships from pooled data (n > 5 for each [ADO]). The functional sensitivity of AA InsP3R-1 is ∼15-fold lower than EE InsP3R-1.
Figure 8. Binding of InsP3 to AA and EE InsP3R-1 is equivalent.
Binding of [3H]InsP3 to permeabilized Cos 7 cells transiently expressing the indicated constructs. The affinity of EE, AA and WT InsP3R-1 are not significantly different.
Phosphorylation does not alter Ca2+ activation or deactivation of the InsP3R-1
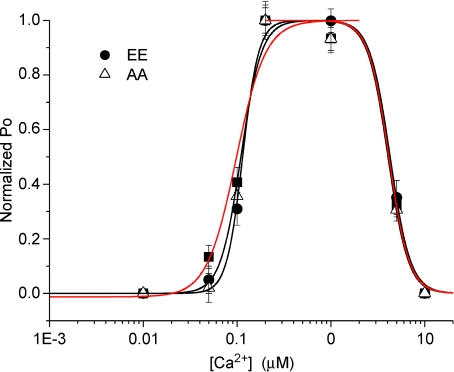
Ca2+ acts as a coagonist at the InsP3R and is undoubtedly the most important regulator of InsP3R function. In the absence of a modulatory effect of phosphorylation on InsP3 binding, we investigated if the mechanism underlying the effect of PKA phosphorylation was to alter the tuning of the InsP3R by Ca2+ to favour release. Channel activity was monitored in either AA InsP3R-1 or EE InsP3R-1 with a pipette solution containing 0.5 μm ADO, 0.5 mm ATP and Ca2+ varied between 10 nm and 10 μm. The concentration of ADO was chosen to maximally stimulate the EE construct. Because of the differing apparent affinity of InsP3 for the phosphorylated versus non-phosphorylated receptor the protocol should reveal any [InsP3]-dependent differences in activity. InsP3R-1 activity followed the characteristic biphasic relationship for both mutant constructs. Channel activity was essentially absent when pipette Ca2+ was buffered to below what is considered resting cytosolic values (∼50 nm) and increased to maximal activity between 200 nm and 1 μm. Although the absolute Po was lower in AA InsP3R-1, when the open-probability was normalized to each construct's maximum Po, essentially identical EC50 values were derived from the Hill equation fits for the Ca2+ effect on activation of InsP3R-1 activity in AA, EE and WT InsP3R-1 as shown in Fig. 9 (kact (nm) = 97 ± 15, WT; 114 ± 17, EE; and 110 ± 14, AA. Similarly, no difference was observed for the inhibition of InsP3R-1 activity (kinh (μm) = 4.1 ± 0.2, WT; 4.3 ± 0.1, EE; 4.1 ± 0.2, AA.
Figure 9. Cytosolic Ca2+ dependency of phosphorylation state mutant InsP3R-1 constructs.
Pooled data from cells expressing AA or EE InsP3R-1 at the [Ca2+] indicated and a pipette solution containing 0.5 μm ADO and 0.5 mm ATP. The Po was normalized to the maximal Po for each construct (n > 5 for each [Ca2+]). The black curves are the Hill equation fits of the AA and EE InsP3R-1 data. The red curve represents the Hill equation fit of the WT InsP3R-1 data reproduced from Fig. 3. The Ca2+ dependency for the activation or inhibition of InsP3R-1 activity was not significantly different when comparing either construct or when compared to WT InsP3R-1 (see Fig. 3).
Analysis of the gating characteristics of phosphorylated InsP3R-1
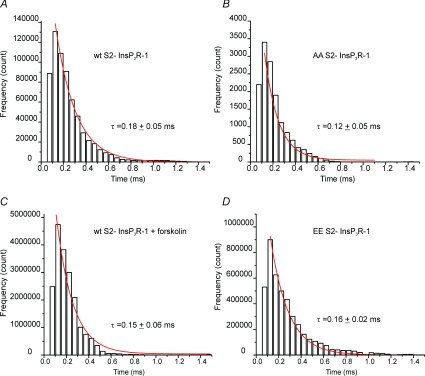
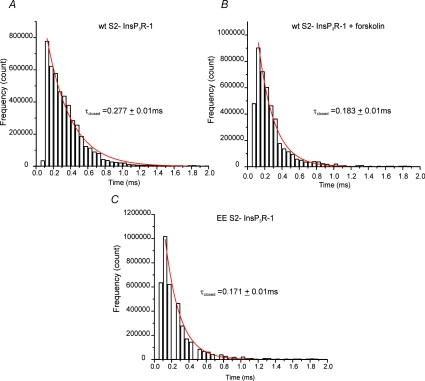
A prominent feature of the InsP3R-1 activity is the tendency of the channel to exhibit bursting activity characterized by periods of high Po followed by extended refractory periods. The biophysical basis for the increase in Po following phosphorylation was explored by analysing the open and closed time distributions from within bursts. First, the distribution of open dwell times for AA InsP3R-1, EE InsP3R-1 and WT InsP3R-1 in the presence and absence of forskolin were analysed. The distributions were well described by a single exponential fit, indicating a single predominant open state for each construct. The mean open-times for each construct/condition were very similar (WT InsP3R-1, 0.3 ± 0.04 ms; WT + forskolin, 0.3 ± 0.03 ms; EE InsP3R-1, 0.3 ± 0.03 ms; AA InsP3R-1, 0.3 ± 0.03 ms). The time constant (τ) calculated from these fits was not significantly altered either in the mutants or following treatment of WT InsP3R-1 with forskolin. These data indicate that the principal effect of phosphorylation is not to alter the transition from the open to this closed state during the bursts (Fig. 10). The distribution of closed times within a burst was analysed and was again well described by a single exponential. A detailed description of the closed time distribution for AA InsP3R-1 was not obtained because the low Po of the channel under these conditions made ascertaining the absolute number of channels present problematic. Nevertheless, within the bursts the mean closed time of AA InsP3R-1 appeared similar to WT. Analysis of the closed time distributions of the remaining InsP3R-1 constructs indicated that the τ decreased modestly, but significantly when comparing WT InsP3R-1 to receptor following treatment with forskolin or when comparing WT to the EE InsP3R-1 (Fig. 11). These data indicate that an effect of PKA phosphorylation of InsP3R-1 is the destabilization of this short-lived intraburst closed state of the channel, leading to an increase in open-probability within the burst.
Figure 10. Distribution of InsP3R-1 open dwell times during bursting activity.
The open times were plotted for the indicated constructs/conditions and the distribution was fitted with a single exponential decay, shown in red. The τ was derived from this fit. A, WT InsP3R-1. B, AA InsP3R-1. C, WT InsP3R-1 following addition of forskolin. D, EE InsP3R-1. The τ derived under these various conditions was unaltered.
Figure 11. Distribution of InsP3R-1 closed dwell times during bursting activity.
The closed times were plotted for the indicated constructs/conditions and the distribution was fitted with a single exponential decay, shown in red. The τ was derived from this fit. A, WT InsP3R-1. B, WT InsP3R-1 following addition of forskolin. C, EE InsP3R-1. Phosphorylation significantly shortened the τ, thus favouring channel opening.
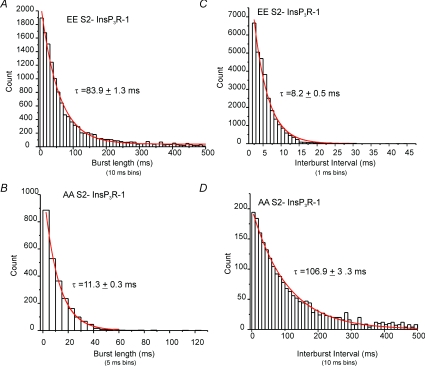
The presence of long interburst intervals indicates that the channel also appears to reside in additional much longer-lived closed state(s). We next examined the bursting behaviour of AA and EE InsP3R-1 by analysing 35 min of concatenated traces for each construct. The initiation of a burst was defined as a period, prior to activity, of at least 5 times the mean closed time within a burst for each individual construct and consisting of at least two openings. Conversely, the termination of a burst was characterized by a further period of closed time equal to, or greater than, 5 times the mean closed time in a burst. The mean WT closed time was used to define the minimal interburst interval for AA InsP3R-1 (mean closed times: WT InsP3R-1, 0.6 ± 0.03 ms; EE InsP3R-1, 0.4 ± 0.03 ms). The distribution of burst lengths for both constructs was well described by a single exponential. The τ for EE was significantly longer than for AA (Fig. 12A and B, EE and AA, respectively) indicating that phosphorylation markedly decreases the rate of transition into the longer-lived closed state. Analysis performed on WT InsP3R-1 before and during forskolin treatment showed a similar increase in τ from 19.3 ± 0.9 to 97.6 ± 3.4 ms following PKA phosphorylation. Examination of the distribution of the interburst intervals also revealed a dramatic decrease in the τ for EE InsP3R-1 when compared to AA InsP3R-1 (Fig. 12C and D, EE and AA, respectively). This observation would therefore suggest that, in addition to decreasing the rate of transition into a long-lived closed state, phosphorylation of the channel markedly accelerates the transition out of the long-lived closed state prior to bursting. A similar decrease in τ was observed when comparing the distribution of interburst intervals for WT InsP3R-1 following forskolin treatment (τ= 63.8 ± 2.1 versus 6.7 ± 1.7 ms, WT InsP3R-1 and forskolin treated, respectively), consistent with the idea that the phosphomimetic constructs are an appropriate surrogate for studying native phosphoregulation.
Figure 12. Distribution of InsP3R-1 burst lengths and interburst intervals.
Bursting activity was defined as described in Methods. A, the distribution and fit for this distribution of burst length duration for EE InsP3R-1. B, a similar analysis for AA InsP3R-1. The τ derived from these data indicates that phosphorylation decreases the rate of transition from an open-state to a long lived closed state. C, the distribution and fit of the duration of interburst intervals for EE InsP3R-1. D, a similar analysis of AA InsP3R-1 interburst intervals. The τ derived from these data indicates that phosphorylation further favours bursting activity by destabilizing a long lived closed state favouring channel opening.
Discussion
The ability to express InsP3R constructs and mutants on an unambiguously null background and study their single channel characteristics is a powerful tool with the potential to provide considerable insight into structure–function relationships and the regulation of InsP3R in a native lipid environment. As a pivotal first step in this study, we have provided strong evidence that unitary PM InsP3R-1 activity can be readily measured using whole cell patch clamp of DT4O cells. These experiments essentially verify and further expand on the initial characterization by Taylor and colleagues, who proposed a role for the PM localized InsP3R in mediating stimulated Ca2+ influx in lymphocytes (Dellis et al. 2006). The primary evidence presented here includes the observations that under appropriate conditions, channel activity was absolutely dependent on the presence of functional InsP3R-1 and of an InsP3R agonist. Moreover, mutation of the InsP3R-1 pore also resulted in rational, predictable changes in the channel's conductance. In a similar vein, the absence of the enhancing effect of forskolin in InsP3R-1 constructs with mutations in the PKA phosphorylation sites adds further weight to the contention that InsP3R-1 is responsible for the conductance observed. Importantly, the PM InsP3R-1 was also shown to be regulated by Ca2+ and ATP in a similar fashion to the receptor expressed in its conventional ER environment (Taylor & Laude, 2002; Bezprozvanny, 2005; Foskett et al. 2007).
The major goal of the study was to use these methodologies to study the effects of PKA phosphorylation on InsP3R-1 channel gating. Specifically, we monitored activity following activation of adenylate cyclase or by using InsP3R-1 constructs which have been engineered to be either PKA non-phosphorylatable or mimic phosphorylation (Wagner et al. 2003, 2004). These complimentary protocols clearly illustrate the power of the experimental system. In the former experiments, the measurement of PM InsP3R-1 activity in the whole cell mode of the patch clamp technique allows the activation of endogenous PM signalling pathways resulting in PKA activation. The latter experiments, however, presented here, unambiguously reflect the direct effect of phosphorylation on the intrinsic channel properties. These effects would be predicted to be largely independent of phosphorylation of other PKA substrates or cell-type specific events such as targeting (Tu et al. 2004).
Formally, the augmentation of the cytoplasmic Ca2+ signal observed following PKA activation (Wagner et al. 2003, 2004) could occur either by increased Ca2+ flux through individual receptors as a result of a larger single channel conductance (iCa) and/or increased Po, or additionally by insertion/activation of previously silent channels. Under conditions when the channel could be considered phosphorylated (either following forskolin treatment or comparing AA to EE InsP3R-1) the studies presented here reveal a marked increase in InsP3R-1 Po. No change in channel conductance or obvious recruitment of additional PM channels was observed. Specifically, phosphoregulation of the channel leads to a change in the principle InsP3R-1 gating mode such that the increase in Po occurs because the channel gates in ‘bursts’. Bursting activity was characterized by periods when the channel rapidly transitions from open to the closed state followed by pronounced refractory periods. So-called ‘modal gating’ is also a characteristic of L-type voltage gated Ca2+ channels (Hess et al. 1984; Tsien et al. 1986; Yue et al. 1990) and phosphorylation by PKA or modulation by dihydropyridine agonists is reported to initiate a ‘mode switch’. This is proposed to occur by reversibly stabilizing a particular conformation of the channel, thus favouring particular gating characteristics (Tsien et al. 1986; Yue et al. 1990). This mode of gating is also reminiscent of the predominant activity described at optimal Ca2+ and saturating [InsP3] in a recent publication describing modal gating behaviour of nuclear Sf9 cell InsP3R (Ionescu et al. 2007) and is consistent with behaviour in the present study of the non-phosphorylated channel at higher [InsP3R agonist] (e.g. Fig. 7). Ionescu et al. (2007) have proposed that the InsP3R gates in three predominant modes: a low activity mode, a fast kinetic mode and a burst mode exhibiting high Po. They suggest that because InsP3 does not significantly alter the Po of the channel in any particular mode, the principal effect of InsP3 is to influence the amount of time the channel resides in a particular mode. Thus, as [InsP3] increases, the likelihood that the channel is in the burst mode is higher and in low activity mode is lower. Because specialized algorithms were used to identify these gating modes and the recording conditions were different, we cannot unequivocally establish that our data are consistent with the presence of three distinct modes of channel activity and therefore consistent with this model. Nevertheless, at least superficially, PKA-induced phosphorylation of InsP3R-1 appears to adhere to this paradigm, whereby the channel is exhibiting extended bursting characteristics typical of higher [InsP3]. Kinetic analysis of the length of bursts and burst intervals, together with gating within the burst, reveals the biophysical basis for the mechanism underlying the effects of PKA phosphoregulation. The major effects of phosphorylation are to dramatically destabilize a long-lived closed state. To a lesser extent, phosphorylation also destabilizes a short-lived closed state and both events contribute to bursting activity ultimately resulting in enhanced Ca2+ release.
The increased Po and bursting activity of the phosphorylated InsP3R-1 are consistent with a shift in the functional affinity for InsP3. No change in binding of InsP3per se was detected and thus phosphorylation does not directly affect the affinity of InsP3 for its ligand. Many current models for the action of InsP3 on InsP3R propose that binding ultimately gates the channel by shifting the Ca2+ sensitivity of the receptor. The current models for the action of Ca2+ essentially state that there are two binding sites for Ca2+, one inhibitory and a second which stimulates InsP3R activity (Mak et al. 2001, 2003; Taylor & Laude, 2002). InsP3 binding to InsP3R then modulates the Ca2+ affinity of one or both of these sites such that channel opening and Ca2+ release is initially favoured. Because InsP3 alters the affinity for Ca2+ and thereby its ability to reduce InsP3R Po, without altering the affinity for the stimulatory effect, Foskett and colleagues have proposed that the primary effect of InsP3 binding is to markedly reduce the affinity of the Ca2+ inhibitory site and thus favour activation of Ca2+ release (Mak et al. 2003; Foskett et al. 2007). On the basis of these ideas, it is somewhat surprising that the Ca2+ dependence of activation or inhibition of channel activity was essentially identical in AA and EE InsP3R-1. These data suggests it is unlikely that PKA phosphorylation shifts the functional InsP3 dependence in this manner. The question is then, how can phosphorylation lead to an increase in InsP3R-1 Po? PKA- induced phosphorylation (or phosphomimetic mutation) is thought to alter protein function as the net negative charge imparted by the addition of the phosphate group to the phosphoacceptor residue neutralizes the positive charge of an upstream basic arginine or lysine residue. This change in electrostatic character or hydrophobicity of this region of the protein could have numerous potential effects to influence InsP3R-1 function. For example, a relatively direct effect might include a charge-induced conformational change, facilitating or stabilizing an intra-domain interaction which ultimately favours a bursting mode of channel gating similar to the mode-switching which occurs with L-type Ca2+ channels (Hess et al. 1984). A change in conformation or charge could conceivably also have less direct effects to alter the interactions with soluble cytosolic binding partners, such as adenine nucleotides or the large number of protein binding partners which modulate InsP3R-1 activity. Indeed, although unlikely to explain the current data, PKA phosphorylation of InsP3R-1 has been reported to alter the receptors association with calmodulin (Lin et al. 2000).
In conclusion, by analysis of InsP3R-1 localized in the PM of DT40 cells, we demonstrate that PKA phosphorylation results in markedly enhanced single channel Po without any effect on single channel conductance or the number of active channels. The increase in Po is largely accomplished by a transition to channel bursting. Moreover, the techniques used here have great potential to facilitate further mechanistic study of the regulation of InsP3R at the single channel level.
Acknowledgments
The Authors are very grateful to Ted Begenisich for the insight and helpful discussion regarding the single channel analysis. The Authors would also like to thank Dr James Sneyd and Elan Gin for discussion of the single channel analysis, Dr Trevor Shuttleworth and Matt Betzenhauser for critical reading of the manuscript and Lyndee Bilodeau for invaluable technical support. This work was supported by NIH grants DK54568 and DE14756 (D.I.Y.) and DK34804 (S.K.J.).
Supplementary material
Online supplemental material for this paper can be accessed at: http://jp.physoc.org/cgi/content/full/jphysiol.2008.152314/DC1 and http://www.blackwell-synergy.com/doi/suppl/10.1113/jphysiol.2008.152314
References
- Adkins CE, Wissing F, Potter BV, Taylor CW. Rapid activation and partial inactivation of inositol trisphosphate receptors by adenophostin A. Biochem J. 2000;352:929–933. [PMC free article] [PubMed] [Google Scholar]
- Berridge MJ. Inositol trisphosphate and calcium signalling. Nature. 1993;361:315–325. doi: 10.1038/361315a0. [DOI] [PubMed] [Google Scholar]
- Bezprozvanny I. The inositol 1,4,5-trisphosphate receptors. Cell Calcium. 2005;38:261–272. doi: 10.1016/j.ceca.2005.06.030. [DOI] [PubMed] [Google Scholar]
- Bezprozvanny I, Ehrlich BE. ATP modulates the function of inositol 1,4,5-trisphosphate-gated channels at two sites. Neuron. 1993;10:1175–1184. doi: 10.1016/0896-6273(93)90065-y. [DOI] [PubMed] [Google Scholar]
- Bezprozvanny I, Watras J, Ehrlich BE. Bell-shaped calcium-response curves of Ins(1,4,5)P3- and calcium-gated channels from endoplasmic reticulum of cerebellum. Nature. 1991;351:751–754. doi: 10.1038/351751a0. [DOI] [PubMed] [Google Scholar]
- Boehning D, Joseph SK. Functional properties of recombinant type I and type III inositol 1,4,5-trisphosphate receptor isoforms expressed in COS-7 cells. J Biol Chem. 2000;275:21492–21499. doi: 10.1074/jbc.M001724200. [DOI] [PubMed] [Google Scholar]
- Boehning D, Mak DO, Foskett JK, Joseph SK. Molecular determinants of ion permeation and selectivity in inositol 1,4,5-trisphosphate receptor Ca2+ channels. J Biol Chem. 2001;276:13509–13512. doi: 10.1074/jbc.C100094200. [DOI] [PubMed] [Google Scholar]
- Bruce JI, Shuttleworth TJ, Giovannucci DR, Yule DI. Phosphorylation of inositol 1,4,5-trisphosphate receptors in parotid acinar cells. A mechanism for the synergistic effects of cAMP on Ca2+ signaling. J Biol Chem. 2002;277:1340–1348. doi: 10.1074/jbc.M106609200. [DOI] [PubMed] [Google Scholar]
- Bruce JI, Straub SV, Yule DI. Crosstalk between cAMP and Ca2+ signaling in non-excitable cells. Cell Calcium. 2003;34:431–444. doi: 10.1016/s0143-4160(03)00150-7. [DOI] [PubMed] [Google Scholar]
- Chaloux B, Caron AZ, Guillemette G. Protein kinase A increases the binding affinity and the Ca2+ release activity of the inositol 1,4,5-trisphosphate receptor type 3 in RINm5F cells. Biol Cell. 2007;99:379–388. doi: 10.1042/BC20060121. [DOI] [PubMed] [Google Scholar]
- Danoff SK, Ferris CD, Donath C, Fischer GA, Munemitsu S, Ullrich A, Snyder SH, Ross CA. Inositol 1,4,5-trisphosphate receptors: distinct neuronal and nonneuronal forms derived by alternative splicing differ in phosphorylation. Proc Natl Acad Sci U S A. 1991;88:2951–2955. doi: 10.1073/pnas.88.7.2951. [DOI] [PMC free article] [PubMed] [Google Scholar]
- Dellis O, Dedos SG, Tovey SC, Taufiq Ur R, Dubel SJ, Taylor CW. Ca2+ entry through plasma membrane IP3 receptors. Science. 2006;313:229–233. doi: 10.1126/science.1125203. [DOI] [PubMed] [Google Scholar]
- Dellis O, Rossi AM, Dedos SG, Taylor CW. Counting functional inositol 1,4,5-trisphosphate receptors into the plasma membrane. J Biol Chem. 2008;283:751–755. doi: 10.1074/jbc.M706960200. [DOI] [PubMed] [Google Scholar]
- Fadool DA, Ache BW. Plasma membrane inositol 1,4,5-trisphosphate-activated channels mediate signal transduction in lobster olfactory receptor neurons. Neuron. 1992;9:907–918. doi: 10.1016/0896-6273(92)90243-7. [DOI] [PMC free article] [PubMed] [Google Scholar]
- Finch EA, Turner TJ, Goldin SM. Subsecond kinetics of inositol 1,4,5-trisphosphate-induced calcium release reveal rapid potentiation and subsequent inactivation by calcium. Ann N Y Acad Sci. 1991;635:400–403. doi: 10.1111/j.1749-6632.1991.tb36509.x. [DOI] [PubMed] [Google Scholar]
- Foskett JK, White C, Cheung KH, Mak DO. Inositol trisphosphate receptor Ca2+ release channels. Physiol Rev. 2007;87:593–658. doi: 10.1152/physrev.00035.2006. [DOI] [PMC free article] [PubMed] [Google Scholar]
- Furuichi T, Yoshikawa S, Miyawaki A, Wada K, Maeda N, Mikoshiba K. Primary structure and functional expression of the inositol 1,4,5-trisphosphate-binding protein P400. Nature. 1989;342:32–38. doi: 10.1038/342032a0. [DOI] [PubMed] [Google Scholar]
- Galvan DL, Borrego-Diaz E, Perez PJ, Mignery GA. Subunit oligomerization, and topology of the inositol 1,4,5-trisphosphate receptor. J Biol Chem. 1999;274:29483–29492. doi: 10.1074/jbc.274.41.29483. [DOI] [PubMed] [Google Scholar]
- Hess P, Lansman JB, Tsien RW. Different modes of Ca channel gating behaviour favoured by dihydropyridine Ca agonists and antagonists. Nature. 1984;311:538–544. doi: 10.1038/311538a0. [DOI] [PubMed] [Google Scholar]
- Higo T, Hattori M, Nakamura T, Natsume T, Michikawa T, Mikoshiba K. Subtype-specific and ER lumenal environment-dependent regulation of inositol 1,4,5-trisphosphate receptor type 1 by ERp44. Cell. 2005;120:85–98. doi: 10.1016/j.cell.2004.11.048. [DOI] [PubMed] [Google Scholar]
- Iino M. Biphasic Ca2+ dependence of inositol 1,4,5-trisphosphate-induced Ca release in smooth muscle cells of the guinea pig taenia caeci. J Gen Physiol. 1990;95:1103–1122. doi: 10.1085/jgp.95.6.1103. [DOI] [PMC free article] [PubMed] [Google Scholar]
- Iino M. Effects of adenine nucleotides on inositol 1,4,5-trisphosphate-induced calcium release in vascular smooth muscle cells. J Gen Physiol. 1991;98:681–698. doi: 10.1085/jgp.98.4.681. [DOI] [PMC free article] [PubMed] [Google Scholar]
- Ionescu L, Cheung KH, Vais H, Mak DO, White C, Foskett JK. Graded recruitment and inactivation of single InsP3 receptor Ca2+-release channels: implications for quantal Ca2+ release. J Physiol. 2006;573:645–662. doi: 10.1113/jphysiol.2006.109504. [DOI] [PMC free article] [PubMed] [Google Scholar]
- Ionescu L, White C, Cheung KH, Shuai J, Parker I, Pearson JE, Foskett JK, Mak DO. Mode switching is the major mechanism of ligand regulation of InsP3 receptor calcium release channels. J Gen Physiol. 2007;130:631–645. doi: 10.1085/jgp.200709859. [DOI] [PMC free article] [PubMed] [Google Scholar]
- Iwai M, Tateishi Y, Hattori M, Mizutani A, Nakamura T, Futatsugi A, Inoue T, Furuichi T, Michikawa T, Mikoshiba K. Molecular cloning of mouse type 2 and type 3 inositol 1,4,5-trisphosphate receptors and identification of a novel type 2 receptor splice variant. J Biol Chem. 2005;280:10305–10317. doi: 10.1074/jbc.M413824200. [DOI] [PubMed] [Google Scholar]
- Joseph SK, Bokkala S, Boehning D, Zeigler S. Factors determining the composition of inositol trisphosphate receptor hetero-oligomers expressed in COS cells. J Biol Chem. 2000;275:16084–16090. doi: 10.1074/jbc.M000506200. [DOI] [PubMed] [Google Scholar]
- Kaur R, Zhu XO, Moorhouse AJ, Barry PH. IP3-gated channels and their occurrence relative to CNG channels in the soma and dendritic knob of rat olfactory receptor neurons. J Membr Biol. 2001;181:91–105. [PubMed] [Google Scholar]
- Kuno M, Gardner P. Ion channels activated by inositol 1,4,5-trisphosphate in plasma membrane of human T-lymphocytes. Nature. 1987;326:301–304. doi: 10.1038/326301a0. [DOI] [PubMed] [Google Scholar]
- Lange Y, Ye J, Rigney M, Steck TL. Regulation of endoplasmic reticulum cholesterol by plasma membrane cholesterol. J Lipid Res. 1999;40:2264–2270. [PubMed] [Google Scholar]
- Lin C, Widjaja J, Joseph SK. The interaction of calmodulin with alternatively spliced isoforms of the type-I inositol trisphosphate receptor. J Biol Chem. 2000;275:2305–2311. doi: 10.1074/jbc.275.4.2305. [DOI] [PubMed] [Google Scholar]
- Maes K, Missiaen L, De Smet P, Vanlingen S, Callewaert G, Parys JB, De Smedt H. Differential modulation of inositol 1,4,5-trisphosphate receptor type 1 and type 3 by ATP. Cell Calcium. 2000;27:257–267. doi: 10.1054/ceca.2000.0121. [DOI] [PubMed] [Google Scholar]
- Maes K, Missiaen L, Parys JB, De Smet P, Sienaert I, Waelkens E, Callewaert G, De Smedt H. Mapping of the ATP-binding sites on inositol 1,4,5-trisphosphate receptor type 1 and type 3 homotetramers by controlled proteolysis and photoaffinity labeling. J Biol Chem. 2001;276:3492–3497. doi: 10.1074/jbc.M006082200. [DOI] [PubMed] [Google Scholar]
- Mak DO, Foskett JK. Single-channel inositol 1,4,5-trisphosphate receptor currents revealed by patch clamp of isolated Xenopus oocyte nuclei. J Biol Chem. 1994;269:29375–29378. [PubMed] [Google Scholar]
- Mak DO, Foskett JK. Single-channel kinetics, inactivation, and spatial distribution of inositol trisphosphate (IP3) receptors in Xenopus oocyte nucleus. J Gen Physiol. 1997;109:571–587. doi: 10.1085/jgp.109.5.571. [DOI] [PMC free article] [PubMed] [Google Scholar]
- Mak DO, McBride S, Foskett JK. ATP regulation of type 1 inositol 1,4,5-trisphosphate receptor channel gating by allosteric tuning of Ca2+ activation. J Biol Chem. 1999;274:22231–22237. doi: 10.1074/jbc.274.32.22231. [DOI] [PubMed] [Google Scholar]
- Mak DO, McBride S, Foskett JK. Regulation by Ca2+ and inositol 1,4,5-trisphosphate (InsP3) of single recombinant type 3 InsP3 receptor channels. Ca2+ activation uniquely distinguishes types 1 and 3 InsP3 receptors. J Gen Physiol. 2001;117:435–446. doi: 10.1085/jgp.117.5.435. [DOI] [PMC free article] [PubMed] [Google Scholar]
- Mak DO, McBride SM, Petrenko NB, Foskett JK. Novel regulation of calcium inhibition of the inositol 1,4,5-trisphosphate receptor calcium-release channel. J Gen Physiol. 2003;122:569–581. doi: 10.1085/jgp.200308808. [DOI] [PMC free article] [PubMed] [Google Scholar]
- Mak DO, McBride S, Raghuram V, Yue Y, Joseph SK, Foskett JK. Single-channel properties in endoplasmic reticulum membrane of recombinant type 3 inositol trisphosphate receptor. J Gen Physiol. 2000;115:241–256. doi: 10.1085/jgp.115.3.241. [DOI] [PMC free article] [PubMed] [Google Scholar]
- Maranto AR. Primary structure, ligand binding, and localization of the human type 3 inositol 1,4,5-trisphosphate receptor expressed in intestinal epithelium. J Biol Chem. 1994;269:1222–1230. [PubMed] [Google Scholar]
- Nakagawa T, Okano H, Furuichi T, Aruga J, Mikoshiba K. The subtypes of the mouse inositol 1,4,5-trisphosphate receptor are expressed in a tissue-specific and developmentally specific manner. Proc Natl Acad Sci U S A. 1991;88:6244–6248. doi: 10.1073/pnas.88.14.6244. [DOI] [PMC free article] [PubMed] [Google Scholar]
- Parker AK, Gergely FV, Taylor CW. Targeting of inositol 1,4,5-trisphosphate receptors to the endoplasmic reticulum by multiple signals within their transmembrane domains. J Biol Chem. 2004;279:23797–23805. doi: 10.1074/jbc.M402098200. [DOI] [PubMed] [Google Scholar]
- Patel S, Joseph SK, Thomas AP. Molecular properties of inositol 1,4,5-trisphosphate receptors. Cell Calcium. 1999;25:247–264. doi: 10.1054/ceca.1999.0021. [DOI] [PubMed] [Google Scholar]
- Ramos-Franco J, Caenepeel S, Fill M, Mignery G. Single channel function of recombinant type-1 inositol 1,4,5-trisphosphate receptor ligand binding domain splice variants. Biophys J. 1998a;75:2783–2793. doi: 10.1016/S0006-3495(98)77721-5. [DOI] [PMC free article] [PubMed] [Google Scholar]
- Ramos-Franco J, Fill M, Mignery GA. Isoform-specific function of single inositol 1,4,5-trisphosphate receptor channels. Biophys J. 1998b;75:834–839. doi: 10.1016/S0006-3495(98)77572-1. [DOI] [PMC free article] [PubMed] [Google Scholar]
- Ramos-Franco J, Galvan D, Mignery GA, Fill M. Location of the permeation pathway in the recombinant type 1 inositol 1,4,5-trisphosphate receptor. J Gen Physiol. 1999;114:243–250. doi: 10.1085/jgp.114.2.243. [DOI] [PMC free article] [PubMed] [Google Scholar]
- Soulsby MD, Alzayady K, Xu Q, Wojcikiewicz RJ. The contribution of serine residues 1588 and 1755 to phosphorylation of the type I inositol 1,4,5-trisphosphate receptor by PKA and PKG. FEBS Lett. 2004;557:181–184. doi: 10.1016/s0014-5793(03)01487-x. [DOI] [PubMed] [Google Scholar]
- Stehno-Bittel L, Luckhoff A, Clapham DE. Calcium release from the nucleus by InsP3 receptor channels. Neuron. 1995;14:163–167. doi: 10.1016/0896-6273(95)90250-3. [DOI] [PubMed] [Google Scholar]
- Sudhof TC, Newton CL, Archer BT, 3rd, Ushkaryov YA, Mignery GA. Structure of a novel InsP3 receptor. EMBO J. 1991;10:3199–3206. doi: 10.1002/j.1460-2075.1991.tb04882.x. [DOI] [PMC free article] [PubMed] [Google Scholar]
- Supattapone S, Danoff SK, Theibert A, Joseph SK, Steiner J, Snyder SH. Cyclic AMP-dependent phosphorylation of a brain inositol trisphosphate receptor decreases its release of calcium. Proc Natl Acad Sci U S A. 1988a;85:8747–8750. doi: 10.1073/pnas.85.22.8747. [DOI] [PMC free article] [PubMed] [Google Scholar]
- Supattapone S, Worley PF, Baraban JM, Snyder SH. Solubilization, purification, and characterization of an inositol trisphosphate receptor. J Biol Chem. 1988b;263:1530–1534. [PubMed] [Google Scholar]
- Tang TS, Tu H, Wang Z, Bezprozvanny I. Modulation of type 1 inositol (1,4,5)-trisphosphate receptor function by protein kinase A and protein phosphatase 1a. J Neurosci. 2003;23:403–415. doi: 10.1523/JNEUROSCI.23-02-00403.2003. [DOI] [PMC free article] [PubMed] [Google Scholar]
- Tanimura A, Tojyo Y, Turner RJ. Evidence that type I, II, and III inositol 1,4,5-trisphosphate receptors can occur as integral plasma membrane proteins. J Biol Chem. 2000;275:27488–27493. doi: 10.1074/jbc.M004495200. [DOI] [PubMed] [Google Scholar]
- Taylor CW, Genazzani AA, Morris SA. Expression of inositol trisphosphate receptors. Cell Calcium. 1999;26:237–251. doi: 10.1054/ceca.1999.0090. [DOI] [PubMed] [Google Scholar]
- Taylor CW, Laude AJ. IP3 receptors and their regulation by calmodulin and cytosolic Ca2+ Cell Calcium. 2002;32:321–334. doi: 10.1016/s0143416002001859. [DOI] [PubMed] [Google Scholar]
- Thrower EC, Park HY, So SH, Yoo SH, Ehrlich BE. Activation of the inositol 1,4,5-trisphosphate receptor by the calcium storage protein chromogranin A. J Biol Chem. 2002;277:15801–15806. doi: 10.1074/jbc.M110139200. [DOI] [PubMed] [Google Scholar]
- Tsien RW, Bean BP, Hess P, Lansman JB, Nilius B, Nowycky MC. Mechanisms of calcium channel modulation by b-adrenergic agents and dihydropyridine calcium agonists. J Mol Cellular Cardiol. 1986;18:691–710. doi: 10.1016/s0022-2828(86)80941-5. [DOI] [PubMed] [Google Scholar]
- Tu H, Tang TS, Wang Z, Bezprozvanny I. Association of type 1 inositol 1,4,5-trisphosphate receptor with AKAP9 (Yotiao) and protein kinase A. J Biol Chem. 2004;279:19375–19382. doi: 10.1074/jbc.M313476200. [DOI] [PubMed] [Google Scholar]
- Vaca L, Kunze DL. IP3-activated Ca2+ channels in the plasma membrane of cultured vascular endothelial cells. Am J Physiol Cell Physiol. 1995;269:C733–C738. doi: 10.1152/ajpcell.1995.269.3.C733. [DOI] [PubMed] [Google Scholar]
- van Rossum DB, Patterson RL, Kiselyov K, Boehning D, Barrow RK, Gill DL, Snyder SH. Agonist-induced Ca2+ entry determined by inositol 1,4,5-trisphosphate recognition. Proc Natl Acad Sci U S A. 2004;101:2323–2327. doi: 10.1073/pnas.0308565100. [DOI] [PMC free article] [PubMed] [Google Scholar]
- Vazquez G, Wedel BJ, Bird GS, Joseph SK, Putney JW. An inositol 1,4,5-trisphosphate receptor-dependent cation entry pathway in DT40 B lymphocytes. EMBO J. 2002;21:4531–4538. doi: 10.1093/emboj/cdf467. [DOI] [PMC free article] [PubMed] [Google Scholar]
- Wagner LE, 2nd, Betzenhauser MJ, Yule DI. ATP binding to a unique site in the type-1, S2− inositol 1,4,5-trisphosphate receptor defines susceptibility to phosphorylation by protein kinase A. J Biol Chem. 2006;281:17410–17419. doi: 10.1074/jbc.M601340200. [DOI] [PubMed] [Google Scholar]
- Wagner LE, 2nd, Li WH, Joseph SK, Yule DI. Functional consequences of phosphomimetic mutations at key cAMP-dependent protein kinase phosphorylation sites in the type 1 inositol 1,4,5-trisphosphate receptor. J Biol Chem. 2004;279:46242–46252. doi: 10.1074/jbc.M405849200. [DOI] [PubMed] [Google Scholar]
- Wagner LE, 2nd, Li WH, Yule DI. Phosphorylation of type-1 inositol 1,4,5-trisphosphate receptors by cyclic nucleotide-dependent protein kinases: a mutational analysis of the functionally important sites in the S2+ and S2− splice variants. J Biol Chem. 2003;278:45811–45817. doi: 10.1074/jbc.M306270200. [DOI] [PubMed] [Google Scholar]
- Walaas SI, Nairn AC, Greengard P. Regional distribution of calcium- and cyclic adenosine 3′:5′-monophosphate-regulated protein phosphorylation systems in mammalian brain. I. Particulate systems. J Neurosci. 1983;3:291–301. doi: 10.1523/JNEUROSCI.03-02-00291.1983. [DOI] [PMC free article] [PubMed] [Google Scholar]
- Walaas SI, Nairn AC, Greengard P. PCPP-260, a Purkinje cell-specific cyclic AMP-regulated membrane phosphoprotein of Mr 260,000. J Neurosci. 1986;6:954–961. doi: 10.1523/JNEUROSCI.06-04-00954.1986. [DOI] [PMC free article] [PubMed] [Google Scholar]
- Wojcikiewicz RJ. Type I, II, and III inositol 1,4,5-trisphosphate receptors are unequally susceptible to down-regulation and are expressed in markedly different proportions in different cell types. J Biol Chem. 1995;270:11678–11683. doi: 10.1074/jbc.270.19.11678. [DOI] [PubMed] [Google Scholar]
- Wojcikiewicz RJ, Luo SG. Phosphorylation of inositol 1,4,5-trisphosphate receptors by cAMP-dependent protein kinase. Type I, II, and III receptors are differentially susceptible to phosphorylation and are phosphorylated in intact cells. J Biol Chem. 1998;273:5670–5677. doi: 10.1074/jbc.273.10.5670. [DOI] [PubMed] [Google Scholar]
- Yoshikawa F, Morita M, Monkawa T, Michikawa T, Furuichi T, Mikoshiba K. Mutational analysis of the ligand binding site of the inositol 1,4,5-trisphosphate receptor. J Biol Chem. 1996;271:18277–18284. doi: 10.1074/jbc.271.30.18277. [DOI] [PubMed] [Google Scholar]
- Yue DT, Herzig S, Marban E. β-Adrenergic stimulation of calcium channels occurs by potentiation of high-activity gating modes. Proc Natl Acad Sci U S A. 1990;87:753–757. doi: 10.1073/pnas.87.2.753. [DOI] [PMC free article] [PubMed] [Google Scholar]
Associated Data
This section collects any data citations, data availability statements, or supplementary materials included in this article.


