Abstract
Green fluorescent protein (GFP)fused to the C-terminal 100 amino acids of CAAT enhancer binding protein (C/EBP) also containing an N-terminal (His)6 tag (GFP-C/EBP) was used as a transcription factor model to test whether thiol-disulfide exchange reactions could be used to successfully purify transcription factors. A symmetrical dithiol oligonucleotide with dual CAAT elements was constructed with 5′ and 3′ thiols. Upon reduction, circular dichroism confirms it spontaneously anneals with its internally complementary sequence to form the hairpin structure:

The specific GFP-C/EBP protein – DNA complex, formed in solution at nM concentrations, could then be recovered (trapped) via thiol-disulfide exchange with a disulfide thiopropyl-Sepharose and eluted with dithiothreitol. GFP-C/EBP was isolated from crude bacterial extract treated with iodoacetamide; DNA binding by GFP-C/EBP was unaltered by carboxyamidomethylation. Eluted GFP-C/EBP was of high purity by sodium dodecyl sulfate-polyacrylamide gel electrophoresis (SDS-PAGE). The protein, after in-gel digestion with trypsin, was also characterized by capillary reversed-phase liquid chromatography-nano electrospray ionization-tandem mass spectrometry and the results analyzed using MASCOT software searching of the non-redundant protein database. A score of 1874 with a sequence coverage of 51% encompassing both termini and internal sequences for the match with GFP-C/EBP confirms its identity and sequence. The method has high potential for the identification and characterization of transcription factors and other DNA-binding proteins.
Keywords: Transcription Factor, Affinity Chromatography, C/EBP, GFP-C/EBP, Symmetrical DNA
1.0 INTRODUCTION
DNA-binding proteins are responsible for replicating the genome, transcribing active genes, and repairing damaged DNA [1,2]. The transcription factors (TFs), one of the largest and most diverse classes of DNA-binding proteins, regulate cell development, differentiation, and growth. TFs contain DNA-binding domains belonging to several super-families, with different but very specific DNA-binding mechanisms [1,3–5]. The number of transcription factors is probably limited by the size of genome, but increases with the number of genes [6]. A recent article by Itzkovitz et al., have presented the data on the maximal number of TFs from each super-family in a single organism and the organism in which the maximum is observed [7]. For example, the maximal number of TFs of the winged helix DNA-binding domain super-family in archaea, bacteria, and eukaryotes is about 300, and this number reaches a maximum for the organism with ~5,000 genes [7]. Although some broad general rules for the DNA-binding of TFs have been developed, the results are limited by the small number of TFs isolated or purified [1]. It is not possible to understand how genetic information is utilized by cellular machineries without understanding their structures and DNA-binding properties [1]. TFs’ role in regulating genes by binding DNA sequences at the promoters of the target genes have implications in many human diseases [8], in the strategy of cancer therapeutics [9,10], solid tumor development and drug resistance [11], and in myeloid cancer [12].
The number of TFs in humans is estimated to be over 1400 [13] and the extremely small concentrations of these proteins inside the cells makes their isolation from cellular extracts for detailed studies a major challenge. Reveiws of TFs and the methods available for purifying and studying TFs are available [14,15]. We have used the CAAT enhancer binding protein (C/EBP) as a model to develop new methods to purify TFs [16]. This TF belongs to the basic leucine zipper motif gene family and occurs in several isoforms that stimulate or inhibit transcription from a growing list of genes in a variety of tissues in animals, and in the development and maintenance of metabolically important processes. The biology of C/EBP has been reviewed [17–20]. C/EBP consists of an activation domain, a leucine zipper dimerization domain, and a basic DNA-binding domain (bZIP motif). Its family members share the highly conserved dimerization domain, prerequisite for DNA binding, by which they form homo- and heterodimers with other family members. Also, C/EBPs are least conserved in their activation domains and vary from strong activators to dominant negative repressors [17]. Six members of C/EBP family of TFs are known, designated C/EBPα, -β, γ, -δ, -ε, and –ξ [18,21]. All C/EBPs interact with each other and with other TFs to regulate mRNA transcription [18,22]. Five members of the CEBP transcription factor family are targeted by recurrent immunoglobulin heavy chain translocations in B-cell precursor acute lymphoblastic leukemia [23].
Our laboratory has developed several successful chromatographic methods for purifying TFs [24–27], restriction enzymes [28], and DNA polymerases [29]. Strategies for affinity-based protein purification [30,31] and DNA affinity chromatography for the purification of transcription factors [29,32] have been reviewed. The most efficient technique used so far is “trapping”. This method uses a duplex DNA element which contains a single stranded tail. It is incubated with crude extracts at low concentration to favor the formation of a specific transcription factor-DNA complex and to disfavor non-specific DNA-binding. The complex is then trapped by annealing the single stranded region to a complementary single stranded DNA-support and subsequently eluted. These single stranded sequences can bind some unwanted proteins which lower purification. Here, we try a new approach using a symmetrical dithiol oligonucleotide without single stranded regions on either the oligonucleotide or the column, in a first attempt to circumvent these problems.
The uses of sulfhydryl chemistry, especially the versatile application of thiol-disulfide exchange reactions are well-known in chemistry and biochemistry [33]. Our hypothesis is that a hairpin DNA containing fewer ends and no single stranded sequences will improve the purification of DNA and RNA-binding proteins. The flexibility of the thiol-disulfide exchange chemistry may also allow use of thiol-containing substrates and the trapping method specificity to purify low abundance enzymes.
To explore this new method for the isolation of TFs, C/EBP was expressed in bacteria as a fusion protein (GFP-C/EBP) with green fluorescent protein (GFP) and used as a model for the purification of C/EBP. The wild type GFP is relatively insensitive to pH changes and tolerates N- and C- terminal fusion to abroad variety of proteins without destroying their native properties [34]. Previously, the GFP-C/EBP fusion protein was shown to be an efficient and convenient model for purifying transcription factors because small amounts of it could be detected from its fluorescent properties [25,26]. Also, the DNA binding properties of GFP-C/EBP have been shown to be similar to that of naturally occurring C/EBP [25].
2.0 EXPERIMENTAL
Thiopropyl-Sepharose 6B (TPS) was from Sigma-Aldrich (St. Louis, MO, USA). The buffers consisting of Tris.HCl, ethylenediamine-N,N,N′,N′-tetraacetic acid (EDTA) and various concentrations of sodium chloride (NaCl) were used in the experiments. These were: TE = 10 mM Tris-HCl, 1 mM EDTA, pH 7.5; TE0.1 = TE containing 0.1 M NaCl, pH 7.7; TE0.4 = TE containing 0.4 M NaCl, pH 7.5. Bio-Gel P-6 was from Bio-Rad, Hercules, CA, USA; di-dC, i.e., Poly (dI-dC)-Poly(dI-dC) was from Pierce, Rockford, IL, USA; Ni2+-NTA was from Qiagen, Valencia, CA, USA.
The EP36 DNA (Eq. 1) with thiol modifiers at both ends was synthesized by Integrated DNA Technologies (Coralville, IA, USA).
| (1) |
The 36-bp nucleotide DNA is a symmetrical repeat of the first eighteen bases so that the complementary bases should anneal into a hairpin (Eq. 2). After ethanol precipitation of the DNA, the disulfide bonds were reduced to generate the dithiol EP36 (Eq. 2) by treatment with 100 mM dithiothreitol (DTT) at room temperature for 30 min.
 |
(2) |
After another ethanol precipitation, the re-suspended DNA in TE 0.1 buffer (100 μL) was desalted by gel filtration, using Biogel P6 in TE0.1 in a 1 mL volume spin column and used immediately for experiments. The concentration was determined using EM260 nm = 335 500 M−1.cm−1 provided by the manufacturer (Integrated DNA Technologies).
All buffers were filtered using 0.22 μm syringe filters. To minimize air oxidation of the thiol groups, buffers were first degassed using a sonicator (10 min) followed by purging with N2 gas (30 min). Unused dithiol EP36 was stored in −85oC in the presence of 1 mM DTT.
2.1 The GFP-C/EBP fusion protein, containing at its C-terminus the C-terminal 100 amino acid DNA binding region of the rat liver C/EBP and a (His)6 tag at its N-terminus, was produced in Escherichia coli strain BL21 containing plasmid pJ22-GFP-C/EBP as described earlier [25]. The (His)6 tag facilitated its purification by using Ni2+-NTA-agarose column according to the published method [25]. The molecular masses of GFP and GFP-C/EBP are 33.2 and 42.6 kDa., respectively [25]. Protein concentration was determined by the Bradford assay [35] with bovine serum albumin as the standard.
Stock concentrations of the Ni2+-NTA purified GFP-C/EBP, and crude bacterial extract were 0.31, and 1.56 mg/mL, respectively. As estimated from DTNB (see Fig. 1 for this and other structures) titrations (discussed in section 2.2), purified GFP-C/EBP did not show the presence of any reactive –SH groups, whereas, the bacterial extract contained 71 μM titratable thiols.
Figure 1.
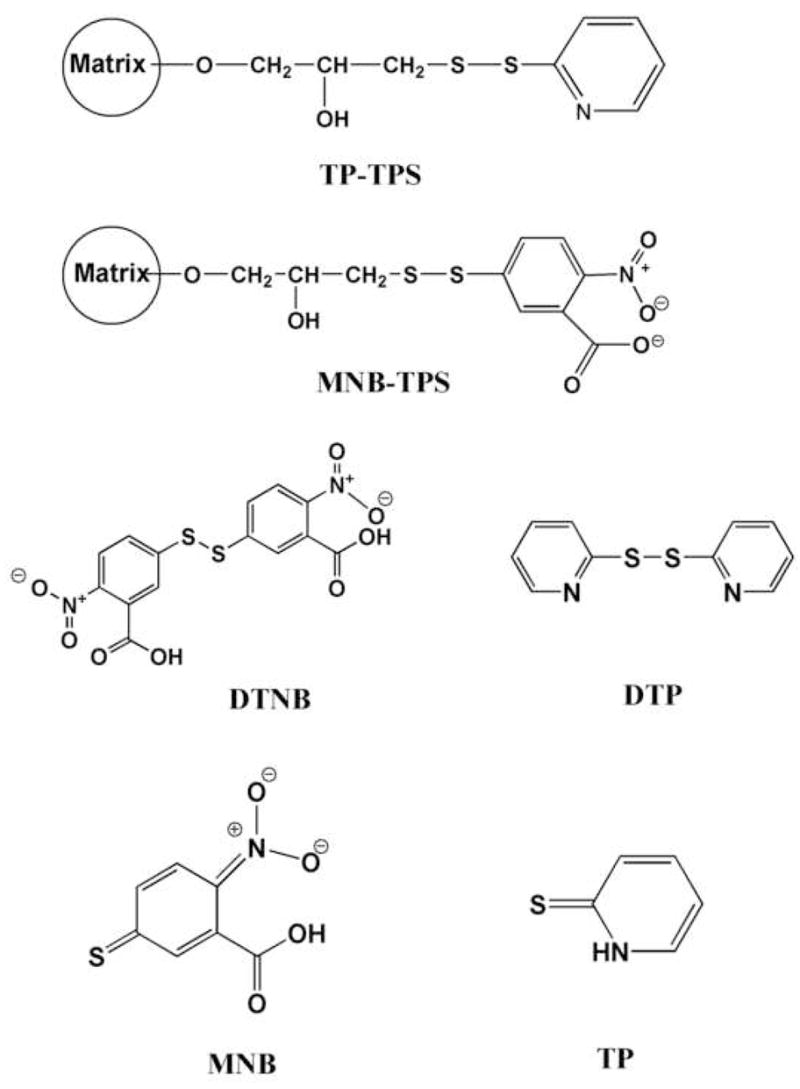
Chemical Structures. Shown are TP-TPS, the disulfide of thiopropyl-Sepharose with 2-thiopyridine; MNB-TPS, disulfide of thiopropyl-Sepharose with 2-nitro-5-thio-benzoate; DTNB, 5,5′-dithio-2-nitrobenzoate; DTP, 2,2′-dithiopyridine; MNB, 2-nitro-5-thio-benzoate; TP, 2-thiopyridone.
Proteins in the preparations and eluted fractions from chromatography were analyzed by 12% polyacrylamide gel electrophoresis with SDS (SDS-PAGE) by the method of Laemmli [36]. Gels were stained with Coomassie brilliant blue R-250 dye.
The DNA-binding property of the GFP-C/EBP and iodoacetamide treated GFP-C/EBP were assessed using electrophoretic mobility shift assay (EMSA) as described earlier [25].
2.2 Thiol content was quantified using a spectrophotometric assay of 5-mercapto-2-nitrobenzoate (MNB), the reduction product of 5,5′-dithiobis (2-nitrobenzoic acid) (DTNB) [37]. Calibration curves using several different concentrations of either 2-mercaptoethanol (BME) or dithiothreitol (DTT) were used. The EM412 nm = 14 140 M−1.cm−1. cm−1, which is independent of pH in the range 7.00–8.6 [38] was used for the calculations.
2.3 Carboxyamidomethylation of the cysteines in GFP-C/EBP and crude bacterial extract was by the method of Means and Feeney [39]. Briefly, the proteins stored in the presence of thiols, were mixed with a 10-fold excess of iodoacetamide in a volume of 250–500 μL in TE 0.1 buffer, pH = 7.5. The sample was incubated on ice for one hour and then desalted using a 1 mL volume Biogel P6 in TE0.1 spin column. The eluted protein was confirmed to have an absence of reactive thiols using the DTNB assay as described in section 2.2.
2.4 Spectroscopy
The fluorescence spectrum of GFP-C/EBP was recorded using a Fluromax 3 fluorescence spectrophotometer (Horiba Jobin Yvon, Edison, NJ, USA). During chromatography, the eluted fractions of 200 μL each were collected in UV transparent 96 well plates using a micro-fraction collector. The concentration of GFP-C/EBP in these fractions was determined from a calibration curve of the fluorescence intensities of known amounts of Ni2+-NTA purified GFP-C/EBP using a Tecan M200 plate reader (Tecan US, Durham, NC, USA). The excitation was at 398 nm and measuring emission intensity at 512 nm. The plate reader is equipped with monochromators for both excitation and emission wavelengths. DNA, 2-thiopyridone (TP), and MNB in the fractions were monitored using the instrument in the absorbance mode.
Circular Dichroism spectra were recorded using a JASCO (Easton, MD, USA), model J-815 spectropolarimeter equipped with Peltier temperature control. The spectra were corrected for the individual buffers with or without DTT.
2.5 Reduced Thiopropyl-Sepharose (TPS) beads were reduced with 100 mM DTT and excess reducing agent was completely washed away with TE0.1 buffer. The eluted fractions were confirmed to be free of DTT using the DTNB reaction. The reduced beads contained 0.47 M thiol by DTNB determination.
2.6 Disulfide thiopropyl-Sepharoses
Thiopropyl-Sepharose is supplied as the disulfide with 2-thiopyridine. Once used, it can be reconverted to this form by thorough reduction with excess 100 mM DTT, washed thoroughly with water, and reacted with excess 100 mM 2, 2′-dithiopyridine (DTP) in 0.5 M sodium phosphate, pH 7.2. Similarly, after reduction with dithiothreitol and washing, reaction with excess 100 mM DTNB in 0.5 M sodium phosphate, pH 7.2 gives the 2-nitrobenzoate-5-mecapto disulfide with TPS.
2.7 Proteomic analysis
Bands were cut from SDS-PAGE gels and subjected to in-gel trypsin digestion. The gel slices were destained with 1:1 acetonitrile (ACN): 50 mM NH4HCO3, reduced with 10 mM DTT at 56°C for 1 h and alkylated in the dark with 50 mM iodoacetamide at room temperature for 1 h. The gel plugs were lyophilized and immersed in 15–20 μL of 20 ng/μL trypsin (Promega, Madison, WI, USA) solution in 25 mM NH4HCO3 for digestion at 37°C overnight. Peptides were extracted twice with 50 μL 5% TFA in 50% ACN and the extracts combined. After lyophilization, the peptide mixture was analyzed by capillary HPLC-electrospray ionization tandem mass spectrometry (HPLC-ESI-MS/MS) using a Thermo Finnigan linear ion trap mass spectrometer (LTQ-XL) equipped with a nano-ESI source. Assignment of MS/MS spectra were achieved by probability-based protein database searching (MASCOT, Matrixscience) using the NCBI non-redundant protein database merged with an in-house database of fusion proteins.
2.8 Southwestern blot analysis of Sp1
HEK293 nuclear extract (50 μg, 10 μl) was separated by 15% SDS-PAGE and electrophoretically transferred onto nitrocellulose membrane for southwestern blot analysis at 4°C. The nitrocellulose-bound proteins were denatured in 50 ml denaturing buffer (6 M guanidine/HCl in binding buffer containing 10 mM HEPES, pH 7.9, 50 mM NaCl, 10 mM MgCl2, 0.1 mM EDTA, 1 mM DTT, 0.1% Triton X-100) to remove SDS for 10 min. The blot was then renatured by adding an equal volume of binding buffer sequentially to dilute the guanidine/HCl from 6 M to 3, 1.5, 0.75, 0.38 and 0.185 M with 5 min incubation after each addition. The membrane was then blocked 1 h in binding buffer containing 5% non-fat milk. The blot was then probed with either the 5′ end labeled self-complementary Sp1 oligoncleotide (5′-32PO4-ACGGGCGGGCCCGCCCATGGGCGGGCCCGCCCGT-3′) or the identical oligonucleotide sequence with a 3′-(GT)5 tail (5′-32PO4-ACGGGCGGGCCCGCCCATGGGCGGGCCCGCCCGTGTGTGTGTGT-3′) used for trapping. The appropriate radiolabeled oligonucleotide (1.5 nM) was added to the blot in binding buffer containing 0.25% bovine serum albumin (BSA) and 10 μg/ml poly dI:dC and incubated overnight. The membrane was washed thrice for 10 min with binding buffer and detected by autoradiography.
3.0 RESULTS AND DISCUSSION
3.1 The problem with tailed oligonucleotide trapping
Our laboratory has now purified or helped with the purification of six different transcription factors (C/EBP, B3, Gal4, lac repressor, MafA, and a complex of c-jun-Ku proteins which binds a novel element in the c-jun promoter) by tailed oligonucleotide trapping in published [25–27,40–42] and unpublished studies. Often this method has worked very well, including with C/EBP [27,41] and yields a highly purified protein which can then be readily characterized. However, with less abundant proteins, such as with c-jun (unpublished), we encountered appreciable levels of other DNA-binding proteins, including PARP-1, heterogeneous ribonucleoproteins (hnRNPs), DNA repair proteins, and others which interfered with proteomic analysis.
This problem is perhaps best exemplified by the southwestern blot analysis shown in Fig. 2. In a southwestern blot, proteins, in this case HEK293 cell nuclear extract, are separated by SDS-PAGE, electroblotted, the blotted proteins are renatured, probed with a radiolabled oligonucleotide, and detected by autoradiography. In Fig. 2, the blot is probed with an oligonucleotide containing the GC-box element bound by Sp1 and other members of the Sp-family of transcription factors. With the untailed Sp1 oligonucleotide, three dominant bands are observed, all of which have molecular weights consistent with Sp-family members. However, when the same sequence with a single stranded tail is used, at least 13 binding proteins are observed. Clearly, an oligonucleotide without a tail binds less proteins and is likely to have higher specificity. Also, some proteins such as the Ku proteins are known to bind double-stranded DNA-ends [43,44]. Thus, minimizing the number of ends in a trapping oligonucleotide might also improve purity. Similar results were also obtained with C/EBP but in that case we used a new two-dimensional southwestern blotting method which is still under development (data not shown). To circumvent these problems, we used the GFP-C/EBP fusion protein developed earlier [25] as a model to determine whether it was feasible to use thiol-disulfide exchange columns to purify transcription factors with an oligonucleotide lacking a tail and having only a single double-stranded end.
Figure 2.
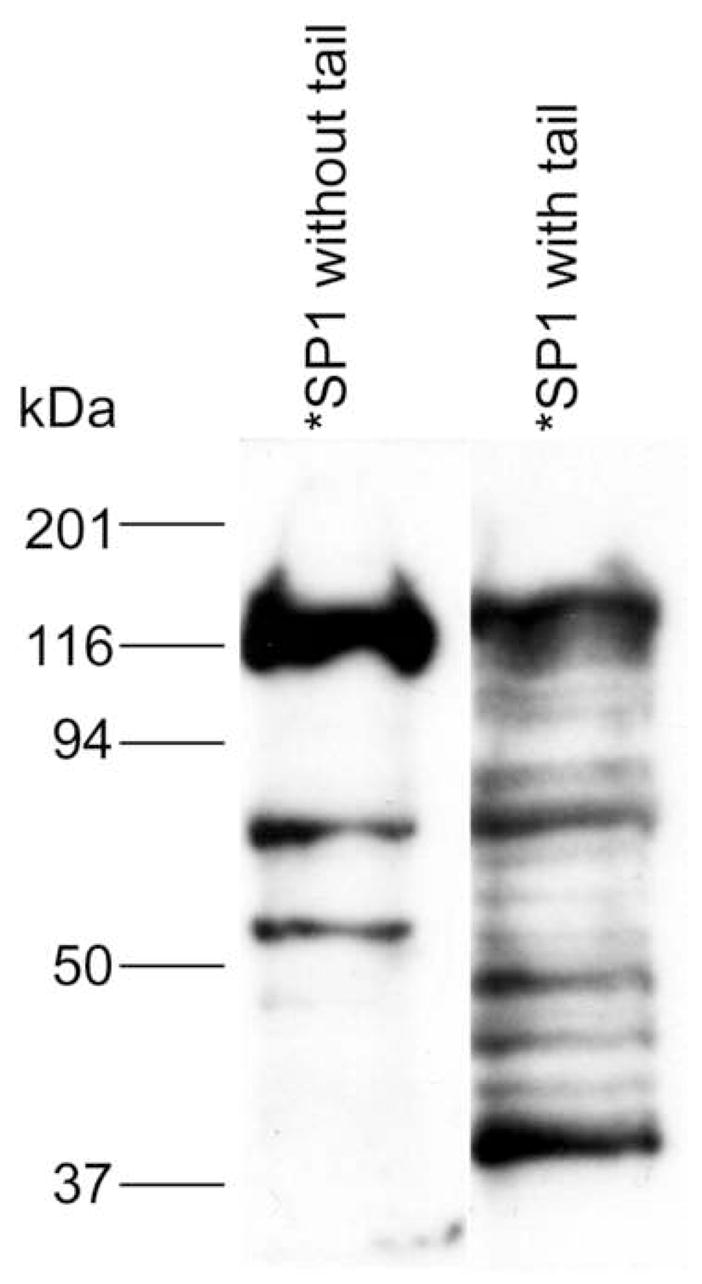
Southwestern blotting reveals difference between tailed and untailed DNA binding to nuclear proteins. The results shown are a southwestern blot of HEK293 nuclear extract with the same GC-box oligonucleotde sequence differing only in whether it contained a 3′-(GT)5 single stranded tail.
3.2 Spectroscopy shows the reason for GFP-C/EBP
The emission spectrum of Ni2+-NTA purified GFP-C/EBP in TE0.4 buffer with excitation at 398 nm is shown in Fig. 3A. The emission maximum appears at 512 nm is very close to the emission at 508 nm reported for GFP in the literature [34]. The linear dependence of emission intensity at 512 nm in the concentration range of 0.5–8.0 μg/mL GFP-C/EBP is shown in Fig. 3B. The concentration of the GFP-C/EBP in the column fractions was determined using such standard curves done on the same day. The dialyzed crude bacterial extract was estimated to contain 18% GFP-C/EBP and DTNB titrations showed the presence of 70 μM of thiol groups before iodoacetamide reaction.
Figure 3.
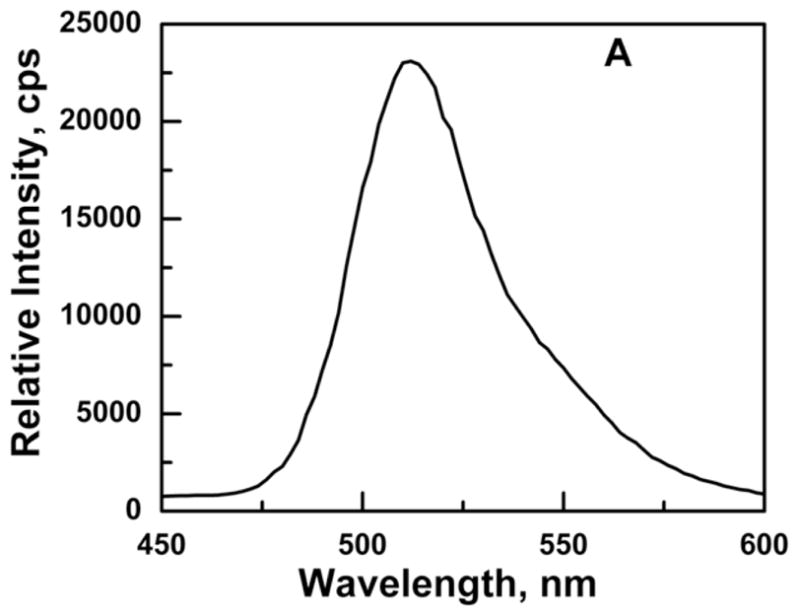
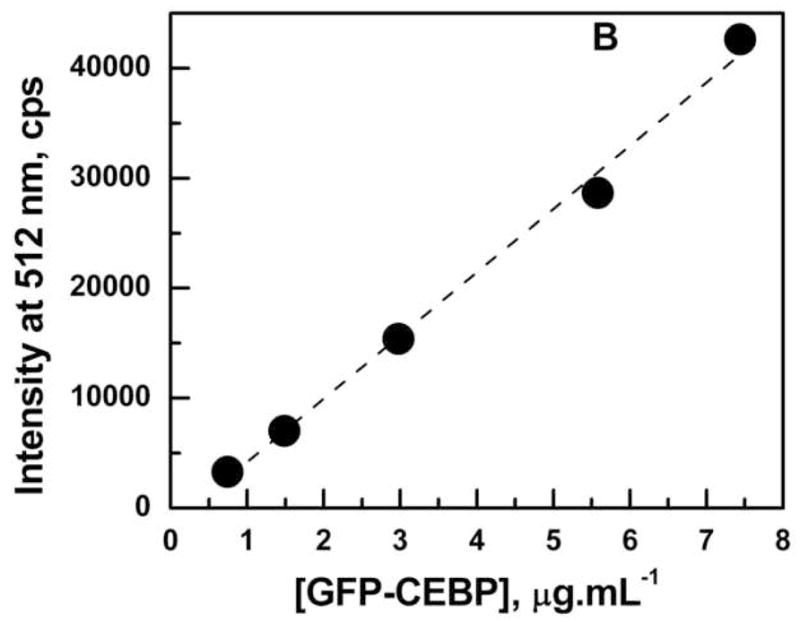
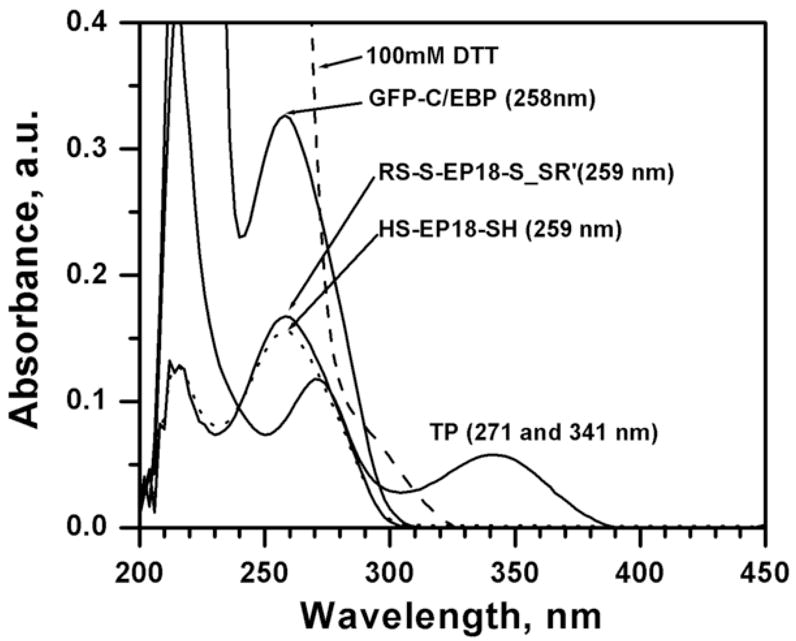
Panel A: Emission spectrum of Ni2+-NTA purified GFP-C/EBP in TE 0.4, pH = 7.5, T = 25 °C. Excitation was at 398 nm. The protein concentration was 1 μM in 200 μL volume of buffer. Panel B: Generation of a standard curve GFP-C/EBP in TE 0.4, pH = 7.5, T = 25 °C. Excitation was at 398 nm and emission was monitored at 512 nm. The protein concentrations are in the range 0.7 to 7.5 μg.ml−1. The dashed line is the fit to the equation for a straight line. Panel C: UV-Visible scans of GFP-C/EBP (0.5 μM, solid line), 0.5 μM RS-S-EP36-S-SR′ (solid line) and HS-S-EP36-S-SH (dotted line), TP (5 μM, solid line), and 100 mM DTT (dashed line) in TE0.4, pH=7.5 buffer at 25 °C. The λmax values observed are in the parentheses for the individual scans.
The UV-Visible spectra of the GFP-C/EBP, the disulfide protected and thiol EP36, 100 mM DTT, and all other possible byproducts in the column experiments are shown in Fig. 3C. From an inspection of the λmax values and the peak widths it is obvious that the binding or elution of the DNA cannot be determined by its UV-Visible spectral intensity at 260 nm in the presence of either the protein, DTT, DTP, or TP unless they are removed first from the fractions. However, monitoring the protein using a fluorescence tag and the DNA using Circular Dichroism circumvents this problem. The use of GFP as the fluorescent tag in the fusion protein makes the monitoring of its elution very accurately at various concentration because its excitation at 398 nm and emission at 512 do not have contributions from the absorbances of compounds used (Fig. 3C) at these wavelengths.
3.3 The EP36 folds into normal B-helix DNA
The Circular Dichroic spectra of the 5 μM disulfide protected 3′RS-S-EP36-S-SR5′ and reduced 3′HS-EP36-SH5′ are shown in Fig. 4. The dashed line in the figure represents the reduced DNA that was oxidized with Cu2+- phenanthroline. All of the spectra showed characteristic troughs at 251 nm and peaks at 283 nm respectively indicating the formation of a double stranded symmetrical looped DNA whether in the oxidized or the reduced form. Analysis of Circular Dichroism spectra have been shown to provide information on the characteristic differences between the structures of the mononucleotides and double strands of RNA and DNA chains [45,46], and provides information on the conformations of A-, B-, and Z-forms of DNA [47]. Empirical structural analysis of DNA from the observed CD has been discussed in the literature [48] and the CD in Fig. 4 indicates the 3′RS-S-EP36-S-SR5′ and 3′HS-EP36-SH5′ are in B-forms in the buffer used. The typical B-form DNA is characterized from the presence of a negative band ~240 nm, a positive band centered ~275 nm, with the zero around ~250 nm. The overall shapes of the CD spectra in Fig. 4 match with the CD of the synthetic polynucleotide poly(dG-dC)-poly(dG-dC) which was in the right-handed helix, B-form, in 0 – 40 % ethanol or 10−3 to 2 M NaCl [47]. Interestingly, observed CD spectra often are sensitive to changes in the orientation of the bases rather than the base composition. Although, DNA conformations are sensitive to the environment, such as salt concentration, solvent, and pH of the solution, caution must be taken for the interpretation of minor changes in the CDs as the contributions from different forms, without further proof.
Figure 4.
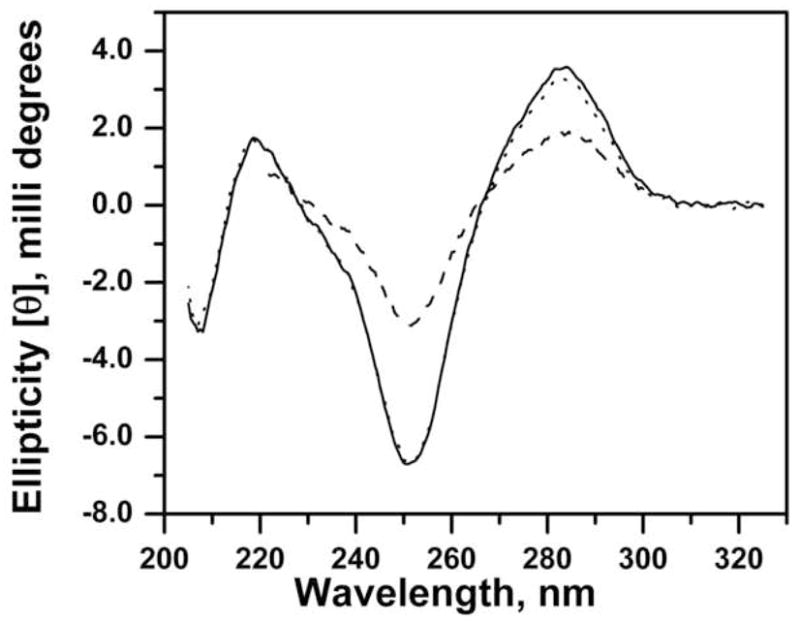
The Circular Dichroism spectra of 5 μM RS-S-EP36-S-SR′ (solid line), HS-S-EP36-S-SH (dotted line), and Cu2+-phenanthroline oxidized HS-S-EP36-S-SH (dashed) in 0.5 M NaPi, pH = 7.2 buffer at 25 °C. A 0.2 cm path 1 mL volume quartz cuvette containing 600 μL of solution was used. Scans were recorded at data pitch = 1 nm, bandwidth = 2 nm, and at a speed of 20 nm.min−1.
Addition of 100 μM DTNB, 500 μM DTT either individually or together did not affect the shape or ellipticities of the observed signals (data not shown). This observation was useful in detecting the DNA by its CD signal in some of the control experiments where the disulfide exchange reactions of the either the disulfide and thiol-EP36s with the reduced and disulfide linked TPS columns, respectively, were tested. In experiments where the column bound DNA was eluted with 100 mM DTT, therefore contained DTT and TP released from the TPS column, after diluting the eluted fraction by about 100 fold in phosphate buffer, its presence or absence was confirmed by its CD signal. DNA cannot be quantitated by UV-Vis spectroscopy because its absorbance ( λmax = 258 nm) is heavily masked by the absorption band of DTT and TP.
3.4 Reaction with iodoacetamide does not affect DNA-binding
In a control experiment it was observed that the complex of HS-EP36-SH and non-carboxyamidomethylated GFP-C/EBP did not bind to the column and elute in the loading buffer (data not shown). Probably the cysteine thiols present in the proteins reduce or exchange with the disulfide bond between the beads and the DNA. One way to circumvent this problem would be to react the proteins with iodoacetamide to modify (carboxyamidomethylate) protein thiols but this approach would only be useful if reaction does not affect DNA-binding.
The DNA-binding properties of the GFP-C/EBP and carboxyamidomethylated GFP-C/EBP were assessed by electrophoretic mobility shift assay (EMSA) in Fig. 5. In an earlier investigation using unlabeled and radiolabeled EP24 oligonucleotide containing the CAAT element in the sequence, it has been demonstrated by EMSA that native rat liver C/EBP and GFP-C/EBP effectively bind the oligonucleotide with similar affinity [25]. It is evident in Fig. 5 that either the GFP-C/EBP present in bacterial extract (lanes 2 and 3) or the Ni2+-NTA purified GFP-C/EBP (lanes 4 and 5) bind the radiolabeled EP24 regardless of carboxyamidomethylation (lanes 3 and 5) or not (lanes 2 and 4). In Lane 1 of Fig. 5, a significant band higher than the free monomeric DNA is observed in the absence of any protein. This is probably due to the formation of a dimer of the DNA [25].
Figure 5.
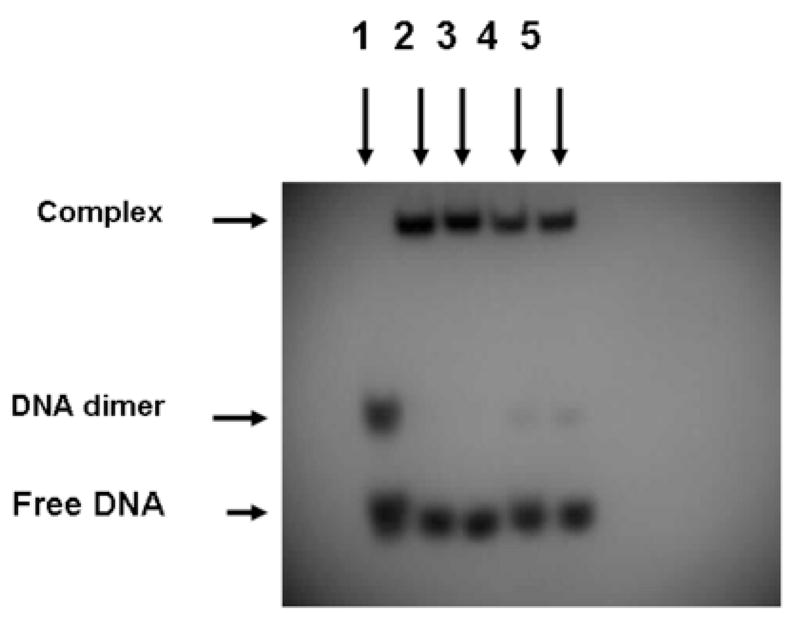
Reaction with iodoacetamide does not affect DNA-binding. Lane 1 is the radiolabeled EP24 DNA (5′-32P-GCTGCAGATTGCGCAATCTGCAGCGTGTGTGTGT-OH-3′) without protein. The gel shifts due to bacterial crude, iodoacetamide treated bacterial crude, purified GFP-C/EBP, and iodoacetamide treated purified GFP-C/EBP are shown in lanes 2, 3, 4, and 5, respectively. In the experiments 2 μL of the purified and crude proteins were used.
The other advantage of carboxyamidomethylation is that it derivatizes proteins for Mass Spectral studies by preventing the formation of unwanted disulfide linked oligomers during the ionization process.
In control experiments only the reduced dithiol DNA (HS-S-EP36-S-SH) could be coupled to the disulfide TPS column by disulfide exchange in TE0.4, pH=7.5 buffer under normal column gravity flow. When the reverse experiment was performed (i.e., disulfide EP36 and reduced TPS), little DNA bound to the column. The reason could be that the protecting groups (C6-S-S and C3-S-S) on the hairpin DNA are sterically hindered from attack by the –SH groups on the beads. Also, experiments to couple the Cu2+-phenathroline oxidized EP36, in which an S-S bond between the 3′ and 5′ SH groups would be expected to form was not successful. The possible reason could be that the thiol groups became oxidized to sulfoxides and/or sulfanes under the conditions used thus making it unproductive for coupling [33]. These results further defined the way in which trapping would be performed.
Since disulfide TPS was to be used, we prepared the MNB form of the column (MNB-TPS) to allow monitoring of DNA binding to the column. The column was 1 mL of MNB-TPS disulfide beads. The DNA was loaded with 200 μl of 54.2 μM HS-EP36-SH in the 0.5 M sodium phosphate, pH 7.2 buffer and as it loads, a chromophore clearly elutes. As DNA binds by thiol-disulfide exchange, the MNB is displaced as shown by the absorption at 412 nm and provides an easy way to monitor DNA-column binding. Ellipticity shows that some DNA also passes through the column. The column was eluted with 100 mM DTT in column buffer at fraction 10 and 93% of the loaded DNA is recovered. The results are shown in Table-1.
In other experiments (data not shown), similar results were found when TE0.4 was used as the column buffer or when the TP-TPS disulfide column was used and that non-specific binding of the DNA or proteins to Sepharose 4B beads (without thiopropyl) is negligible.
The results of a protein-DNA trapping experiment is shown in Fig. 6. Ni2+-NTA-purified GFP-C/EBP (3.2 nM) and 16 nM of HS-S-EP36-S-SH in a final volume of 10 ml of TE0.4 was incubated on ice for 30 min to form the GFP-C/EBP-DNA complex. This was then applied to a 1 mL volume of TP-TPS disulfide column and 250 μL fractions collected. The flow-through (fractions 1–44) show no GFP-C/EBP. Washing with 7.5 mL of TE1.2 (fractions 45–74) also eluted no protein, while 100 mM DTT in TE0.4 eluted the GFP-C/EBP in a sharp peak.
Figure 6.
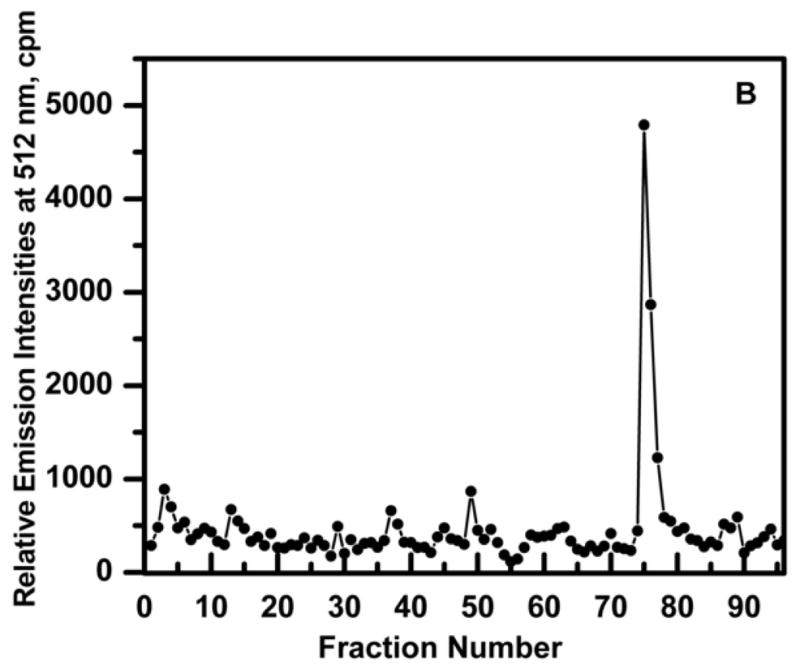
Elution profile of HS-EP36-SH (thiol DNA) and purified Ni2+-NTA purified GFP-C/EBP complex to disulfide column (TP-TPS) in TE0.4, pH=7.5 buffer at 25 °C. TE0.4, 10 mL containing 16 nM HS-EP36-SH and 3.2 nM GFP-C/EBP was incubated on ice for 30 mi. and loaded on a 1 ml TP-TPS column (fractions 1–44). Fractions (0.25 ml) were collected and the fluorescence determined. The column was then washed with 7.5 mL TE 1.2 (fractions 45–74) and then eluted with 100 mM DTT in TE0.1 (fractions 75–89).
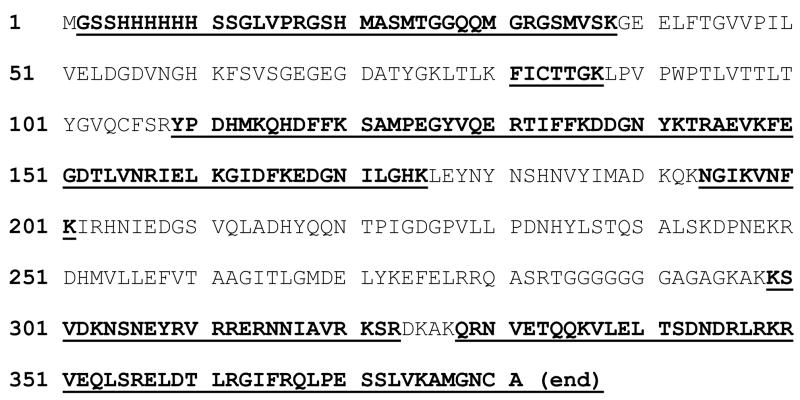
The method was further tested by trapping GFP-C/EBP from crude bacterial extract. Carboxyamidomethylated crude bacterial extract containing about 2.2 nmol of GFP-C/EBP was mixed with 10.8 nmoles of HS-S-EP36-S-SH in a final volume of 25 ml of TE0.4 on ice for 1 h to form the GFP-C/EBP-DNA complex. This was then applied to a 2 mL volume of 2-thiopyridine-TPS disulfide column and 200 μL fractions were collected. After loading, the column was washed with 10 mL of TE0.4 followed by washing with 10 mL of TE1.2, TE1.6, and TE2.0 buffers. As in the case of purified GFP-C/EBP, the flow-through and none of the washings showed any measurable fluorescence intensities (data not shown) demonstrating that the desired GFP-C/EBP present in the bacterial crude is bound to HS-EP36-SH that subsequently coupled to TP-TPS by disulfide exchange under these conditions and is not displaced by salt. Finally, the fluorescent GFP-C/EBP was eluted with 100 mM DTT. The fluorescence intensities of DTT eluted fractions at 512 nm (excitation at 398 nm) are shown in Figure 7. The relative emission intensity of the loaded complex (200 μL of the 25 ml sample determined on the same plate as the fractions) has only 4050 cps, therefore the intensities seen in the fractions (Fig. 7) show that the GFP-C/EBP is highly concentrated after trapping. SDS-PAGE of the 2 μg of the DTT eluted protein from fraction 11 (Fig. 7) and the bacterial extract starting material is shown in Fig. 8. The position of the band (lane 1) is similar in molecular weight (~42 kD) and purity to that of Ni2+-NTA purified GFP-C/EBP control (lane 2). The most intense band from lane 1was cut from the gel, digested with trypsin, and analyzed by reversed-phase microcapillary liquid chromatography and nanosprayESI-tandem mass spectrometry. Sequence search (MASCOT) of the peptides matched 136 queries all corresponding to GFP-C/EBP giving a very high score of 1874 with sequence coverage of 51%. Sequence coverage is shown in Fig. 9. The sequence matches occur both in the GFP sequences (N-terminal) and the C/EBP-derived 100 amino acid region at the C-terminus.
Figure 7.
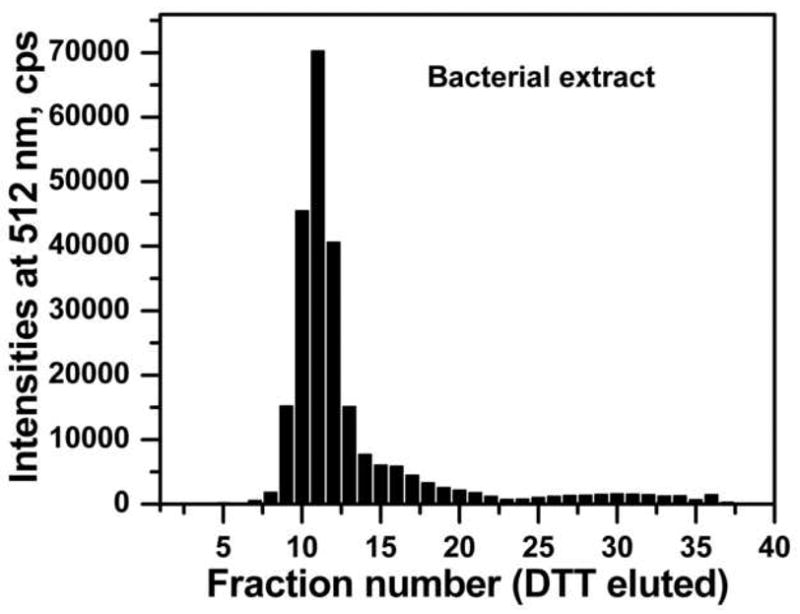
The elution profile of the GFP-C/EBP from the carboxyamidomethylated bacterial crude and reduced HS-EP36-SH from the TP-TPS column by 100 mM DTT. 0.46 ml of carboxyamidomethylated crude bacterial extract was mixed with 25 ml TE0.4 containing 10.8 nmol of HS-EP36-SH and applied to a 2 ml TP-TPS column. The column was then washed with 10 ml of TE, 8 ml of TE1.2, 9 ml of TE1.6, 10 ml of TE2.0 (data not shown), and eluted with 100 mM DTT in TE0.4. The 200 μL fractions were collected using 96 well plates and the fluorescence emission intensities were monitored at 512 nm by exciting the samples at 398 nm. The fractions from loading and washing are not shown as they do not have any fluorescence (see Results). Elution with 100 mM DTT in TE0.4 begins at fraction 1 for the plate shown.
Figure 8.
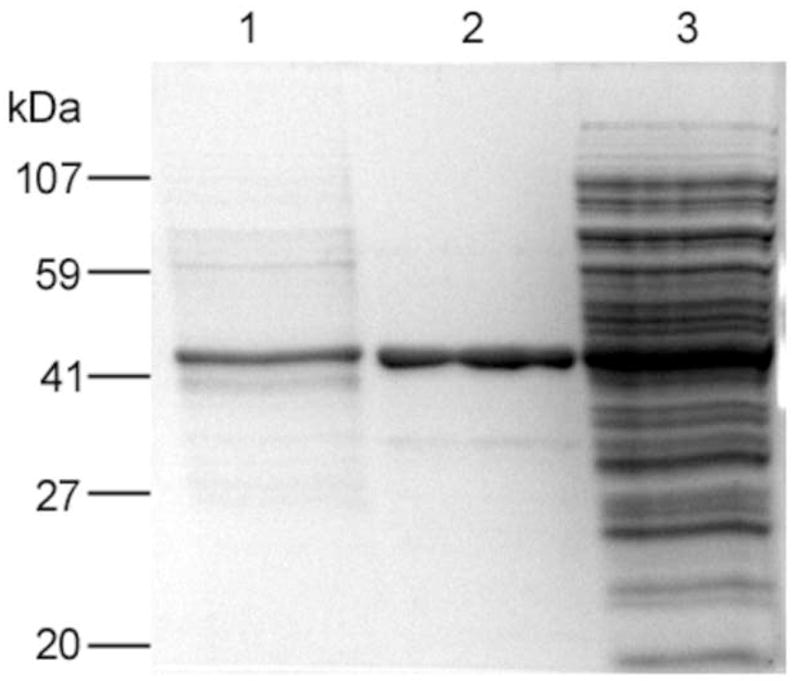
12% SDS-PAGE of proteins investigated. Bands visible after Coomassie dye staining are in lanes: (1) 2 μg of DTT eluted protein from fraction 11 of the bacterial extract from Fig. 7, (2) 5 μg of Ni2+-NTA purified GFP-C/EBP, and (3) 10 μg of bacterial crude extract.
Figure 9.
Sequence search (MASCOT) of the protein from SDS PAGE (the most intense band, lane 1, Figure 7) of the DTT eluted fraction 11 (Figure 6) of the crude bacterial extract. The MASCOT score was 1874. Matched peptides are shown in underlined bold.
Since the GFP-C/EBP expressed in this investigation has six His tags, the easier method to isolate and purify it is using a Ni2+-NTA agarose column. The purpose of the current method of using a thiol-disulfide exchange DNA trapping was to purify this known protein as a model. Our model is admittedly not as challenging as the purification of a native transcription factor but served its purpose in showing that the method is clearly feasible and clearly defining the conditions required. We are currently involved in studies of the purification of native C/EBP from rat liver nuclei using this new method. These experiments have already demonstrated that the purification will need to be optimized, using techniques we have already described [41] if it is to be successful. Once optimization is complete, the method will be widely applicable to other transcription factors and other DNA-binding proteins.
We also had an additional reason for investigating this thiol-disulfide exchange form of trapping. Trapping can be characterized as the method where a protein is mixed with a ligand at low concentrations in solution to favor specific binding. Columns are then used to trap the protein-ligand complex for elution in a highly purified state. As such, trapping can be used not only for transcription factors and other DNA-binding proteins, but could also be used for enzymes. Substrates for many enzymes are already available as thiol-derivatives and others can be readily synthesized. We have already shown that using a trapping approach to purify the enzyme EcoRI endonuclease gave higher purity when combined with catalytic elution [49]. Combined with the thiol-disulfide exchange method of trapping described here, these methods can now be applied to essentially any enzyme utilizing a thiol-containing substrate or a substrate to which a thiol-group could be added. Presumably, a highly specific, high resolution purification would result.
The largest group of human genes, comprising about 10% of the total, are the enzymes and the second largest group, the transcription factors comprise an additional 6% of the total [13]. Thus, the methods developed here should have broad implications to protein purification and characterization.
3.5 Conclusion
Isolation and purification of TFs pose a major challenge because they occur in very small amounts in cell lysates. Often, they are detected in nano- or pico-molar concentrations using western blot or EMSA techniques. In this investigation, we used the GFP-C/EBP fusion protein as a model as it could be monitored by the fluorescence emission from the GFP moiety. A 36 base nucleotide with symmetrical repeat of the first eighteen bases and disulfide modifiers at the 3′ and 5′ ends was used for trapping. The DNA contains two CAAT binding element and anneals into a hairpin structure both in the disulfide and reduced forms. The reduced form coupled to the thiopropyl-Sepharose (disulfide form) via thiol exchange. This nucleotide having only a single double-stranded end lacking a tail, when coupled to the TP-TPS beads circumvented the problem of trapping non-specific proteins from actual bacterial crude from the cells expressing GFP-C/EBP. The thiol-disulfide method provides an alternative, which does not require DNA with single-stranded tail and may not suffer from the same contaminants. However, alkylation of proteins was required and this may not always be practical, though it was with C/EBP. Further comparison of thiol-trapping with tailed oligonucleotide trapping with native TFs will be necessary to define the advantages of each method.
TABLE 1.
Elution of HS-EP36-SH (thiol DNA) bound to disulfide (MNB-TPS) column.
| Fraction number | Absorbance of MNB at 412 nm (A.U.) | Ellipticity from circular dichroism (mdeg.cm−1) |
|---|---|---|
| 1 | 0.01 | not seen |
| 2 | 0.31 | 0.67 |
| 3 | 0.05 | not seen |
| 4 | 0.05 | not seen |
| 5 | not seen | not seen |
| 6 | not seen | not seen |
| 7 | not seen | not seen |
| 8 | not seen | not seen |
| 9 | not seen | not seen |
| 10 | not seen | 5.43 |
| 11 | not seen | not seen |
The column volume was made of 1 mL of MNB-TPS beads. The column was loaded with 200 μl of 54.2 μM HS-EP36-HS DNA and washed with 10 ml 0.5 M sodium phosphate, pH=7.2, (fractions 1–9) and then eluted with 100 mM DTT in the same buffer. Fractions were 1 ml. Absorbance at 412 nm was measured using a Tecan plate reader and circular dichroism (ellipticity) was also measured. The data for all fractions for both measurements is shown but some are close to baseline in the scans and are reported as ‘not seen’.
Acknowledgments
The authors thank Dr. William Haskins at the RCMI Proteomics Facility of the University Texas at San Antonio for the LC-ESI-Mass Spectra, and the Spectroscopy Facility, Department of Biochemistry, University of Texas Health Science Center at San Antonio for the allowing us to use the JASCO-815 Circular Dichroism instrument. We also thank Ms. Maria Macias for excellent technical assistance. This work was supported by the National Institutes of Health, grant number 5R01GM43609.
Footnotes
Publisher's Disclaimer: This is a PDF file of an unedited manuscript that has been accepted for publication. As a service to our customers we are providing this early version of the manuscript. The manuscript will undergo copyediting, typesetting, and review of the resulting proof before it is published in its final citable form. Please note that during the production process errors may be discovered which could affect the content, and all legal disclaimers that apply to the journal pertain.
4.0 References
- 1.Pabo CO, Sauer RT. Annu Rev Biochem. 1992;61:1053. doi: 10.1146/annurev.bi.61.070192.005201. [DOI] [PubMed] [Google Scholar]
- 2.Calkhoven CF, Ab G. Biochem J. 1996;317(Pt 2):329. doi: 10.1042/bj3170329. [DOI] [PMC free article] [PubMed] [Google Scholar]
- 3.Garvie CW, Wolberger C. Mol Cell. 2001;8:937. doi: 10.1016/s1097-2765(01)00392-6. [DOI] [PubMed] [Google Scholar]
- 4.Luscombe NM, Austin SE, Berman HM, Thornton JM. Genome Biol. 2000;1:REVIEWS001. doi: 10.1186/gb-2000-1-1-reviews001. [DOI] [PMC free article] [PubMed] [Google Scholar]
- 5.Babu MM, Luscombe NM, Aravind L, Gerstein M, Teichmann SA. Curr Opin Struct Biol. 2004;14:283. doi: 10.1016/j.sbi.2004.05.004. [DOI] [PubMed] [Google Scholar]
- 6.Levine M, Tjian R. Nature. 2003;424:147. doi: 10.1038/nature01763. [DOI] [PubMed] [Google Scholar]
- 7.Itzkovitz S, Tlusty T, Alon U. BMC Genomics. 2006;7:239. doi: 10.1186/1471-2164-7-239. [DOI] [PMC free article] [PubMed] [Google Scholar]
- 8.Semenza GL. Transcription Factors and Human Diseases. Oxford University Press; London: 1998. [Google Scholar]
- 9.Derheimer FA, Chang CW, Ljungman M. Eur J Cancer. 2005;41:2569. doi: 10.1016/j.ejca.2005.08.012. [DOI] [PubMed] [Google Scholar]
- 10.Nebert DW. Toxicology. 2002;181–182:131. doi: 10.1016/s0300-483x(02)00269-x. [DOI] [PubMed] [Google Scholar]
- 11.Kohno K, Uchiumi T, Niina I, Wakasugi T, Igarashi T, Momii Y, Yoshida T, Matsuo K, Miyamoto N, Izumi H. Eur J Cancer. 2005;41:2577. doi: 10.1016/j.ejca.2005.08.007. [DOI] [PubMed] [Google Scholar]
- 12.Rosenbauer F, Tenen DG. Nat Rev Immunol. 2007;7:105. doi: 10.1038/nri2024. [DOI] [PubMed] [Google Scholar]
- 13.Venter JC, Adams MD, Myers EW, Li PW, Mural RJ, Sutton GG, Smith HO, Yandell M, Evans CA, Holt RA, Gocayne JD, Amanatides P, Ballew RM, Huson DH, Wortman JR, Zhang Q, Kodira CD, Zheng XH, Chen L, Skupski M, Subramanian G, Thomas PD, Zhang J, Gabor Miklos GL, Nelson C, Broder S, Clark AG, Nadeau J, McKusick VA, Zinder N, Levine AJ, Roberts RJ, Simon M, Slayman C, Hunkapiller M, Bolanos R, Delcher A, Dew I, Fasulo D, Flanigan M, Florea L, Halpern A, Hannenhalli S, Kravitz S, Levy S, Mobarry C, Reinert K, Remington K, Abu-Threideh J, Beasley E, Biddick K, Bonazzi V, Brandon R, Cargill M, Chandramouliswaran I, Charlab R, Chaturvedi K, Deng Z, Di Francesco V, Dunn P, Eilbeck K, Evangelista C, Gabrielian AE, Gan W, Ge W, Gong F, Gu Z, Guan P, Heiman TJ, Higgins ME, Ji RR, Ke Z, Ketchum KA, Lai Z, Lei Y, Li Z, Li J, Liang Y, Lin X, Lu F, Merkulov GV, Milshina N, Moore HM, Naik AK, Narayan VA, Neelam B, Nusskern D, Rusch DB, Salzberg S, Shao W, Shue B, Sun J, Wang Z, Wang A, Wang X, Wang J, Wei M, Wides R, Xiao C, Yan C, et al. Science. 2001;291:1304. [Google Scholar]
- 14.Latchman DS. Eukaryotic Transcription Factors. Academic Press; London: 2008. p. 29. [Google Scholar]
- 15.Tymms MJ, editor. Transcription Factor Protocols. Humana Press; Totowa, NJ: 2000. [Google Scholar]
- 16.McKnight SL, Lane MD, Gluecksohn-Waelsch S. Genes Dev. 1989;3:2021. doi: 10.1101/gad.3.12b.2021. [DOI] [PubMed] [Google Scholar]
- 17.Yamanaka R, Lekstrom-Himes J, Barlow C, Wynshaw-Boris A, Xanthopoulos KG. Int J Mol Med. 1998;1:213. doi: 10.3892/ijmm.1.1.213. [DOI] [PubMed] [Google Scholar]
- 18.Lekstrom-Himes J, Xanthopoulos KG. J Biol Chem. 1998;273:28545. doi: 10.1074/jbc.273.44.28545. [DOI] [PubMed] [Google Scholar]
- 19.Hanson RW. J Biol Chem. 1998;273:28543. doi: 10.1074/jbc.273.44.28543. [DOI] [PubMed] [Google Scholar]
- 20.Croniger C, Leahy P, Reshef L, Hanson RW. J Biol Chem. 1998;273:31629. doi: 10.1074/jbc.273.48.31629. [DOI] [PubMed] [Google Scholar]
- 21.Chih DY, Park DJ, Gross M, Idos G, Vuong PT, Hirama T, Chumakov AM, Said J, Koeffler HP. Exp Hematol. 2004;32:1173. doi: 10.1016/j.exphem.2004.08.014. [DOI] [PubMed] [Google Scholar]
- 22.Nerlov C. Trends Cell Biol. 2007;17:318. doi: 10.1016/j.tcb.2007.07.004. [DOI] [PubMed] [Google Scholar]
- 23.Akasaka T, Balasas T, Russell LJ, Sugimoto KJ, Majid A, Walewska R, Karran EL, Brown DG, Cain K, Harder L, Gesk S, Martin-Subero JI, Atherton MG, Bruggemann M, Calasanz MJ, Davies T, Haas OA, Hagemeijer A, Kempski H, Lessard M, Lillington DM, Moore S, Nguyen-Khac F, Radford-Weiss I, Schoch C, Struski S, Talley P, Welham MJ, Worley H, Strefford JC, Harrison CJ, Siebert R, Dyer MJ. Blood. 2007;109:3451. doi: 10.1182/blood-2006-08-041012. [DOI] [PubMed] [Google Scholar]
- 24.Jarrett HW. J Chromatogr. 1993;618:315. doi: 10.1016/0378-4347(93)80040-b. [DOI] [PubMed] [Google Scholar]
- 25.Jarrett HW, Taylor WL. J Chromatogr A. 1998;803:131. doi: 10.1016/s0021-9673(97)01257-0. [DOI] [PubMed] [Google Scholar]
- 26.Gadgil H, Jarrett HW. J Chromatogr A. 1999;848:131. doi: 10.1016/s0021-9673(99)00338-6. [DOI] [PubMed] [Google Scholar]
- 27.Gadgil H, Jarrett HW. J Chromatogr A. 2002;966:99. doi: 10.1016/s0021-9673(02)00738-0. [DOI] [PubMed] [Google Scholar]
- 28.Jurado LA, Drummond JT, Jarrett HW. Anal Biochem. 2000;282:39. doi: 10.1006/abio.2000.4599. [DOI] [PubMed] [Google Scholar]
- 29.Gadgil H, Oak SA, Jarrett HW. J Biochem Biophys Methods. 2001;49:607. doi: 10.1016/s0165-022x(01)00223-8. [DOI] [PubMed] [Google Scholar]
- 30.Mondal K, Gupta MN, Roy I. Anal Chem. 2006;78:3499. doi: 10.1021/ac0694066. [DOI] [PubMed] [Google Scholar]
- 31.Mondal K, Jain S, Teotia S, Gupta MN. Biotechnol Annu Rev. 2006;12:1. doi: 10.1016/S1387-2656(06)12001-3. [DOI] [PubMed] [Google Scholar]
- 32.Gadgil H, Jurado LA, Jarrett HW. Anal Biochem. 2001;290:147. doi: 10.1006/abio.2000.4912. [DOI] [PubMed] [Google Scholar]
- 33.Friedman M. The Chemistry and Biochemistry of the Sulfhydryl Group in Amino Acids, Peptides and Proteins. Pergamon Press; New York: 1973. [Google Scholar]
- 34.Tsien RY. Annu Rev Biochem. 1998;67:509. doi: 10.1146/annurev.biochem.67.1.509. [DOI] [PubMed] [Google Scholar]
- 35.Bradford MM. Anal Biochem. 1976;72:248. doi: 10.1016/0003-2697(76)90527-3. [DOI] [PubMed] [Google Scholar]
- 36.Laemmli UK. Nature. 1970;227:680. doi: 10.1038/227680a0. [DOI] [PubMed] [Google Scholar]
- 37.Jocelyn PC. Methods Enzymol. 1987;143:44. doi: 10.1016/0076-6879(87)43013-9. [DOI] [PubMed] [Google Scholar]
- 38.Riddles PW, Blakeley RL, Zerner B. Anal Biochem. 1979;94:75. doi: 10.1016/0003-2697(79)90792-9. [DOI] [PubMed] [Google Scholar]
- 39.Means GE, Feeney RE. Chemical Modification of Proteins. Holden-Day; San Francisco, CA: 1971. [Google Scholar]
- 40.Jarrett HW. Anal Biochem. 2000;279:209. doi: 10.1006/abio.2000.4489. [DOI] [PubMed] [Google Scholar]
- 41.Moxley RA, Jarrett HW. J Chromatogr A. 2005;1070:23. doi: 10.1016/j.chroma.2005.02.012. [DOI] [PubMed] [Google Scholar]
- 42.Matsuoka T, Zhao L, Artner I, Jarrett H, Friedman D, Means A, Stein R. Mol Cell Biol. 2003;23:6049. doi: 10.1128/MCB.23.17.6049-6062.2003. [DOI] [PMC free article] [PubMed] [Google Scholar]
- 43.Blier PR, Griffith AJ, Craft J, Hardin JA. J Biol Chem. 1993;268:7594. [PubMed] [Google Scholar]
- 44.Falzon M, Fewell JW, Kuff EL. J Biol Chem. 1993;268:10546. [PubMed] [Google Scholar]
- 45.Warshaw MM, Cantor CR. Biopolymers. 1970;9:1079. doi: 10.1002/bip.1970.360090910. [DOI] [PubMed] [Google Scholar]
- 46.Cantor CR, Warshaw MM, Shapiro H. Biopolymers. 1970;9:1059. doi: 10.1002/bip.1970.360090909. [DOI] [PubMed] [Google Scholar]
- 47.Pohl FM. Nature. 1976;260:365. doi: 10.1038/260365a0. [DOI] [PubMed] [Google Scholar]
- 48.Roger A, Ismail MA, Gore MG, editors. Spectrophotometry and Spectrofluorometry. Chapter 4 Oxford University Press; London: 2000. [Google Scholar]
- 49.Mitra S, Jarrett HW, Jurado LA. J Chromatogr A. 2005;1076:71. doi: 10.1016/j.chroma.2005.04.019. [DOI] [PubMed] [Google Scholar]


