Abstract
Focal adhesion kinase (FAK), a non-receptor tyrosine kinase, has recently been implicated in the regulation of insulin resistance in vitro. However, its in vivo validation has not been attempted due to lethality of FAK knockout. Hence, to ascertain the role of FAK in the development of insulin resistance in vivo, we have down-regulated FAK expression by delivering FAK-specific small interfering RNA (siRNA) in mice using hydrodynamic tail vein injection. Here, we show for the first time that FAK silencing (57 ± 0.05% in muscle and 80 ± 0.08% in liver) exacerbates insulin signalling and causes hyperglycaemia (251.68 ± 8.1 mg dl−1) and hyperinsulinaemia (3.48 ± 0.06 ng ml−1) in vivo. FAK-silenced animals are less glucose tolerant and have physiological and biochemical parameters similar to that of high fat diet (HFD)-fed insulin-resistant animals. Phosphorylation and expression of insulin receptor substrate 1 (IRS-1) was attenuated by 40.2 ± 0.03% and 35.2 ± 0.6% in muscle and 52.3 ± 0.04% and 40.2 ± 0.03% in liver in FAK-silenced mice. Akt-Ser473-phosphorylation decreased in muscle and liver (50.3 ± 0.03% and 70.2 ± 0.02%, respectively) in FAK-silenced mice. This, in part, explains the mechanism of development of insulin resistance in FAK-silenced mice. The present study provides direct evidence that FAK is a crucial mediator of insulin resistance in vivo. Considering the lethality of FAK gene knockout the approach of this study will provide a new strategy for in vivo inhibition of FAK. Furthermore, the study should certainly motivate chemists to synthesize new chemical entities for FAK activation. This may shed light on new drug development against insulin resistance.
Insulin resistance of target organs, principally liver and muscle, is a major feature of the pathological manifestation associated with diabetes (Le Roith & Zick, 2001; Petersen & Shulam, 2006). Skeletal muscle accounts for 80% of total glucose disposal under insulin-stimulated conditions (Ryder et al. 2001). Defects in skeletal muscle insulin action precede clinical diagnosis of insulin resistance (Kruszynska & Olefsky, 1996). Focal adhesion kinase (FAK) is a cytoplasmic, non-receptor tyrosine-phosphorylated protein kinase present within focal adhesion contact sites in normal cells (Schlaepfer & Mitra, 2004). We have recently reported that modulation of FAK expression regulates insulin sensitivity of skeletal muscle cells (Bisht et al. 2007). The activity of FAK is abnormally decreased in insulin resistant skeletal muscle cells and inhibition of FAK expression interferes with insulin action. In addition, recently Huang et al. (2006) has reported that FAK regulates insulin-mediated cytoskeletal rearrangement essential for normal glucose transport and glycogen synthesis in skeletal muscle cells. The role of FAK in regulation of glycogen synthesis in HepG2 cells and hepatic insulin signalling in vitro has also been reported (Cheung et al. 2000; Huang et al. 2002). Nevertheless, in order to establish the role of FAK as such in the in vivo situation, knowledge gained from in vitro studies needs to be extended to examine FAK action in animal models. Thus, considering the role of FAK in hepatocytes and skeletal muscle cells in vitro, we sought to determine whether FAK plays a crucial role in the development of insulin resistance in vivo. In this study, we demonstrate that FAK functions as a positive regulator of insulin action as inhibition of FAK causes impaired insulin signalling resulting to whole body insulin resistance generation. The study therefore established a novel role of FAK in the regulation of glucose homeostasis in vivo for the first time and provides opportunities for developing new therapeutic strategies against insulin resistance.
Methods
Animals
Male Swiss albino mice, 5 weeks old, weighing 10–11 g, were procured from a central animal facility of the institute. The animals were randomly divided into four groups based on body weight, which were not significantly different. First group (n = 6) was untreated control; the second group was subjected to injection of saline only; the third group was injected with scrambled siRNA (in saline); and the fourth group was injected with siRNA (in saline) of FAK. The animals were kept in controlled environmental conditions (room temperature 22 ± 2°C, humidity 55 ± 5% and 12 h light–dark cycles). Mice were fed with commercially available rodent pellet diet (Pranav Agro Industries, New Delhi, India) and water was provided ad libitum. Body weight, food intake and water intake were monitored every 3 days for 2 weeks. Food was pre-weighed before feeding and the leftover feed was weighed 3 days after. Mice were killed by cervical dislocation. The experimental protocol was approved by the Institutional Animal Ethics Committee (IAEC) and the animal experiments were carried out in accordance with guidelines of the Committee for the Purpose of Control and Supervision of Experiments on Animals (CPCSEA), Government of India.
siRNA treatment in vivo
siRNA was delivered into mice using a hydrodynamic tail-vein injection method, by which 2500 nm siRNA dissolved in 1.2 ml of saline were rapidly injected into the tail vein (Liu et al. 1999). Swiss albino mice (Ghosh et al. 1994; Brown et al. 2000) weighing 10–11 g were injected by a hydrodynamic-based procedure where increasing amounts of siRNA (500, 1500 and 2500 nm), against the FAK targeted sequence 5′-TGCAATGGA-ACGAGTATTAAA-3′, dissolved in 1.2 ml of saline were injected into the tail-vein over less than 5 s. siRNA-treated and control mice of similar body weights were monitored under the same conditions until the end of the experiments.
Preparation of tissue homogenates and Western immunoblotting
Animals were humanely sacrificed and various organs (liver, skeletal muscle, kidney and spleen) were collected. Tissues were washed with ice-cold PBS and lysed in lysis buffer as previously described (Goel & Dey, 2000). Homogenates were centrifuged at 16 000 g at 4°C for 30 min. Protein estimations were performed using the Bicinchoninic Acid Kit (Sigma Chemical Company, USA) as per manufacturer's instructions. Lysates were boiled with Laemmli sample buffer (Tris-HCl 62.5 mm, pH 6.7, glycerol 10% (v/v), SDS 2% (w/v), bromophenol blue 0.002% (w/v) containing β-merceptoethenol 143 mm) for 5 min, resolved by SDS-PAGE gel electrophoresis and transferred to nitrocellulose membrane. Membranes were blocked with BSA (5%) and incubated with the indicated primary antibodies for 12–16 h, followed by 1 h incubation with alkaline phosphatase-conjugated secondary antibody. The protein bands were visualized with 5-Bromo-4-chloro-3-indolol-phosphate/4-Nitro blue tetrazoilum chloride (BCIP/NBT) as substrates.
Immunoprecipitation
Tissues were lysed and the lysates were clarified by centrifugation at 60 000 g for 10 min at 4°C. Protein (300–500 μg) was immunoprecipitated with primary antibody and protein A agarose beads by incubating overnight at 4°C. Precipitates were washed 3 times with lysis buffer, supernatants were removed and pellet was resuspended in SDS-PAGE sample buffer. Proteins were separated in SDS-PAGE.
Biochemical measurements
Blood samples were collected from tail vein/retro orbital sinus into heparinized (200 IU ml−1) tubes and immediately centrifuged at 1000 g for 10 min for the separation of plasma. Plasma was stored at −20°C until assayed. Plasma was used for estimation of glucose (AutoZyme blood glucose kit, Accurex Biomedical, India), triglyceride (Sigma) and insulin (mouse insulin ELISA kit, Linco research, St Charles, MO, USA) and TNF-α (mouse TNF ELISA Kit, BD Biosciences, San Diego, CA, USA) by commercial kits as per manufacturer's instructions.
Glucose tolerance test
All the animals were fasted overnight prior to performing glucose tolerance tests at the end of 2 weeks. Blood samples were collected at 0, 30, 60 and 120 min after oral administration of glucose (2 g kg−1 (10 ml)−1) for the determination of plasma glucose and insulin concentration.
Densitometric analysis
Densitometric analyses of Western immunoblots were performed using Gel Doc 2000 (Bio-Rad, Hercules, CA, USA) equipped with Quantity One 1-D analysis software. The relative values of samples were determined by giving an arbitrary value of 1.0 to the respective control samples of each experiment, keeping background value as 0.
Statistical analysis
Data are expressed as mean ±s.e.m. For comparison of two groups, P values were calculated by two-tailed Student's unpaired t test. Differences over time (glucose tolerance test (GTT) and time course), i.e. more than two groups, were compared by two-way ANOVA. In all cases, P < 0.05 was considered to be statistically significant.
Results
In vivo silencing of FAK expression using siRNA
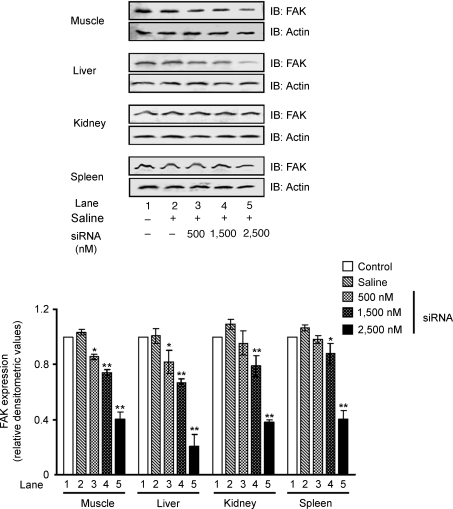
In order to reveal the role of FAK in the development of insulin resistance, FAK expression was silenced using the RNA interference (RNAi) approach. At first we determined the concentration of siRNA needed to induce RNAi in vivo. The expression of FAK was examined in major insulin target organs (liver, muscle, kidney and spleen) after 24 h of injection. A dose-dependent inhibition of FAK expression was observed with maximum inhibition in muscle (57 ± 0.05%) and liver (80 ± 0.08%) in mice treated with 2500 nm siRNA (Fig. 1, lane 5 versus lane 1, P < 0.01, respectively). FAK expression was also found to be significantly inhibited in other organs (Fig. 1). No significant inhibition was observed in mice injected with vehicle alone (Fig. 1, lane 2 versus lane 1). No change in expression was observed in an unrelated protein, actin, under the same conditions (Fig. 1). As significant inhibition was observed at 2500 nm, a higher concentration of siRNA was not used to avoid pleotropic effects, as it would result in a FAK null lethal condition. Results indicate a dose-dependent inhibition of FAK expression by hydrodynamic tail vein injection of FAK siRNA.
Figure 1. Inhibition of FAK expression by siRNA.
Effect of dose on the interfering efficiency of siRNA: male mice (Swiss albino; 10–11 g) were injected with various amounts of siRNA in 1.2 ml saline within 5 s. The level of FAK expression was determined 24 h after injection in muscle, liver, kidney and spleen. Upper panel: Western immunoblots for FAK, stripped and reprobed with actin. Lower panel: relative densitometric values of FAK expression normalized to the amount of protein loaded. Data are shown as means ±s.e.m. (n = 5). *P < 0.05, **P < 0.01. IB, immunoblotting.
Longevity of RNA interference induced by FAK-specific siRNA
To determine the longevity of RNAi induced by siRNA, mice were injected with 2500 nm of siRNA per animal on day zero. The groups were sacrificed at different days (as indicated) up to 1 week, after injection, with five mice per time point. FAK expression remained significantly silenced up to 6 days after injection in muscle and liver of mice (Supplementary Fig. 1, lane 7 versus lane 1); however, expression started restoring after 6 days (data not shown). Data indicate that the effect of RNAi significantly persists for 6 days after siRNA delivery.
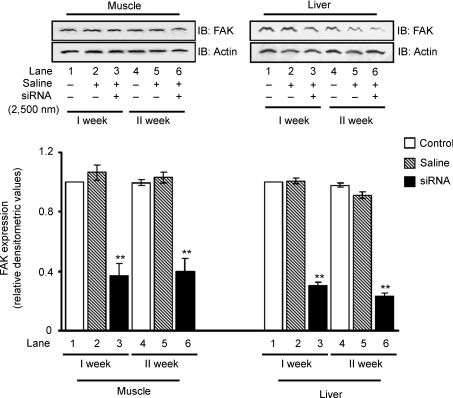
However, to determine whether expression of FAK can be kept down-regulated by repeated treatment of siRNA, the sixth day after the first injection, a second injection was given and the expression of FAK was studied. Data showed that FAK expression remained inhibited as a result of the second injection of siRNA in liver and muscle (Fig. 2). Data demonstrate that FAK silencing in vivo in insulin-sensitive tissues remained up to at least 2 weeks by repeated injections.
Figure 2. RNA interference at different time points.
Three groups of mice (10–11 g) were injected with 2500 nm siRNA in 1.2 ml saline. Animals were sacrificed at first and second week after injection. Expression of FAK in the muscle and liver were examined. Upper panel: Western immunoblots of FAK stripped and reprobed with actin. Lower panel: relative densitometric values of FAK expression normalized with the amount of protein loaded. Data are shown as means ±s.e.m. (n = 5). **P < 0.01. IB, immunoblotting.
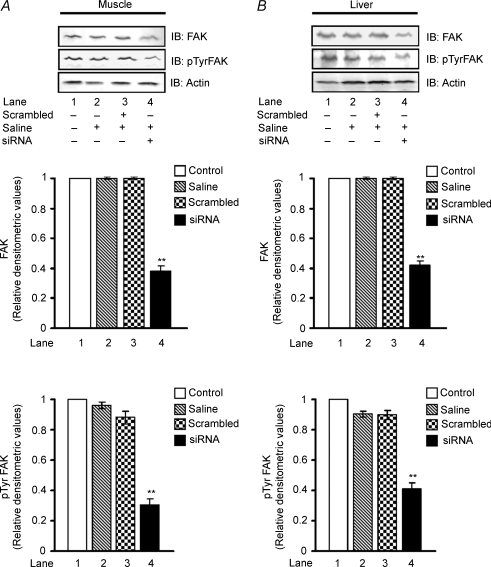
In order to determine the specificity of FAK siRNA, similar injections (2500 nm) were given to animals for 2 weeks with non-specific scrambled siRNA (5′-CGUACGCGGAAUACUUCGATT-3′, 5′-UCGAA-GUAUUCCGCGUACGTT-3′) and were examined for FAK expression in muscle and liver. No change in FAK expression was observed in animals injected with scrambled siRNA against the inhibition observed in animals injected with FAK specific siRNA (Fig. 3A and B; lane 3 versus lane 1). Further, we investigated whether the reduced protein concentration is associated with reduced activity of the kinase. The tyrosine phosphorylation of FAK was examined after 2 weeks of FAK-specific and scrambled siRNA injection. A decreased tyrosine phosphorylation of FAK was observed in both muscle and liver of FAK-silenced mice, concomitant to its expression (Fig. 3A and B, lane 4 versus lane 1). No significant inhibition of FAK was observed in animals injected with scrambled siRNA indicating specificity of FAK silencing (Fig. 3A and B, lane 3 versus lane 1).
Figure 3. Specificity of FAK-specific siRNA.
Four groups of mice (10–11 g) were injected with 2500 nm of FAK-specific and scrambled siRNA in 1.2 ml saline. Animals were killed after the second week of injection and were examined for FAK expression and tyrosine phosphorylation in the muscle (A) and liver (B). Upper panel: Western immunoblots of FAK stripped and reprobed with pTyr FAK and actin. Middle panel: relative densitometric values of FAK expression normalized with the amount of protein loaded. Lower panel: relative densitometric values of FAK phosphorylation normalized to the amount of protein loaded. Data are shown as means ±s.e.m. (n = 5). **P < 0.01. IB, immunoblotting.
In vivo silencing of FAK expression affects physiological parameters of FAK-silenced animals
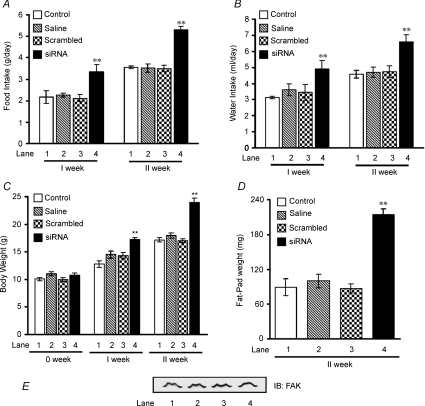
To investigate the effect of in vivo FAK silencing on development of whole body insulin resistance, two groups of mice (n = 6) were injected with 2500 nm of FAK-specific or scrambled siRNA per animal on day zero. The first group (n = 6) was sacrificed after 6 days. The second group (n = 6) was injected with the same amount of siRNA for the second time on day 6. After 2 weeks, mean food and water intake of FAK-silenced mice was significantly more (51.1 ± 0.28% and 46.6 ± 0.20%, P < 0.01, respectively) than their control counterparts (Fig. 4A, lane 4 versus lane 1 and Fig. 4B, lane 4 versus lane 1). Up to the first week of FAK silencing, mice gained 35.8 ± 0.75% more weight than controls (Fig. 4C, lane 4 versus lane 1, P < 0.01), which further increased to 40.3 ± 1.75% by the end of the second week (Fig. 4C, lane 4 versus lane 1, P < 0.01). No change in food and water intake or body weight was observed in animals injected either with saline (Fig. 4A, B and C, lane 2 versus 1) or with scrambled siRNA (Fig. 4A, B and C, lane 3 versus 1) as compared to normal control group.
Figure 4. Insulin resistance in FAK-silenced mice.
Male mice (Swiss albino; 10–11 g) were injected with 2500 nm of siRNA on day zero and then divided into two groups. The first groups of animals were sacrificed at the appropriate time (after 1 week) without receiving an additional injection. The rest of the animals received an additional injection of the same amount of siRNA on day 6 and were sacrificed 1 week there after (2 week). Effect of FAK silencing on food intake (A), water intake (B), body weight (C), epididymal fat-pad weight (D) and expression of FAK in adipose tissue (E) after 2 weeks of siRNA injection. Lane 1, control; lane 2, saline; lane 3, scrambled; and lane 4, siRNA. Data are shown as means ±s.e.m. (n = 6). **P < 0.01.
We next assessed whether differences in weight gain were related to alterations in adiposity. The epididymal fat-pad weights, which are highly representative of body fat, measured at 2 weeks, were higher in the FAK-silenced group (Fig. 4D) than controls and could also be visualized morphologically (Supplementary Fig. 2). To examine the possibility, if any, of FAK silencing in adipose tissue as a result of siRNA injection, FAK expression was examined in adipose tissues. No change in FAK expression was observed in epididymal adipose tissue as a result of FAK silencing (Fig. 4E). Data indicate an increase in body weight of mice due to increased fat mass resulting from enhanced food intake.
It has been postulated that a high level of triglycerides in the circulation due to peripheral insulin resistance leads to fatty liver (Nagle et al. 2007). Examination of liver from FAK-silenced mice reveals marked hepatomegaly (Supplementary Fig. 3A), concomitant with increased liver weight (Supplementary Fig. 3B). The observation supports development of fatty liver; however, further studies are warranted. Thus, observations suggest plausibility of generation of insulin resistance in FAK-silenced mice.
In vivo silencing of FAK expression affects biochemical parameters of FAK-silenced animals
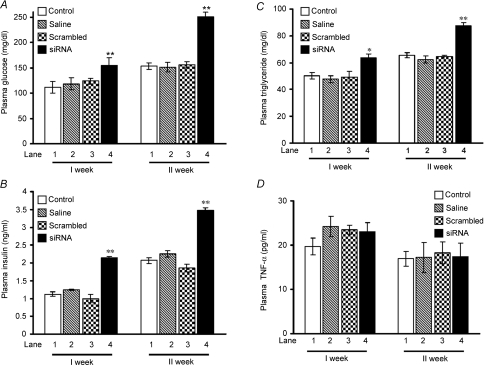
Insulin resistance is characterized by hyperglycaemia, due to reduced glucose utilization, and compensatory hyperinsulinaemia. Hence, we next examined the role of endogenous FAK in glucose homeostasis. A significantly higher plasma glucose concentration (64.1 ± 5.0%) and plasma insulin level (68.3 ± 0.12%) was observed in FAK-silenced mice than control littermates after the second week of siRNA injection (Fig. 5A, lane 4 versus lane 1, P < 0.01 and Fig. 5B, lane 4 versus lane 1, P < 0.01) suggesting the development of hyperglycaemia and hyperinsulinaemia. Increased body weight with adiposity and the existence of mild hyperglycaemic levels along with hyperinsulinaemia in siRNA-treated mice clearly indicates development of insulin resistance as a consequence of FAK silencing. According to Randel's glucose–fatty acid cycle, the body favours excess lipid stores to glucose for metabolic oxidation in insulin resistance (Randel et al. 1963). To further establish this fact, the triglyceride levels in blood plasma of FAK-silenced mice were examined. The triglyceride level of FAK-silenced mice exhibited a 3.5 ± 0.11% increase as compared to controls (Fig. 5C, lane 4 versus lane 1, P < 0.01). No significant change in plasma glucose, insulin or triglyceride levels in animals injected with saline (Fig. 5A, B and C, lane 2 versus 1) or with scrambled siRNA (Fig. 5A, B and C, lane 3 versus 1) was observed. Data indicate that due to the inability of peripheral tissue to undertake glucose uptake, triglyceride was stored in the form of fat that was later mobilized to provide energy to these tissues. Data prove FAK silencing causes insulin resistance.
Figure 5. Effect of FAK silencing on insulin resistance generation in FAK-silenced mice.
Male mice (Swiss albino; 10–11 g) were injected with 2500 nm of siRNA on day zero and then divided into two groups. The first groups of animals were sacrificed after 1 week without receiving an additional injection. The rest of the animals received an additional injection of the same amount of siRNA on day 6 and were killed 1 week there after (2 week). Biochemical measurements of plasma glucose (A), plasma insulin (B), plasma triglyceride (C) and plasma TNF-α (D) in mice that had been treated with 2 injections of FAK siRNA at a weekly interval for 2 weeks. Data are shown as means ±s.e.m. (n = 6). *P < 0.05, **P < 0.01.
In order to investigate the possibility that some of the observed effects in FAK-silenced mice were due to the inflammation caused by siRNA injections, we measured the level of tumour necrosis factor (TNF)-α, a pro-inflammatory cytokine and an important contributor to the development of insulin resistance (Shoelson et al. 2006; Solinas et al. 2007) under FAK-silenced conditions. No significant change in the level of plasma TNF-α was observed under any conditions tested (Fig. 5D), thus eliminating the possibility of inflammatory responses.
In vivo silencing of FAK expression results in impaired insulin sensitivity
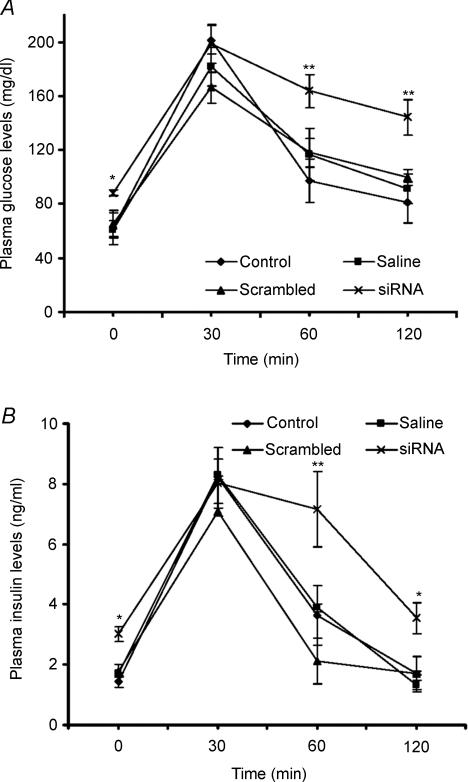
To determine whole body sensitivity to insulin in FAK-deficient mice, the glucose tolerance test (GTT) was carried out. GTT revealed that mice deficient in FAK were moderately glucose intolerant as compared to controls. The plasma glucose and corresponding insulin levels remained significantly elevated at 60 min (139.5 mg dl−1, P < 0.01 and 7.1 ng ml−1, P < 0.01) and 120 min (106.04 mg dl−1, P < 0.01 and 3.55 ng ml−1, P < 0.05) post-glucose administration as compared to control levels (Fig. 6A and B). Fasting glucose and insulin levels in FAK-silenced mice before a glucose challenge at 0 min were observed to be significantly elevated as compared to control (P < 0.05). However, no significant differences were observed in animals injected with either saline or scrambled siRNA (Fig. 6A and B) as compared to controls.
Figure 6. Effect of FAK silencing on glucose tolerance.
Male mice (Swiss albino, 10–11 g weight) were injected with 2500 nm of siRNA for 2 weeks. The glucose tolerance tests (GTT) were performed after 16 h of starvation. (A), blood plasma glucose levels after glucose administration at different time intervals. (B), blood plasma insulin levels after glucose administration at different time intervals. Data are shown as means ±s.e.m. (n = 6). *P < 0.05, **P < 0.01.
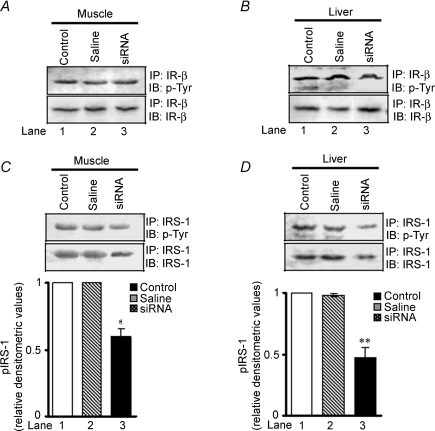
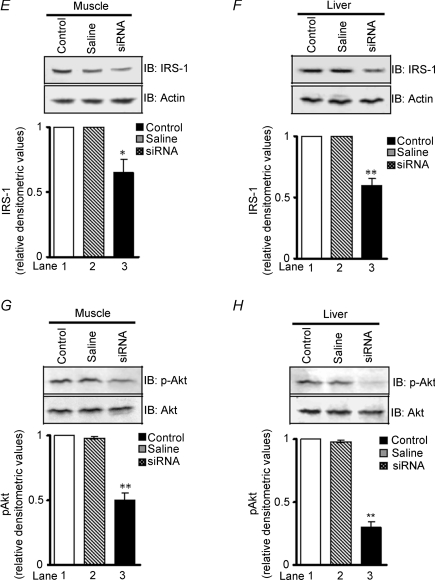
To determine the possible pathway of FAK-regulated insulin resistance, we evaluated insulin receptor-β (IR-β) tyrosine phosphorylation and expression in muscle and liver, of control and FAK-silenced mice. No significant change in activation and expression of IR-β due to down-regulation of FAK was observed (Fig. 7A and B, upper panels). This observation correlates with a previous report that suggests FAK interacts with IRS-1 but not with IR (Annabi et al. 2001). Therefore, IRS-1 tyrosine phosphorylation and expression was examined. Phosphorylation of IRS-1 was attenuated by 40.2 ± 0.03% in muscle (Fig. 7C, lane 3 versus 1, P < 0.05, middle panel) and 52.3 ± 0.04% in liver (Fig. 7D, lane 3 versus 1, P < 0.01, middle panels) in FAK-silenced mice as compared with controls. Interestingly, expression of IRS-1 was found to be decreased by 35.2 ± 0.6% and 40.2 ± 0.03% in muscle and liver, respectively (Fig. 7E, lane 3 versus 1, P < 0.05 and Fig. 7F, lane 3 versus 1, P < 0.01, lower panels). Concomitantly, in FAK-silenced mice a decrease in Akt-Ser473-phosphorylation was seen in both muscle and liver (50.3 ± 0.03% and 70.2 ± 0.02%, lane 3 versus 1, P < 0.01, respectively) compared with control mice (Fig. 7G and H).
Figure 7. Effect of FAK silencing on insulin signalling.
After treatment with FAK siRNA, cell extracts were obtained from insulin target tissues (muscle and liver) in mice; then expression and phosphorylation of IR-β (A and B), IRS-1 (C, D, E and F) and Akt (G and H) in muscle and liver after second week of injection were measured. Akt blots were stripped and reprobed with actin. Upper panels: IR-β phosphorylation and expression in muscle and liver. Middle panels: IRS-1 phosphorylation in muscle and liver. Lower panels: IRS-1 expression in muscle and liver. Data are shown as means ±s.e.m. (n = 6). *P < 0.05, **P < 0.01. IP, immunoprecipitated; IB, immunoblotted.
Discussion
In the present study we have reported a novel role of FAK in the development of insulin resistance in vivo. Novelty of the study is that significant inhibition of FAK expression in liver and muscle results in whole body insulin resistance.
Knockout studies have proved very useful to break down pathophysiology and genetics of insulin resistance (Mauvais-Jarvis et al. 2002; Kahn, 2003). Unfortunately, FAK-deficient mice are embryonicaly lethal (Zachary, 1997), which precludes the study of a role of FAK in the mammalian insulin signalling pathway in a whole animal setting. Recently, an endothelial cell (EC)-specific knockout of FAK using a Cre-loxP approach has been reported (Shen et al. 2005). Hakim et al. (2007) has also reported another conditional knockout of FAK in nkx2–5-expressing cells ‘termed FAKnk mice’. However, FAKnk mice died shortly after birth. In contrast to total FAK knockouts, conditional knockouts to some extent facilitate the exploration of the unaddressed issues regarding FAK. However, due to lethality of FAK-null mice understanding its biological functions, activation and its interactions with other signalling molecules in vivo remains unaddressed and offers an exciting challenge.
RNAi has been used in vivo for target validation studies (Dorsett & Tuschl, 2004; Zhou et al. 2004). This allows the transient knockdown of lethal genes that would otherwise prevent the investigation of their functions in postnatal animals and also prevent pleiotropic side-effects that could occur in global-knockout animals. Therefore, to elucidate the biological function of FAK in the development of insulin resistance, the RNAi approach has been used to transiently knock-down the lethal FAK gene in mice by hydrodynamic tail vein injection. After McCaffrey et al. (2002) provided the first proof-of-concept for gene silencing by siRNAs and shRNAs in vivo, several reports have appeared using this technique to deliver siRNA to various organs in mice and rats for more than half a decade now (Liu et al. 1999; Yang et al. 2002; Xia et al. 2002; Dagnæs-Hansen et al. 2002; McCaffrey et al. 2002; He et al. 2004; Braasch et al. 2004; Bradley et al. 2005; Xu et al. 2005; Dykxhoorn et al. 2006; Zhu et al. 2006; De Souza et al. 2006; Lewis & Wolff, 2007; Fukushima et al. 2007). The technique is elegant and effective and does not require any specialized equipment or surgical expertise. The hydrodynamic tail vein injection has been used successfully in mouse models for various metabolic diseases (Dagnæs-Hansen et al. 2002; He et al. 2004; Xu et al. 2005; Zhu et al. 2006; De Souza et al. 2006; Lewis & Wolff, 2007). Bradley et al. (2005) reported successful introduction of siRNA against the insulin 2 (Ins2) gene directly into pancreatic islets cells. This may be advantageous in scenarios designed to treat diabetes. Fukushima et al. (2007) reported hydrodynamic tail vein-based delivery of adiponectine to treat type I diabetes. Similarly, against hepatitis B virus (HBV), the technique has been utilized to deliver siRNA against the HBV genome (Yang et al. 2002). Among different approaches used for siRNA delivery, viral vectors though effective in cell line based experiments (Xia et al. 2002), may generate immune responses in the animal model. Therefore, considering the efficiency and ease of use, hydrodynamic tail-vein injection involving rapid injection of a large volume was used to facilitate siRNA delivery in vivo (Lewis et al. 2002). This enables siRNA to get into cells in highly vascularized organs (Liu et al. 1999; Dykxhoorn et al. 2006).
Utilizing this technique we were able to significantly knock down FAK expression in both liver and muscle, key organs in the regulation of whole body glucose homeostasis. We were able to achieve as high as ∼80% knock down at a concentration of 2500 nm siRNA dissolved in 1.2 ml of saline. As reported in the literature, for effective delivery the volume of the vehicle should be 10–12% of the body weight (Liu et al. 1999; Lewis et al. 2002). Since significant inhibition was already observed with 2500 nm, a higher concentration of siRNA was not used, to avoid pleotropic effects as it would result in a FAK-null-lethal condition. We did not observe any negative effects after the hydrodynamic injection, even after multiple injections. No morbidity or mortality was observed due to tail vein injection. As reported previously, mice or rats fed a high-fat diet for 2 weeks resulted in the development of insulin resistance (Zierath et al. 1997; Srinivasan et al. 2005); in the present study insulin resistance was developed within 2 weeks, without any dietary interventions.
In vivo FAK silencing affects physiological parameters significantly. The food and water intake and gained weight of FAK-silenced mice were significantly more than the wild type littermates. It has been previously reported that hypothalamus lesions of an electrical, chemical or gene deletion in nature produces an almost immediate increase in food intake and circulating insulin, which increases lipid deposition and causes peripheral insulin resistance (Bergen et al. 1998; Butler & Cone, 2002). However, in the present study no change between control and animals injected with vehicle or scrambled siRNA was observed. Moreover, hydrodynamic tail vein injection is reported to transfect cells of vascularized organs near to the inferior vena cava, e.g. liver and spleen (Dykxhoorn et al. 2006). No report on transfection of brain cells has been reported. This eliminates the possibility that hydrodynamic siRNA delivery had a direct impact at the level of the hypothalamus but might be consequent upon impaired insulin signalling or insufficient glucose utilization at the periphery by FAK inhibition.
There are reports indicating that activation of the inflammatory pathway may lead to the development of insulin resistance (Arkan et al. 2005; Cai et al. 2005). However, compared to wild type littermates, no significant change in either physiological or biochemical parameters were observed in mice injected with scrambled siRNA. Moreover, no change in TNF-α concentration was observed. These data therefore indicate that no inflammatory response was activated in animals due to siRNA injection. Hence inflammation or an immune response did not contribute to insulin resistance.
In order to explore the molecular mechanism whereby FAK silencing develops insulin resistance leading to hyperglycaemia and hyperinsulinaemia, FAK was observed to regulate IRS-1 and Akt activity; however, IR-β remained unaffected. The data are in accordance with our in vitro study (Bisht et al. 2007). Interestingly, IRS-1 expression was also found to be inhibited in FAK-silenced animals. This observation was supported by the study of Lebrun et al. (2000), according to which no IRS-1 expression was observed in FAK−/− fibroblasts. However, in our previous study on skeletal muscle cells, we did not observe such a change (Bisht et al. 2007). This could be due to differences in in vivo regulation. Hence, impaired insulin signalling, increased body weight, food and water intake, elevated glucose, insulin and triglyceride levels under physiological insulin levels, in two major insulin-sensitive organs due to FAK silencing reveals the rationale for the development of insulin resistance.
The present study provides strong evidence for an important role of FAK in glucose homeostasis. This occurs possibly via key insulin signalling proteins in vivo. Interestingly, development of insulin resistance and hyperglycaemia in mice substantially lacking in endogenous FAK correlates well with that of high-fat-diet-induced resistant animals (Zierath et al. 1997). We suggest that selective activation/overexpression of FAK presents an attractive opportunity for the treatment of insulin resistance, an ever increasing epidemic of the 21st century.
Acknowledgments
B.B. is the recipient of a Senior Research Fellowship from the Council of Scientific and Industrial Research, Government of India, New Delhi. R. Singh is acknowledged for his assistance in the laboratory and animal handling. This study was also supported by a grant from the Department of Biotechnology, Government of India, New Delhi to C.S.D. (BT/PR3994/MED/14/498/2004).
Author's contributions
B.B. designed and executed experiments, analysed data and drafted the manuscript. K.S. (veterinarian) performed the hydrodynamic tail vein injection, glucose tolerance test, blood/organ collection and animal care. C.S.D. conceived the study, designed, coordinated experiments, wrote and finalized the manuscript.
Supplementary material
Online supplemental material for this paper can be accessed at: http://jp.physoc.org/cgi/content/full/jphysiol.2008.157107/DC1
References
- Annabi SE, Gautier N, Baron V. Focal adhesion kinase and Src mediate integrin regulation of insulin receptor phosphorylation. FEBS Lett. 2001;507:247–252. doi: 10.1016/s0014-5793(01)02981-7. [DOI] [PubMed] [Google Scholar]
- Arkan MC, Hevener AL, Greten FR, Maeda S, Li Z-W, Long JM, Wynshaw-Boris A, Poli G, Olefsky JM, Karin M. IKK-β links inflammation to obesity-induced insulin resistance. Nat Med. 2005;11:191–198. doi: 10.1038/nm1185. [DOI] [PubMed] [Google Scholar]
- Bergen HT, Mizuno TM, Taylor J, Mobbs CV. Hyperphagia and weight gain after gold-thioglucose: relation to hypothalamic neuropeptide Y and proopiomelanocortin. Endocrinology. 1998;139:4483–4488. doi: 10.1210/endo.139.11.6324. [DOI] [PubMed] [Google Scholar]
- Bisht B, Goel HL, Dey CS. Focal adhesion kinase regulates insulin resistance in skeletal muscle. Diabetologia. 2007;50:1058–1069. doi: 10.1007/s00125-007-0591-6. [DOI] [PubMed] [Google Scholar]
- Braasch DA, Paroo Z, Constantinescu A, Ren G, Oz OK, Mason RP, Corey DR. Biodistribution of phosphodiester and phosphorothioate siRNA. Bioorg Med Chem Lett. 2004;14:1139–1143. doi: 10.1016/j.bmcl.2003.12.074. [DOI] [PubMed] [Google Scholar]
- Bradley SP, Kowalik TF, Rastellini C, da Costa MA, Bloomenthal AB, Cicalese L, Basadonna GP, Uknis ME. Successful incorporation of short-interfering RNA into islet cells by in situ perfusion. Transplant Proc. 2005;37:233–236. doi: 10.1016/j.transproceed.2004.12.181. [DOI] [PubMed] [Google Scholar]
- Brown JA, Chua CC, Jr, Liu SM, Andrews MT, Vandenberg JG. Spontaneous mutation in the db gene results in obesity and diabetes in CD-1 outbred mice. Am J Physiol Regul Integr Comp Physiol. 2000;278:R320–R330. doi: 10.1152/ajpregu.2000.278.2.R320. [DOI] [PubMed] [Google Scholar]
- Butler AA, Cone RD. The melanocortin receptors: lessons from knockout models. Neuropeptides. 2002;36:77–84. doi: 10.1054/npep.2002.0890. [DOI] [PubMed] [Google Scholar]
- Cai D, Yuan M, Frantz DF, Melendez PA, Hansen L, Lee J, Shoelson SE. Local and systemic insulin resistance resulting from hepatic activation of IKK-β and NF-κB. Nat Med. 2005;11:183–190. doi: 10.1038/nm1166. [DOI] [PMC free article] [PubMed] [Google Scholar]
- Cheung AT, Wang J, Ree D, Kolls JK, Bryer-Ash M. Tumor necrosis factor-α induces hepatic insulin resistance in obese Zucker (fa/fa) rats via interaction of leukocyte antigen-related tyrosine phosphatase with focal adhesion kinase. Diabetes. 2000;49:810–819. doi: 10.2337/diabetes.49.5.810. [DOI] [PubMed] [Google Scholar]
- Dagnæs-Hansen F, Holst HU, Søndergaard M, Vorup-Jensen T, Flyvbjerg A, Jensen UB, Jensen TG. Physiological effects of human growth hormone produced after hydrodynamic gene transfer of a plasmid vector containing the human ubiquitin promoter. J Mol Med. 2002;80:665–670. doi: 10.1007/s00109-002-0371-1. [DOI] [PubMed] [Google Scholar]
- De Souza AT, Dai X, Spencer AG, Reppen T, Menzie A, Roesch PL, He Y, Caguyong MJ, Bloomer S, Herweijer H, Wolff JA, Hagstrom JE, Lewis DL, Linsley PS, Ulrich RG. Transcriptional and phenotypic comparisons of Ppara knockout and siRNA knockdown mice. Nucl Acids Res. 2006;34:4486–4494. doi: 10.1093/nar/gkl609. [DOI] [PMC free article] [PubMed] [Google Scholar]
- Dorsett Y, Tuschl T. siRNAs: application in functional genomics and potential as therapeutics. Nat Rev. 2004;3:318–327. doi: 10.1038/nrd1345. [DOI] [PubMed] [Google Scholar]
- Dykxhoorn DM, Palliser D, Lieberman J. The silent treatment: siRNA as small molecule drugs. Gene Ther. 2006;13:541–552. doi: 10.1038/sj.gt.3302703. [DOI] [PubMed] [Google Scholar]
- Fukushima M, Hattori Y, Tsukada H, Koga K, Kajiwara E, Kawano K, Kobayashi T, Kamata K, Maitani Y. Adiponectin gene therapy of streptozotocin-induced diabetic mice using hydrodynamic injection. J Gene Med. 2007;9:976–985. doi: 10.1002/jgm.1104. [DOI] [PubMed] [Google Scholar]
- Ghosh R, Mukherjee B, Chatterjee M. A novel effect of selenium on streptozotocin-induced diabetic mice. Diabetes Res. 1994;25:165–171. [PubMed] [Google Scholar]
- Goel HL, Dey CS. PKC-regulated myogenesis is associated with increased tyrosine phosphorylation of FAK, Cas, and paxillin, formation of Cas-CRK complex, and JNK activation. Differentiation. 2000;70:257–271. doi: 10.1046/j.1432-0436.2002.700604.x. [DOI] [PubMed] [Google Scholar]
- Hakim ZS, DiMichele LA, Doherty JT, Homeister JW, Beggs HE, Reichardt LF, Schwartz RJ, Brackhan J, Smithies O, Mack CP, Taylor JM. Conditional deletion of focal adhesion kinase leads to defects in ventricular septation and outflow tract alignment. Mol Cell Biol. 2007;27:5352–5364. doi: 10.1128/MCB.00068-07. [DOI] [PMC free article] [PubMed] [Google Scholar]
- He CX, Shi D, Wu WJ, Ding YF, Feng DM, Lu B, Chen HM, Yao JH, Shen Q, Lu DR, Xue JL. Insulin expression in livers of diabetic mice mediated by hydrodynamics-based administration. World J Gastroenterol. 2004;10:567–572. doi: 10.3748/wjg.v10.i4.567. [DOI] [PMC free article] [PubMed] [Google Scholar]
- Huang D, Cheung AT, Parsons JT, Bryer-Ash M. Focal adhesion kinase (FAK) regulates insulin-stimulated glycogen synthesis in hepatocytes. J Biol Chem. 2002;227:18151–18160. doi: 10.1074/jbc.M104252200. [DOI] [PubMed] [Google Scholar]
- Huang D, Kohe M, Ilic D, Bryer-Ash M. Reduced expression of focal adhesion kinase disrupts insulin action in skeletal muscle cells. Endocrinology. 2006;147:3333–3343. doi: 10.1210/en.2005-0382. [DOI] [PubMed] [Google Scholar]
- Kahn CR. Knockout mice challenge our concepts of glucose homeostasis and the pathogenesis of diabetes. Exp Diabesity Res. 2003;4:169–182. doi: 10.1155/EDR.2003.169. [DOI] [PMC free article] [PubMed] [Google Scholar]
- Kruszynska YT, Olefsky JM. Cellular and molecular mechanisms of non-insulin dependent diabetes mellitus. J Investig Med. 1996;44:413–428. [PubMed] [Google Scholar]
- Le Roith D, Zick Y. Recent advances in our understanding of insulin action and insulin resistance. Diabetes Care. 2001;24:588–597. doi: 10.2337/diacare.24.3.588. [DOI] [PubMed] [Google Scholar]
- Lebrun P, Baron V, Hauck CR, Schlaepfer DD, Obberghen EV. Cell adhesion and focal adhesion kinase regulates insulin receptor substrate-1 expression. J Biol Chem. 2000;275:38371–38377. doi: 10.1074/jbc.M006162200. [DOI] [PubMed] [Google Scholar]
- Lewis DL, Hagstrom JE, Loomis AG, Wolff JA, Herweijer H. Efficient delivery of siRNA for inhibition of gene expression in post natal mice. Nat Genet. 2002;32:107–108. doi: 10.1038/ng944. [DOI] [PubMed] [Google Scholar]
- Lewis DL, Wolff JA. Systemic siRNA delivery via hydrodynamic intravascular injection. Adv Drug Del Rev. 2007;59:115–123. doi: 10.1016/j.addr.2007.03.002. [DOI] [PubMed] [Google Scholar]
- Liu F, Song YK, Liu D. Hydrodynamics based transfection in animals by systemic administration of plasmid DNA. Gene Ther. 1999;6:1258–1266. doi: 10.1038/sj.gt.3300947. [DOI] [PubMed] [Google Scholar]
- McCaffrey AP, Meuse L, Pham TT, Conklin DS, Hannon GJ, Kay MA. RNA interference in adult mice. Nature. 2002;418:38–39. doi: 10.1038/418038a. [DOI] [PubMed] [Google Scholar]
- Mauvais-Jarvis F, Kulkarni RN, Kahn CR. Knockout models are useful tools to dissect the pathophysiology and genetics of insulin resistance. Clin Endocrinol (Oxf) 2002;57:1–9. doi: 10.1046/j.1365-2265.2002.01563.x. [DOI] [PubMed] [Google Scholar]
- Nagle CA, An J, Shiota M, Torres TP, Cline GW, Liu ZX, Wang S, Catlin RL, Shulman GI, Newgard CB, Coleman RA. Hepatic overexpression of glycerol-sn-3-phosphate acyltransferase 1 in rats causes insulin resistance. J Biol Chem. 2007;282:14807–14815. doi: 10.1074/jbc.M611550200. [DOI] [PMC free article] [PubMed] [Google Scholar]
- Petersen KF, Shulam GI. Etiology of insulin resistance. Am J Med. 2006;119:10S–16S. doi: 10.1016/j.amjmed.2006.01.009. [DOI] [PMC free article] [PubMed] [Google Scholar]
- Randel PJ, Garland PB, Hales CN, Newsholme EA. The glucose fatty acid cycle: its role in insulin sensitivity and in metabolic disturbances in diabetes mellitus. Lancet. 1963;1:785–789. doi: 10.1016/s0140-6736(63)91500-9. [DOI] [PubMed] [Google Scholar]
- Ryder JW, Gilbert M, Zierath JR. Skeletal muscle and insulin sensitivity: Pathophysiological alterations. Front Biosci. 2001;6:D154–D163. doi: 10.2741/ryder. [DOI] [PubMed] [Google Scholar]
- Schlaepfer DD, Mitra SK. Multiple connections link FAK to cell motility and invasion. Curr Opin Genet Dev. 2004;14:92–101. doi: 10.1016/j.gde.2003.12.002. [DOI] [PubMed] [Google Scholar]
- Shen T-L, Park AY-J, Alcaraz A, Peng X, Jang I, Koni P, Flavell RA, Gu H, Guan J-L. Conditional knockout of focal adhesion kinase in endothelial cells reveals its role in angiogenesis and vascular development in late embryogenesis. J Cell Biol. 2005;169:941–952. doi: 10.1083/jcb.200411155. [DOI] [PMC free article] [PubMed] [Google Scholar]
- Shoelson SE, Lee J, Goldfine AB. Inflammation and insulin resistance. J Clin Invest. 2006;116:1793–1801. doi: 10.1172/JCI29069. [DOI] [PMC free article] [PubMed] [Google Scholar]
- Solinas G, Vilcu C, Neels JG, Bandyopadhyay GK, Luo JL, Naugler W, Grivennikov S, Wynshaw-Boris A, Scadeng M, Olefsky JM, Karin M. JNK1 in hematopoietically derived cells contributes to diet-induced inflammation and insulin resistance without affecting obesity. Cell Metabol. 2007;6:386–397. doi: 10.1016/j.cmet.2007.09.011. [DOI] [PubMed] [Google Scholar]
- Srinivasan K, Viswanad B, Asrat L, Kaul CL, Ramarao P. Combination of high-fat diet-fed and low-dose streptozotocin-treated rat: a model for type 2 diabetes and pharmacological screening. Pharmacol Res. 2005;52:313–320. doi: 10.1016/j.phrs.2005.05.004. [DOI] [PubMed] [Google Scholar]
- Xia H, Mao Q, Paulson HL, Davidson BL. siRNA-mediated gene silencing in vitro and in vivo. Nat Biotechnol. 2002;10:1006–1010. doi: 10.1038/nbt739. [DOI] [PubMed] [Google Scholar]
- Xu J, Li L, Qian Z, Hong J, Shen S, Huang W. Reduction of PTP1B by RNAi upregulates the activity of insulin controlled fatty acid synthase promoter. Biochem Biophys Res Commun. 2005;329:538–543. doi: 10.1016/j.bbrc.2005.02.016. [DOI] [PubMed] [Google Scholar]
- Yang PL, Althage A, Chung J, Chisari FV. Hydrodynamic injection of viral DNA: a mouse model of acute hepatitis B virus infection. Proc Natl Acad Sci U S A. 2002;99:13825–13830. doi: 10.1073/pnas.202398599. [DOI] [PMC free article] [PubMed] [Google Scholar]
- Zachary I. Focal adhesion kinase. Int J Biochem Cell Biol. 1997;29:929–934. doi: 10.1016/s1357-2725(97)00008-3. [DOI] [PubMed] [Google Scholar]
- Zhou QL, Park JG, Jiang ZY, Holik JJ, Mitra P, Semiz S, Guilherme A, Powelka AM, Tang X, Virbasius J, Czech MP. Analysis of insulin signalling by RNAi-based gene silencing. Biochem Soc Trans. 2004;32:817–821. doi: 10.1042/BST0320817. [DOI] [PubMed] [Google Scholar]
- Zhu HZ, Wang W, Feng DM, Sai Y, Xue JL. Conditional gene modification in mouse liver using hydrodynamic delivery of plasmid DNA encoding Cre recombinase. FEBS Lett. 2006;580:4346–4352. doi: 10.1016/j.febslet.2006.06.094. [DOI] [PubMed] [Google Scholar]
- Zierath JR, Houseknecht KL, Gnudi L, Kahn BB. High-fat feeding impairs insulin-stimulated GLUT4 recruitment via an early insulin signaling defect. Diabetes. 1997;46:215–223. doi: 10.2337/diab.46.2.215. [DOI] [PubMed] [Google Scholar]
Associated Data
This section collects any data citations, data availability statements, or supplementary materials included in this article.


