

Abstract
The principal role of calcium current in the triggering of calcium release in cardiac myocytes is well recognized. The mechanism of how calcium current (ICa) controls the intensity of calcium release is not clear because of the stochastic nature of voltage-dependent gating of calcium channels (DHPRs) and of calcium-dependent gating of ryanodine receptors (RyRs). To disclose the relation between DHPR openings and the probability of calcium release, local calcium release activation by ICa was investigated in rat ventricular myocytes using patch-clamp and confocal microscopy. Calcium spikes were activated by temporally synchronized DHPR calcium current triggers, generated by instantaneous ‘tail’ICa and modulated by prepulse duration, by tail potential, and by the DHPR agonist BayK 8644. The DHPR–RyR coupling fidelity was determined from the temporal distribution of calcium spike latencies using a model based on exponentially distributed DHPR open times. The analysis provided a DHPR mean open time of ∼0.5 ms, RyR activation time constant of ∼0.6 ms, and RyR activation kinetics of the 4th order. The coupling fidelity was low due to the inherent prevalence of very short DHPR openings but was increased when DHPR openings were prolonged by BayK 8644. The probability of calcium release activation was high, despite low coupling fidelity, due to the activation of many DHPRs at individual release sites. We conclude that the control of calcium release intensity by physiological stimuli can be achieved by modulating the number and duration of DHPR openings at low coupling fidelity, thus avoiding the danger of inadvertently triggering calcium release events.
Calcium release in cardiac myocytes is a summation of elementary release events (Cheng et al. 1993; Cannell et al. 1994) that occur at junctions of the sarcolemmal and the sarcoplasmic reticulum (SR) membranes (Franzini-Armstrong et al. 1999). Elementary release events arise from openings of multiple ryanodine receptors (RyRs) (Bridge et al. 1999; Lukyanenko et al. 2000), triggered by calcium current through the dihydropyridine receptor type voltage-dependent calcium channels (DHPRs) (Cannell et al. 1995; Lopez-Lopez et al. 1995; Santana et al. 1996). The relationship between the triggering calcium current and the resulting intensity of calcium release is not clear because of the stochastic nature of DHPR and RyR activity and their limited number at particular release sites. Despite having been accounted for in some excitation–contraction (E-C) coupling models (Stern et al. 1999; Greenstein & Winslow, 2002), the consequences of stochastic channel activity for E-C coupling have not been fully appreciated. Yet it might account for an apparent paradox in excitation–contraction coupling: increasing the amplitude of the single-channel calcium current or the duration and probability of DHPR openings over the basal level increases the probability of calcium release much less than proportionally (Adachi-Akahane et al. 1999; Song et al. 2001; Altamirano & Bers, 2007), suggesting that the DHPR calcium influx that triggers calcium release is already sufficient under basal conditions. However, in some experiments, in which calcium cycling between the SR and the cytosol was enhanced by β-adrenergic stimulation, the probability of calcium release was dramatically elevated (Zhou et al. 1999; Viatchenko-Karpinski & Gyorke, 2001), and the extent of calcium release activation was shown to depend critically on the reopenings of calcium channels (Zahradnikova et al. 2004), suggesting that the triggering DHPR calcium influx was insufficient under basal conditions. In other words, the fidelity of E-C coupling, defined by Zhou et al. (1999) as the probability that one DHPR opening will trigger calcium release, appears to be high (Adachi-Akahane et al. 1999; Song et al. 2001; Altamirano & Bers, 2007) or low (Zhou et al. 1999; Viatchenko-Karpinski & Gyorke, 2001; Zahradnikova et al. 2004) according to the type of experiment, under otherwise similar conditions. Hence, the question of how stochastic processes can have control over graded contraction, i.e. what the principle of the trigger signal to which the Ca2+ release responds is, remains unresolved.
To elucidate the stochastic traits of E-C coupling we applied a temporally well-defined triggering calcium current, in which the mean duration of DHPR openings was manipulated by the DHPR agonist BayK 8644. The impact of short DHPR openings, inherently present in a gated channel, on the fidelity of E-C coupling was evaluated by kinetic analysis of elementary calcium release events based on the exponential distribution of DHPR open times and on the finite activation rate of RyRs.
Methods
Cell isolation
Cardiac myocytes were enzymatically isolated from the left ventricle of male Wistar rats (200–250 g) (Zahradnik & Palade, 1993). The rats were anaesthetized with sodium pentobarbital (100 mg kg−1i.p.) 30 min after heparin was applied (5000 U kg−1i.p.). All anaesthetic and surgical procedures were approved by the State veterinary and food administration of the Slovak Republic. The hearts, after successful anaesthetization, were rapidly dissected and retrogradely perfused in Langendorff apparatus at 37°C. The oxygenated Tyrode solution (in mm: 135 NaCl, 5.4 KCl, 5.0 MgCl2, 1 CaCl2, 0.33 NaH2PO4, 10 Hepes, pH 7.2), the Ca2+-free Tyrode solution, and the enzyme solution (in mm: 135 NaCl, 5.4 KCl, 5.0 MgCl2, 0.02 CaCl2, 0.33 NaH2PO4, 10 Hepes, 0.19 U ml−1 Liberase, pH 7.3) were subsequently used to perfuse the heart, each for 5 min. After this procedure the septum and the left ventricle were dissected and incubated in the enzyme solution for another few minutes as necessary. Then the tissue was triturated in 4 ml of the stopping medium (in mm: 106 CH3SO3H, 106 KOH, 3.9 KCl, 2.4 MgSO4, 8 K2HPO4, 1 EGTA, 22 taurine, 22 glucose, pH 7.3) and the suspension was filtered through a nylon mesh. The cells sedimented within 5 min at 25 g were washed with 4 ml of the stopping medium. This procedure was applied two times. Isolated cells were stored in culture dishes at room temperature for further use within 1–6 h.
Chemicals and solutions
The external solution contained (in mm): 135 NaCl, 5.4 CsCl, 10 Hepes, 5 MgCl2, 0.33 NaH2PO4, 1 CaCl2, and 0.02 TTX, at pH 7.3. The internal – patch pipette – solution contained (in mm: 135 CsCH3SO3, 10 CsCl, 10 Hepes, 2 EGTA, 2 CaEGTA, 3 MgSO4, 3 ATPNa2, and 1 mm OG-5N, pH 7.3). Free calcium was adjusted to 100 nm using a calcium ion-selective electrode (Orion, USA) and 100 mm EGTA or 100 mm CaEGTA solutions. Under these conditions K+ currents were not present. Na+ currents were inhibited by TTX and by a holding potential of −50 mV. Calcium channels were kept in a phosphorylated state by 50 μm cAMP in internal solution and 10 μm IBMX in external solution. Where indicated, 100 nm S(–)BayK 8644 (RBI, USA) was used as a calcium channel activator. The final concentration of the drug was prepared by dissolving an aliquot of a 10 mm ethanol stock solution of BayK 8644 in the external solution (final ethanol concentration < 0.001%). All experiments were performed at room temperature.
Liberase (Liberase Blendzyme 2) was from Roche Diagnostics (Basel, Switzerland), TTX was from Alomone Laboratories (Jerusalem, Israel), Oregon Green 488 BAPTA-5N and 100 mm standard solutions of EGTA and CaEGTA were from Molecular Probes (Eugene, OR, USA); all other chemicals were of analytical grade from Sigma-Aldrich Chemie GmbH (Taufkirchen, Germany). The osmolarity of all solutions was adjusted to 300 mosmol kg−1.
Electrophysiological and confocal measurements
Calcium currents were measured in the whole-cell patch clamp configuration (Zahradnikova et al. 2004; Zahradnikova et al. 2007a) and calcium spikes, the elementary release events, were recorded in parallel by confocal microscopy using the calcium indicator Oregon Green BAPTA-5N (OG-5N) (Zahradnikova et al. 2007a). Pipettes with a resistance of 1.3–2.0 MΩ were from borosilicate glass capillaries (no. BF150–110-10, Sutter Instruments) pulled by a P-97 Flaming–Brown micropipette puller (Sutter Instruments Co., USA). The patch-clamp amplifier (Axopatch 200B, Axon Instruments, USA) with A/D converter (Digidata 1320A, Axon Instruments, USA) and pCLAMP software (v. 9, Axon Instruments, USA) were used. The leak was electronically subtracted and cell capacitance and series resistance were both passively and actively compensated to 50–70%. Currents were sampled at 20 kHz after filtering at 10 kHz. The voltage dependence of calcium current activation by Bay K8644 was assessed from current–voltage curves measured using 70 ms long pulses to −40 to +40 mV from a holding potential of −50 mV. The stimulation period was at least 15 s. The amount of calcium injected into the myocyte by the calcium current (mCa) was determined by the integration of tail currents as previously described (Zahradnikova et al. 2004). Calcium spikes were measured by means of a Leica TCS SP2 AOBS confocal microscope (Leica Microsystems, Germany). A custom-made synchronizer was used for triggering the patch clamp protocol at the desired time of the confocal scanning progress. The fluorescent calcium indicator (OG-5N) dialysed into the cell was excited at 488 nm. The fluorescent emission was recorded at the wavelength range of 493–600 nm through a PlanApochromat 63×/1.32 NA oil immersion objective and a pinhole set to 2.5 Airy units, providing a ∼980 nm thick optical section. For the recording of confocal images, the Leica confocal software (Leica Microsystems, Germany) was used. A line segment parallel to the longitudinal axis of the cell was scanned in bidirectional x–t scanning mode with a frequency of 2000 Hz. The scanning speed required the use of a 4× zoom factor; the resulting images therefore had a spatial resolution of 116 nm per pixel.
Estimation of spike latency and probability
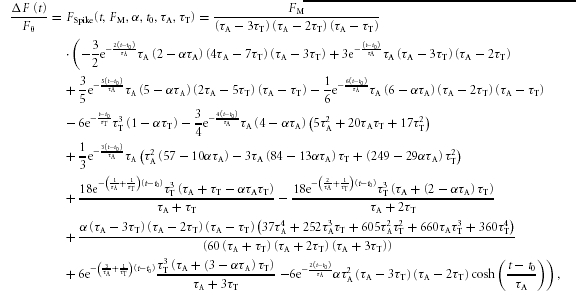
Temporal profiles of fluorescence intensity from seven pixels (0.8 μm width) centred at the release sites were obtained using Scion Image software (Scion Corporation, USA) and analysed as previously described (Zahradnikova et al. 2007a). In brief, each fluorescence profile was fitted by the function FSpike that provided the kinetic parameters of the time course of calcium release flux at the release site:
 |
(1) |
where t0 is the latency of the calcium spike, τA is the time constant of calcium release flux activation, τT is the time constant of calcium release termination, FM is the fluorescence in the absence of calcium release flux termination, and α characterizes the buffering properties of the intracellular environment. The time course of fluorescence intensity is the sum of the time course of the calcium release flux and of the integral of the calcium release flux, the contribution of which is determined by α (Song et al. 1998). The time course of the calcium release flux can be then obtained from eqn (1) by setting the parameter α to α= 0 (Zahradnikova et al. 2007a). In this study, only the latencies of calcium spikes were analysed. All analyses of calcium currents and calcium signals were performed in Origin v. 7.5 (OriginLab Corp., USA).
The calcium spike probability during the tail, PSpike, was estimated as the fraction of all release sites (all sites that exhibited calcium release at least once during observations at the given scan line) that exhibited spikes between the onsets of tail and test potentials.
Data analysis and curve fitting
Calculations were performed using Mathematica (v. 6.0.1, Wolfram Research, USA) (Zahradnikova et al. 2007a). Fitting was performed with Origin Pro v. 7 (OriginLab Corp.) (Zahradnik et al. 2005, 2007a). Statistical analysis was performed in Statistica (v. 7.1, StatSoft Inc., USA). Multiple comparisons were performed with one-way ANOVA with Bonferroni's correction for post hoc tests.
Distribution of calcium spike latencies
In this study we measured the stochastic parameters of elementary release events, specifically their probabilities and latencies, and correlated them with the triggering stimulus. Both stochastic parameters subsume the gating characteristics of DHPRs and RyRs. Here we present the theoretical interpretation of the measured quantities derived on the grounds of the stochastics of channel gating.
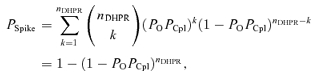
In our experiments, DHPRs were pre-activated by a short prepulse to +60 mV, at which calcium influx was almost absent. At time t = 0, the membrane potential was switched to a negative tail potential, at which calcium current peaked instantaneously and rapidly deactivated. At t = 0, the fraction of open DHPR channels was equal to their open probability at the end of the prepulse, PO. If the number of DHPR channels in the average dyadic junction was nDHPR, then the probability PPO that at t = 0 there were just k open DHPR channels can be calculated from the binomial formula:
| (2) |
An opening of a single DHPR channel leads to the formation of a steep calcium gradient within the dyadic junction (Soeller & Cannell, 1997; Valent et al. 2003). Due to the steepness of the gradient, the probability that the RyR nearest to the open DHPR will be activated greatly exceeds the probability that more distant RyRs will be activated (Cannell & Soeller, 1997). Therefore, we will further consider only the activation of a single RyR by a single triggering DHPR opening.
The calcium concentration gradient within the dyad reaches steady-state level within tens of microseconds (Soeller & Cannell, 1997; Valent et al. 2003). Therefore, calcium concentration increase due to a DHPR opening can be considered a step function at the nearest RyR. Then, the RyR activation time constant, τact, should be inversely proportional to the amplitude of the triggering single-channel DHPR current, which in turn is a linear function of the membrane potential (Rose et al. 1992; Guia et al. 2001; Wang et al. 2001). Upon the closure of the DHPR channel, the triggering stimulus will rapidly decline (Soeller & Cannell, 1997; Valent et al. 2003). Therefore we will consider that the nearest RyR can be activated only for the duration of the DHPR opening.
The probability that the nearest RyR will open increases steeply with the duration and single-channel current amplitude of the triggering DHPR opening, because it is an exponential association function of both, time and calcium concentration, of a higher order (Zahradnikova et al. 1999b). Once the nearest RyR opens, it causes intense calcium influx into the dyad leading to rapid Ca2+ increase throughout the dyadic space (Valent et al. 2007) and to the regenerative activation of available RyRs in the couplon (Stern, 1992; Stern et al. 1999). Therefore the activation of a single RyR was considered to be a sufficient condition for the generation of a calcium spike, and the latency of a calcium spike was considered equal to the latency of this RyR activation. Below we provide mathematical treatment of this concept of DHPR-to-RyR activatory signal transduction in order to characterize the efficiency of cardiac E-C coupling.
Let us consider an experiment with a single couplon and with the tail potential sufficiently negative, so that open DHPR channels deactivate without the possibility to reopen. If there was one DHPR channel, then the probability of release activation would be PSpike=POPCpl, where PCpl is the probability of activation of RyR by the triggering DHPR opening, known as the coupling fidelity (Zhou et al. 1999). Considering that individual DHPR channels contribute independently to the activation of calcium release and that activation of the first RyR leads to the generation of the calcium spike, the probability of release activation for a couplon containing nDHPR DHPR channels is equal to the probability that any of the open DHPR channels activate release:
 |
(3) |
analogous to the formula given by Inoue & Bridge (2003, 2005). At less negative tail potentials, at which DHPRs reopen, the theoretical probability of spike activation for nO openings per DHPR channel contributing independently to calcium release activation should be:
| (4) |
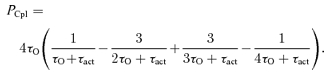
The derivation of the coupling fidelity that accounted for the exponential distribution of DHPR open times (Rose et al. 1992) and the higher-order kinetics of RyR activation by Ca2+ (Zahradnikova et al. 1999a, b, 2003, 2007a) is given in the Supplemental material. Below we give only the result of the derivations for RyR kinetics of the 4th order (Zahradnikova et al. 1999b; Zahradnik et al. 2005), which produced the best fit (see the Supplemental matrial). In this case, the DHPR-RyR coupling fidelity, PCpl, is jointly defined by the DHPR open time (τO) and the RyR activation time constant (τact), and has the form as follows:
 |
(5) |
The RyR activation time constant τact can be determined directly (see below) if the commencement of the triggering DHPR opening is unequivocally defined, as was the case in our experiments at very negative tail membrane potentials, at which the open DHPRs do not reopen after the first closure (Zahradnikova et al. 2004). At other tail potentials, the RyR activation time constant was calculated from τact estimated at Vtail=−120 mV, assuming that τact is inversely proportional to calcium concentration (Schiefer et al. 1995; Zahradnikova & Zahradnik, 1996; Zahradnikova et al. 1999b, 2003; Zahradnik et al. 2005), and thus to DHPR single-channel current, iCa. Assuming linear iCa–voltage dependence we derived the relationship:
| (6) |
where Vref represents the reference tail potential (−120 mV), Vtail is the tail potential, and Vr is the reversal potential of the calcium current.
The number of DHPR openings, nO, at a given tail potential was calculated from the integrals of calcium tail currents (mCa) assuming a linear current–voltage relationship:
 |
(7) |
where Vref=−120 mV, since at this tail potential, nO= 1 (Zahradnikova et al. 2004).
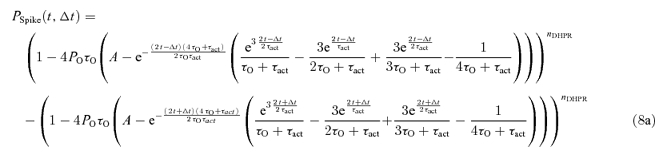
The distribution of calcium spike latencies can be derived analytically only if all DHPR openings occur synchronously, i.e. at very negative tail potentials. For that case and for RyR kinetics of the 4th order, the probability that a calcium spike will be activated in the interval Δt centred at time t was derived in the Supplemental material as:
 |
(8a) |
where
| (8b) |
Note that the two major terms that are subtracted differ just in the sign before the parameter Δt.
This equation was used for fitting the distribution of calcium spike latencies at Vtail=−120 mV.
Results
Activation of calcium spikes by synchronized triggers
Elementary calcium release events, calcium spikes, were activated by a synchronized surge of calcium current through preactivated DHPR channels (tail current) using the compound pulse protocol given in Fig. 1A. The cell held at −50 mV was briefly depolarized to +60 mV to activate a fraction of DHPRs at virtually no net Ca2+ influx. Then the voltage was stepped for 10 ms to a negative potential (tail potential) to inject calcium current through those DHPR channels that were in the open state at the end of the brief prepulse. The fraction of DHPRs through which calcium was injected was set by the duration of the prepulse (1.5 and 5 ms). The amplitude and the duration of triggering calcium influx, i.e. the DHPR single channel current amplitude and the number of reopenings, were modulated by the tail potential level (−120, −80 or −40 mV). After 20 ms stabilization at −50 mV, a test pulse to 0 mV was applied for 70 ms to reveal the release sites that were not activated by the tail pulse.
Figure 1. Typical calcium currents and corresponding OG-5N signals evoked by the prepulse protocol in the absence (left) and presence of BayK 8644 (right).

A, voltage stimulus (top) and corresponding calcium currents (bottom). The grey trace denotes the current measured in the absence of prepulse. The black, red and green lines correspond to tail potentials of −120, −80 and −40 mV, respectively. B, line-scan fluorescence images acquired at 0.5 ms per line (top) and the corresponding line average of cell fluorescence at −120, −80 and −40 mV (black, red and green lines, respectively). The spatial (vertical) coordinate in B was parallel to the long axis of the myocyte. The time coordinate is identical to that of panel A. C, fluorescence profiles at −120, −80 and −40 mV (black, red and green lines, respectively) for positions indicated in B by arrows. The arrows correspond to the position of the centre of selected spikes. The time coordinate is identical to that of panel A.
Typical calcium currents and calcium spikes are given in Fig. 1A and B. In control experiments, the sites that exhibited calcium spikes during the tail potential displayed another spike at the test pulse rarely (P < 0.04), while the release sites that were not activated by the tail exhibited calcium spikes during the test pulse with high probability (P = 0.2–0.8).
Spike probability at tail potentials following 1.5 ms prepulses was significantly higher at higher (more positive) tail potentials (Fig. 2A, filled squares). The mean spike latency increased in parallel with increasing spike probability (Fig. 2B, filled squares). Although reduced in peak amplitude, tail calcium currents at more positive tail potentials injected a significantly larger overall amount of Ca2+ ions (mCa; estimated from the integral of the tail current according to Zahradnikova et al. (2004)) to the cell because of their slower decay (Fig. 3A and B). The number of openings per activated DHPR, calculated using eqn (7), increased with the tail potential substantially (Fig. 3C). The longer mean latency and the larger probability of calcium spikes at less negative tail potentials suggest that a significant fraction of spikes was activated at later times, at which the triggering of calcium release could occur only due to DHPR reopenings that manifested as a slower deactivation of the tail current. This means that the cumulative probability of local calcium release activation follows the local integral of calcium current through DHPRs, that is, calcium release is activated by the same mechanism as was inferred from experiments with release dependent inactivation of the whole cell calcium currents (Zahradnikova et al. 2004).
Figure 2. Probability and latency of calcium spikes in the absence and presence of BayK 8644.

A, fraction of dyads that exhibited calcium release at the given tail potential; B, latency of calcium release activation at the given tail potential. Calcium spikes in response to 1.5 ms and 5 ms prepulses are shown as squares and circles, respectively. Calcium spikes in the absence and presence of BayK 8644 are shown as filled and open symbols, respectively.
Figure 3. Properties of calcium currents.

 |
Prolonging prepulses to 5 ms, which activated virtually all available DHPR channels, increased the spike probability at the tail potential to ∼90%, decreased the spike probability at the test pulse to ∼5%, and suppressed the dependence of the spike probability on the tail potential (Fig. 2A, filled circles). In ∼5% of release sites, a calcium spike was activated neither at the tail potential, nor at the test pulse. The mean latency of calcium spikes at the tail potential was significantly decreased by a prolongation of the prepulse. Additionally, the decrease of mean latency relative to that after 1.5 ms prepulses became more prominent at more positive tail potentials (Fig. 2B, filled circles), at which a large fraction of the calcium ions injected during the stimulus was provided by DHPR reopenings.
These experiments provided evidence that both spike probability and spike latency are dependent on prepulse duration, that is, on the number of DHPRs within the calcium release unit open at the onset of tail repolarization. The effect of tail potential variation indicates that the amplitude and the cumulative duration of DHPR openings affect spike probability and latency. To understand them in separation we repeated these pulse protocols in the presence of BayK 8644, the DHPR agonist known to selectively prolong openings of DHPR calcium channels.
Activation of calcium spikes by a prolonged synchronized trigger
The DHPR agonist BayK 8644 (100 nm) increased the peak calcium current at 0 mV by 60% (Fig. 2D), which has been reported previously as the maximal activation (Zahradnikova et al. 2007b). In the presence of BayK 8644, calcium tail currents were considerably increased and prolonged relative to controls, and calcium spikes were activated only during the tail potential (Fig. 1A and B, right panels). This suggests that the BayK 8644-stimulated calcium influx during the tail might have already been more than sufficient after the 1.5 ms prepulse to activate all available calcium release sites. However, by summarizing the activity of individual release sites in all recordings performed at one scan line it was found that the spike probability in individual recordings was about 0.95 (Fig. 2A, open symbols). This means that either there were release sites at which no DHPR channel opened during both the tail and the test stimulus, or the coupling fidelity PCpl was less than 1 despite prolonged DHPR openings.
As in control solutions, in the presence of BayK 8644 the amplitude of tail currents decreased, while the time constant of the tail current deactivation and the amount of injected Ca2+ ions increased with the tail potential (Fig. 3A and B). In contrast to control records, neither the probability of calcium spike activation nor the mean spike latencies were dependent on the tail potential in the presence of BayK 8644 (Fig. 2A and B, open symbols). Importantly, BayK 8644 significantly prolonged the mean latencies of calcium spikes at the tail potential of −120 mV but had no effect at −40 mV.
Prolonging the prepulses to 5 ms in the presence of BayK 8644 had no effect on PSpike at any tail potential (Fig. 2A, open circles). The mean spike latencies, although significantly shorter than after 1.5 ms prepulses, were still independent of the tail potential (Fig. 2B, open circles).
Distribution of calcium spike latencies
The probability density of calcium spike latencies is shown in Fig. 4A. In control experiments (panels a and c) it is apparent that at more positive tail potentials (grey and black columns) the number of very short latencies is lower (see the first bins) but the number of long latencies is large (see bins above 1 ms). The modus of the latency histogram at −40 mV was shifted to the right by 0.5 ms with respect to that at −120 mV (from 0.75 to 1.25 ms) at both prepulse durations. In other words, the increase in the number of sequential DHPR openings (see Fig. 3C) was paralleled by an increased number of longer latencies. The prolongation of prepulse duration led to an increased occurrence of short latencies and to a decreased occurrence of long latencies.
Figure 4. Experimental and theoretical latency distributions and related spike probabilities.

A, experimental probability density distributions of calcium spike latency in the absence (a and c) and presence of BayK 8644 (b and d) at different tail potentials. a and b, 1.5 ms prepulse; c and d, 5 ms prepulse. The responses to tail potentials of −120, −80 and −40 mV are shown as white, grey and black columns, respectively. B, comparison of experimental probability density distribution of calcium spike latency at −120 mV tail potential in the absence (a and c) and presence of BayK 8644 (b and d) with the theoretical distribution. a and b, 1.5 ms prepulse; c and d, 5 ms prepulse. White and black columns denote, respectively, the experimentally measured probability density and the best fit by eqn (8) with parameters shown in Table 1. C, calculated spike probability at −120 mV (filled symbols) compared with the experimentally determined PSpike (hatched columns).
In the presence of BayK 8644 (panels b and d of Fig. 4A), the latency histograms were similar at all potentials. At −120 mV tail potential (white columns), the number of short latencies was markedly reduced and the number of long latencies was markedly increased with respect to the control. The differences in latency distribution under control conditions and in the presence of BayK 8644 were less pronounced at −80 and −40 mV tail potentials. These findings indicate that a prolongation of DHPR openings (by BayK 8644) or an increase in their number (by increasing the tail potential) increases spike probability as well as the mean latency. In other words, the increase of PSpike is due to release events activated at later times either during the prolonged first DHPR openings or during reopenings, i.e. short openings under control conditions display lower coupling fidelity due to the premature discontinuation of calcium influx.
As in the control experiments, the longer prepulse increased the occurrence of short latencies and decreased the occurrence of long latencies but without a change in the modus of the histogram. The similarity of the effect of prepulse prolongation in the absence and in the presence of BayK 8644, and at all tail potentials, suggests that the decrease of the mean latencies may be due to the increased number of open DHPR channels at the calcium release units upon full activation of the DHPR channels.
Coupling fidelity of calcium channel openings
To disentangle the effect of the changes in DHPR open probability, DHPR open time and DHPR reopening, we took advantage of the fact that at the most negative tail potential, Vtail=−120 mV, the histograms of spike latency can be quantitatively described by eqn (8) (derived in the Supplemental material) because the triggering DHPR openings start synchronously, and because there are virtually no reopenings due to the very fast DHPR deactivation (Zahradnikova et al. 2004). In addition to the kinetic parameters of DHPR openings (open time τO) and of RyR activation by the calcium elevation evoked by Ca2+ influx through the DHPR (activation time constant τact and kinetic order of RyR activation n), the distribution of spike latencies depends on the DHPR open probability PO and on the number of DHPRs in the release unit, nDHPR. Although whole-cell data do not allow the determination of absolute PO levels, relative PO levels under individual conditions could be estimated. The degree of activation of DHPRs at the end of the 1.5 ms prepulse was measured by comparing the integral of calcium tail currents relative to 5 ms prepulses (maximal activation), since the time constant of tail current deactivation does not depend on pulse duration (see Fig. 3A and B). The probability of DHPR activation at the end of the 1.5 ms prepulse was 60 ± 2% in controls and 72 ± 4% in BayK 8644 experiments. The increase of PO induced by BayK 8644 was determined using I–V curves in Fig. 3D. The effect of BayK could be quantitatively described by a 10 mV shift of the activation curve to the left and an 18 ± 4% increase in the overall open probability of DHPRs. These values were used as input parameters for the description of spike latency distribution (see below).
The histograms of spike latencies at Vtail=−120 mV (Fig. 4) were fitted by eqn (8). The data measured under all experimental conditions (1.5 and 5 ms prepulse duration, absence and presence of BayK 8644) were fitted concurrently. Fitting was performed for the DHPR PO range of 0.025–0.6. As detailed in the Supplemental material (text and Figure S1), only RyR activation of the 4th order (n = 4) provided an acceptable fit to the data (Fig. 4B). Parameter values were independent of PO, except for nDHPR, which was inversely proportional to PO (see Figure S2 in the Supplemental material) so that their product, nPO, stayed approximately constant. The constancy of nPO demonstrates that the uncertainty about nDHPR and PO does not invalidate the estimates of coupling fidelity. The optimal parameter values are summarized in Table 1. The overall spike probabilities, calculated from the fitted parameters using eqn (4) (filled squares in Fig. 4C) were in good accordance with the experimentally measured PSpike (hatched columns in Fig. 4C). The coupling fidelity, PCpl, calculated from the values of τO and τact using eqn (5), was substantially less that 1 under all conditions, i.e. even in the presence of BayK 8644. As a result, many DHPR channels had to be simultaneously open at the onset of the tail potential for PSpike to attain the observed values (nPO∼8 for fully activated DHPR channels in the absence of BayK 8644, see Table 1 and Fig. S2 in the Supplemental material). It is worth mentioning that for PO < 0.1, the value reported previously for DHPRs (Rose et al. 1992; Josephson et al. 2002), the nPO estimates would correspond to > 100 DHPR channels. However, for the recent larger estimate of PO= 0.2–0.3 (Inoue & Bridge, 2003), nDHPR corresponds to 20–40.
Table 1.
Parameters related to the stochastic activity of DHPR and RyR channels
| Control | BayK 8644 | |||
|---|---|---|---|---|
| Prepulse (ms) | 1.5 | 5 | 1.5 | 5 |
| DHPR nPO | 4.8 ± 1.2 | 8.0 ± 2.0 | 6.8 ± 1.7 | 9.4 ± 2.4 |
| Control | BayK 8644 | |
|---|---|---|
| DHPR τO (ms) | 0.52 ± 0.07 | 1.35a |
| RyR τact (ms) | 0.62 ± 0.05 | 1.16 ± 0.12 |
| PCpl | 0.15 ± 0.03 | 0.24 ± 0.03 |
In the presence of BayK 8644, τO was fixed at the value determined directly from the time constant of ICa deactivation at −120 mV (Fig. 3A).
These results suggest that a high probability of calcium spike activation can be ensured, despite low coupling fidelity, by the large number of DHPR openings occurring in parallel.
Voltage dependence of coupling fidelity
Coupling fidelity could not be estimated directly for voltages more positive than −120 mV, because the triggering calcium current was not synchronized because of the presence of DHPR reopenings. Nevertheless, since the mean DHPR open time is not voltage dependent (Marks & Jones, 1992), coupling fidelity may be calculated from eqn (5) using eqn (6) to calculate τact as a function of tail potential from τact estimated at −120 mV. The result is shown in Fig. 5 as a continuous line. The voltage dependence of coupling fidelity in the presence of BayK 8644 (not shown in Fig. 5 for clarity) had a similar shape but started at the respective PCpl at −120 mV (open circle in Fig. 5) and became indistinguishable from the control dependence above +30 mV.
Figure 5. Coupling fidelity under different conditions.

Coupling fidelity estimated at different membrane potentials under control conditions, based on published estimates of amplitude and duration of calcium fluxes and of calcium release gain (black triangles, Zhou et al. 1999), based on the measurement of the extent of ICa inactivation by solitary DHPR openings and the published estimates of nDHPR and DHPR PO (grey inverted triangles, Zahradnikova et al. 2004), directly measured in the presence of the calcium channel agonist FPL 64176 and at 10 mm extracellular Ca2+ (open squares, Wang et al. 2001), and obtained in this work by fitting the distributions of calcium spike latencies in response to solitary DHPR openings under control conditions (filled circle) and in the presence of Bay K 8644 (open circle). Theoretical values calculated using data from Table 1 and eqns (5) and (6) are shown as a continuous line. Values calculated using data from Tables 3 and 4 of Zahradnikova et al. (2004) and their eqns (12) and (14), and using two different estimates of nDHPR and DHPR PO (25 and 0.05, Zahradnikova et al. 2004; and 32 and 0.29, this work) are shown as a dashed and a dotted line, respectively. Values calculated using data from Table 1 and (5) and eqns (6), assuming τO= 5 ms in the presence of FPL 64176 and a 50% increase of iCa at 10 mm external Ca2+ (cf. data in Sham et al. 1998; Wang et al. 2001) are shown as a dashed–dotted line.
Discussion
In this work, the coupling fidelity between single DHPR channel openings and calcium release activation was estimated on the grounds of the probability and the latency of calcium spikes. We provided evidence that the coupling fidelity is low and that it concurs with the stochastic nature of DHPR gating. This means that the most frequent brief DHPR openings do not provide enough calcium and therefore do not have the power to activate calcium release. Therefore, a high number of DHPR openings is necessary to trigger the release unit to release calcium. The observed distribution of calcium spike latencies and the high probability of release activation could then be explained only if DHPRs form large clusters at calcium release sites and if their open probability is sufficiently high, so that the product nPO is high.
The size of the DHPR cluster can be estimated by considering the number of RyRs in the release unit of ∼250 estimated by Franzini-Armstrong et al. (1999) and the DHPR/RyR ratio of ∼1: 7 (Bers & Stiffel, 1993), which gives ∼35 DHPR channels per release site. Whether this size is sufficient for the effective functioning of the calcium release unit depends on the open probability of DHPRs. The maximal DHPR open probability can be estimated from the maximal nPO, which was about 8 for 5 ms prepulses to +60 mV (Table 1 and Fig. S2 in the Supplemental material). The corresponding PO for 35 DHPRs is then 0.23. This estimate is compatible with the recent data of Inoue & Bridge (2003). Exact estimates from single-channel experiments at physiological calcium concentrations and at maximal DHPR activation have not yet been published. Previously reported DHPR open probabilities measured at −10 mV were 0.02–0.06 (Rose et al. 1992; Josephson et al. 2002) at 5–10 mm external Ca2+, which may correspond to ∼0.18 at maximal activation if the DHPR voltage dependence from Fig. 3 is used and the 10–20 mV charge screening by elevated calcium (McDonald et al. 1994) is taken into account. Therefore, it can be concluded that the size of the DHPR cluster and the DHPR open probability estimated by previously published data are compatible with the nPO required by the low coupling fidelity.
Estimation of coupling fidelity
In this study, coupling fidelity was estimated directly, using synchronized single openings of a variable number of DHPR channels. We used only generally accepted assumptions, namely that DHPR open times are exponentially distributed (Rose et al. 1992; Sham et al. 1998) and that RyR activation is an exponential function of time (Schiefer et al. 1995; Zahradnikova et al. 2003, 2005). The data shown in Table 1 and Fig. 4 clearly demonstrate that coupling fidelity at −120 mV is low despite the high single-channel amplitude of the calcium current. Previous quantitative estimates of coupling fidelity obtained by different methods seem to differ widely. However, they were reported for a variety of experimental conditions that included different membrane potentials, extracellular calcium concentrations, and the presence of DHPR channel agonists (Zhou et al. 1999; Wang et al. 2001; Zahradnikova et al. 2004). We compare them to our estimates in Fig. 5. It is obvious that, considering the very different origin of the data, they concur reasonably well.
Accepting the fact that the physiological coupling fidelity is low, the high probability of calcium release at 0 mV (Cleemann et al. 1998; Sham et al. 1998; Song et al. 1998; Inoue & Bridge, 2003; Altamirano & Bers, 2007; Zahradnikova et al. 2007a) may be explained only by the many sequential openings of multiple DHPRs at any individual calcium release site. This deduction is in agreement with the finding, derived from the voltage dependence of release-dependent inactivation of whole-cell calcium currents, that the extent of calcium release activation critically depends on the reopenings of calcium channels (Zahradnikova et al. 2004). However, Altamirano & Bers (2007) attributed the high calcium release probability at 0 mV to high coupling fidelity, in order to explain the paradoxical decrease of calcium release gain with both increasing the open probability and increasing the single-channel amplitude of DHPR openings. To resolve this contradiction, we have simulated the experiments of Altamirano & Bers (2007) using eqns (5), (7) and (8), assuming for simplicity that at membrane potentials in the range between 0 and +40 mV the DHPR channels exhibit a constant number of openings before they inactivate. Details of the simulation depicted in Fig. 6 are given in the Supplemental material. When the external calcium concentration was decreased (Fig. 6A), the probability of spike occurrence decreased less steeply than did the calcium current, and therefore the gain increased with decreasing iCa. A similar effect was observed when the decrease in iCa was simulated by increasing the test potential (Fig. 6B). An even more pronounced effect was observed when the number of active DHPR channels was decreased by progressively increasing the holding potential (Fig. 6C). These simulations show that the experimentally observed decrease of release gain with decreasing nPO and iCa (Altamirano & Bers, 2007) is compatible with our results, thus supporting low physiological coupling fidelity.
Figure 6. The dependence of E-C coupling gain on parameters of the triggering DHPR current.

A, dependence on the single-channel amplitude iCa at different extracellular calcium concentrations (given on the labels next to data points). B, dependence on the single-channel amplitude iCa at different test potentials (given on the labels next to data points). C, dependence on the fraction of non-inactivated channels, nPO, at different holding potentials (given on the labels next to data points). Open symbols denote standard conditions (1 mm external Ca2+, 0 mV test potential, −60 mV holding potential), to which both axes are normalized. Insets depict the stimulation protocols. Details are given in the Supplemental material.
Estimation of DHPR and RyR kinetics in situ
Analysis of the latency distribution of calcium spikes evoked by synchronized single DHPR openings allowed the estimation of DHPR open time and RyR activation time constant in situ. The estimated DHPR open time of ∼0.5 ms is only slightly longer than open times from single channel measurements (0.3–0.43 ms, Rose et al. 1992; Sham et al. 1998; Josephson et al. 2002). The estimated time constant of RyR activation under control conditions (τact∼0.6 ms at −120 mV tail potential) is somewhat slower than when measured in planar lipid bilayers (0.3 ms at 100 μm free calcium, Schiefer et al. 1995), probably due to cytosolic Mg2+ that competes with calcium at the RyR (Laver et al. 1997; Zahradnikova et al. 2003) and unbinds from the RyR relatively slowly (Zahradnikova et al. 2003). It should be noted that the time constant of RyR activation is the limiting factor of coupling fidelity in the physiological range of membrane potentials (see the dependence of PCpl on τact in the Supplemental material).
Our data indicate that BayK 8644 prolongs the time constant of RyR activation (Table 1). It is obvious that this effect cannot result from any known effect of BayK on the DHPR. Such prolongation may have contributed to the previously observed depressing effect of BayK 8644 on E-C coupling (McCall & Bers, 1996). Since the sensitivity of RyR to cytosolic calcium is reduced when the SR calcium load is decreased (Gyorke et al. 2002), and since BayK 8644 does not affect RyR open probability and RyR open times but increases the frequency of spontaneous Ca2+ sparks at rest (Copello et al. 2007), reduced SR calcium content is a plausible explanation for the prolongation of τact by BayK 8644 in our experiments.
Control of coupling fidelity and spike probability by the number and duration of DHPR openings
The probability of spike activation was steeply dependent on the tail potential in experiments with a 1.5 ms prepulse. Despite the decreased amplitude of calcium currents at more positive tail potentials, the probability of spike activation was strongly increased but spike latency was increased in parallel, and therefore the increased probability of calcium release activation could be attributed to the increased number of DHPR openings occurring during the slowly decaying tail current.
Prolongation of the prepulse to 5 ms brought about full activation of the DHPRs, which was accompanied by an increase in the probability of spike activation (PSpike∼0.9) and a decrease in the latency of release. The decrease of latency at −120 mV (by ∼0.12 ms) could be fully explained by the increased number of DHPR openings occurring in parallel at individual release sites (see Table 1), as illustrated in Fig. 4 by the satisfactory fit of the latency distribution. We suppose that the decrease of latency at −80 and −40 mV (by 0.26 and 0.36 ms, respectively) is due to the increase in DHPR open probability as well.
The probability of calcium release activation was strongly augmented if the DHPRs were exposed to BayK 8644, and spike probability reached maximal values (PSpike∼0.9) at all tail potentials and prepulse durations employed. However, at −120 mV tail potential, calcium spikes were activated on average ∼0.5 ms later than in the absence of BayK 8644. Fitting the probability distribution of calcium spike latencies revealed that the high probability of calcium spikes occurred despite the slowing of RyR activation but was only partially due to longer DHPR open times that elevate coupling fidelity; it was also a consequence of the high number of simultaneously open DHPRs (nPO; see Table 1) that delivered the calcium stimulus.
Limitations
In the analysis presented, the number of DHPR channels in the cluster, nDHPR, is identical for all release sites in the cell. However, it was shown that individual release sites may differ in the number of DHPR channels, in the probability of calcium spike activation and in spike latency (Inoue & Bridge, 2005). In this work, detailed analyses of individual release sites were not feasible as experimental conditions required at least 15 s intervals between stimulations, which limited the number of repetitions of the whole protocol. Therefore, our results reflect the average number of DHPRs in a group of variable-size couplons.
Another limitation of this work is the assumption of an identical activation rate for all RyRs in all couplons. Since the geometrical arrangement of DHPRs and RyRs in cardiac couplons is not regular (Sun et al. 1995), the distance between a DHPR and its closest RyR may vary. In effect, our results reflect an average τact corresponding to the average DHPR–RyR distance.
Physiological implications
We show here that at the microscopic level, the stochastic features related to the molecular nature of DHPR and RyR channels, the major players of excitation–contraction coupling, are well tuned to ensure reliable cardiac function and still provide room for reaction to changing conditions. At the level of an individual release site, or couplon, several factors revealed their specific role.
The number and open probability of DHPR channels and the number and frequency of sequential DHPR openings
Since the product of PO and PCpl is substantially less than 1 (∼0.035 under control conditions at −120 mV tail potential), all variables in eqn (4)–nO, nDHPR, PO– affect the resulting spike probability in a way similar to coupling fidelity, as can be verified empirically. Therefore, an increase in any of them will strongly increase spike probability. Since parallel DHPR openings decrease spike latency, while sequential openings increase it (see Figs 2 and 4), the number and opening frequency of DHPRs are also important in control of the synchrony of calcium release: the prolonged latency of calcium release activation brought about by serial DHPR openings may result in the decreased synchrony of calcium release (Song et al. 1998; Sah et al. 2002; Altamirano & Bers, 2007) under conditions of low probability and low single-channel amplitude of DHPR openings.
DHPR open time
For membrane potentials that evoke maximal whole cell calcium current (about +10 mV), the coupling fidelity is almost directly proportional to the DHPR open time, as illustrated in the Supplemental material (Fig. S3A). Therefore, the prolongation of DHPR openings will increase the coupling fidelity, while the shortening of DHPR openings will reduce the coupling fidelity.
RyR activation time constant
The coupling fidelity is inversely proportional to the time constant of RyR activation, as illustrated in Supplemental material (Figure S3B). As τact is inversely proportional to the single channel amplitude of DHPR openings, the coupling fidelity is directly proportional to the single-channel amplitude of the DHPR calcium current. Additionally, the coupling fidelity can be regulated by changes in the apparent calcium sensitivity of RyRs that will affect τact, such as changes in the cytosolic Mg2+ concentration (Laver et al. 1997; Zahradnikova et al. 2003) or changes in the SR calcium load (Gyorke & Gyorke, 1998).
We propose that the physiological control of calcium release is achieved by means of a modulation of factors controlling the coupling fidelity, and that these factors may contribute to the changes in excitation–contraction coupling observed in pathological situations.
Changes in the SR calcium load
Luminal calcium, among other effects, changes the calcium sensitivity of RyRs (Gyorke & Gyorke, 1998). Therefore, an increase in the free luminal Ca2+ concentration would decrease τact, while a luminal Ca2+ decrease would increase τact. This effect may underlie, at least in part, the observed steepness of the dependence of the fractional calcium release on the SR calcium load (Shannon et al. 2000). Moreover, it may affect excitation–contraction coupling upon physiological changes in the heart rate (Pieske et al. 1999) or in many types of heart disease when the SR calcium load is chronically decreased (see Bers, 2001 for review).
β-Adrenergic stimulation
β-Adrenergic stimulation leads to an increase in the DHPR open probability (Brum et al. 1984; Yue et al. 1990b), which increases nPO; and to an increase in the DHPR open time τO (Brum et al. 1984; Yue et al. 1990b). Additionally, it increases the SR calcium load (Lindemann et al. 1983), thus decreasing τact. These effects may underlie the increase in the extent and the synchrony of calcium release upon β-adrenergic stimulation (Song et al. 2001; Sah et al. 2002) by jointly increasing spike probability and decreasing spike latency (eqns (4), (5) and (8)) and consequently increasing the force of contraction.
Other conditions that modulate the parameters defining the coupling fidelity include calcium-dependent DHPR inactivation (Yue et al. 1990a) and metabolic inhibition (Chantawansri et al. 2008) that decrease the DHPR open time and thus decrease the coupling fidelity; ischaemic conditions that lead to increased cytosolic Mg2+ concentration (Murphy et al. 1989) and therefore decrease the calcium sensitivity of the RyR and decrease the coupling fidelity; and prepulse-induced facilitation that leads to increased DHPR open time (Josephson et al. 2002) and thus to increased coupling fidelity.
Acknowledgments
The technical assistance of Gizela Gajdošíková is gratefully acknowledged. This work was supported by the European Union Contract No. LSHM-CT-2005–018833/EUGeneHeart, by the grants APVT-51-31104 and VEGA 2/0102/08 to I.Z. and by the Fogarty International Research Collaboration Award 1 R03-TW-05543–01 to S.G.
Supplementary material
Online supplemental material for this paper can be accessed at: http://jp.physoc.org/cgi/content/full/jphysiol.2007.149989/DC1
References
- Adachi-Akahane S, Cleemann L, Morad M. BAY K 8644 modifies Ca2+ cross signaling between DHP and ryanodine receptors in rat ventricular myocytes. Am J Physiol Heart Circ Physiol. 1999;276:H1178–H1189. doi: 10.1152/ajpheart.1999.276.4.H1178. [DOI] [PubMed] [Google Scholar]
- Altamirano J, Bers DM. Voltage dependence of cardiac excitation-contraction coupling: unitary Ca2+ current amplitude and open channel probability. Circ Res. 2007;101:590–597. doi: 10.1161/CIRCRESAHA.107.152322. [DOI] [PubMed] [Google Scholar]
- Bers DM. Excitation–Contraction Coupling and Cardiac Contractile Force. Dordrecht: Kluwer Academic Publishers the Netherlands; 2001. [Google Scholar]
- Bers DM, Stiffel VM. Ratio of ryanodine to dihydropyridine receptors in cardiac and skeletal muscle and implications for E-C coupling. Am J Physiol Cell Physiol. 1993;264:C1587–C1593. doi: 10.1152/ajpcell.1993.264.6.C1587. [DOI] [PubMed] [Google Scholar]
- Bridge JH, Ershler PR, Cannell MB. Properties of Ca2+ sparks evoked by action potentials in mouse ventricular myocytes. J Physiol. 1999;518:469–478. doi: 10.1111/j.1469-7793.1999.0469p.x. [DOI] [PMC free article] [PubMed] [Google Scholar]
- Brum G, Osterrieder W, Trautwein W. β-Adrenergic increase in the calcium conductance of cardiac myocytes studied with the patch clamp. Pflugers Arch. 1984;401:111–118. doi: 10.1007/BF00583870. [DOI] [PubMed] [Google Scholar]
- Cannell MB, Cheng H, Lederer WJ. Spatial non-uniformities in [Ca2+]i during excitation-contraction coupling in cardiac myocytes. Biophys J. 1994;67:1942–1956. doi: 10.1016/S0006-3495(94)80677-0. [DOI] [PMC free article] [PubMed] [Google Scholar]
- Cannell MB, Cheng H, Lederer WJ. The control of calcium release in heart muscle. Science. 1995;268:1045–1049. doi: 10.1126/science.7754384. [DOI] [PubMed] [Google Scholar]
- Cannell MB, Soeller C. Numerical analysis of ryanodine receptor activation by L-type channel activity in the cardiac muscle diad. Biophys J. 1997;73:112–122. doi: 10.1016/S0006-3495(97)78052-4. [DOI] [PMC free article] [PubMed] [Google Scholar]
- Chantawansri C, Huynh N, Yamanaka J, Garfinkel A, Lamp ST, Inoue M, Bridge JH, Goldhaber JI. Effect of metabolic inhibition on couplon behavior in rabbit ventricular myocytes. Biophys J. 2008;94:1656–1666. doi: 10.1529/biophysj.107.114892. [DOI] [PMC free article] [PubMed] [Google Scholar]
- Cheng H, Lederer WJ, Cannell MB. Calcium sparks: elementary events underlying excitation-contraction coupling in heart muscle. Science. 1993;262:740–744. doi: 10.1126/science.8235594. [DOI] [PubMed] [Google Scholar]
- Cleemann L, Wang W, Morad M. Two-dimensional confocal images of organization, density, and gating of focal Ca2+ release sites in rat cardiac myocytes. Proc Natl Acad Sci U S A. 1998;95:10984–10989. doi: 10.1073/pnas.95.18.10984. [DOI] [PMC free article] [PubMed] [Google Scholar]
- Copello JA, Zima AV, Diaz-Sylvester PL, Fill M, Blatter LA. Ca2+ entry-independent effects of L-type Ca2+ channel modulators on Ca2+ sparks in ventricular myocytes. Am J Physiol Cell Physiol. 2007;292:C2129–C2140. doi: 10.1152/ajpcell.00437.2006. [DOI] [PMC free article] [PubMed] [Google Scholar]
- Franzini-Armstrong C, Protasi F, Ramesh V. Shape, size, and distribution of Ca2+ release units and couplons in skeletal and cardiac muscles. Biophys J. 1999;77:1528–1539. doi: 10.1016/S0006-3495(99)77000-1. [DOI] [PMC free article] [PubMed] [Google Scholar]
- Greenstein JL, Winslow RL. An integrative model of the cardiac ventricular myocyte incorporating local control of Ca2+ release. Biophys J. 2002;83:2918–2945. doi: 10.1016/S0006-3495(02)75301-0. [DOI] [PMC free article] [PubMed] [Google Scholar]
- Guia A, Stern MD, Lakatta EG, Josephson IR. Ion concentration-dependence of rat cardiac unitary L-type calcium channel conductance. Biophys J. 2001;80:2742–2750. doi: 10.1016/S0006-3495(01)76242-X. [DOI] [PMC free article] [PubMed] [Google Scholar]
- Gyorke I, Gyorke S. Regulation of the cardiac ryanodine receptor channel by luminal Ca2+ involves luminal Ca2+ sensing sites. Biophys J. 1998;75:2801–2810. doi: 10.1016/S0006-3495(98)77723-9. [DOI] [PMC free article] [PubMed] [Google Scholar]
- Gyorke S, Gyorke I, Lukyanenko V, Terentyev D, Viatchenko-Karpinski S, Wiesner TF. Regulation of sarcoplasmic reticulum calcium release by luminal calcium in cardiac muscle. Front Biosci. 2002;7:d1454–d1463. doi: 10.2741/A852. [DOI] [PubMed] [Google Scholar]
- Inoue M, Bridge JH. Ca2+ sparks in rabbit ventricular myocytes evoked by action potentials: involvement of clusters of L-type Ca2+ channels. Circ Res. 2003;92:532–538. doi: 10.1161/01.RES.0000064175.70693.EC. [DOI] [PubMed] [Google Scholar]
- Inoue M, Bridge JH. Variability in couplon size in rabbit ventricular myocytes. Biophys J. 2005;89:3102–3110. doi: 10.1529/biophysj.105.065862. [DOI] [PMC free article] [PubMed] [Google Scholar]
- Josephson IR, Guia A, Lakatta EG, Stern MD. Modulation of the gating of unitary cardiac L-type Ca2+ channels by conditioning voltage and divalent ions. Biophys J. 2002;83:2575–2586. doi: 10.1016/S0006-3495(02)75268-5. [DOI] [PMC free article] [PubMed] [Google Scholar]
- Laver DR, Baynes TM, Dulhunty AF. Magnesium inhibition of ryanodine-receptor calcium channels: Evidence for two independent mechanisms. J Membr Biol. 1997;156:213–229. doi: 10.1007/s002329900202. [DOI] [PubMed] [Google Scholar]
- Lindemann JP, Jones LR, Hathaway DR, Henry BG, Watanabe AM. β-Adrenergic stimulation of phospholamban phosphorylation and Ca2+-ATPase activity in guinea pig ventricles. J Biol Chem. 1983;258:464–471. [PubMed] [Google Scholar]
- Lopez-Lopez JR, Shacklock PS, Balke CW, Wier WG. Local calcium transients triggered by single L-type calcium channel currents in cardiac cells. Science. 1995;268:1042–1045. doi: 10.1126/science.7754383. [DOI] [PubMed] [Google Scholar]
- Lukyanenko V, Gyorke I, Subramanian S, Smirnov A, Wiesner TF, Gyorke S. Inhibition of Ca2+ sparks by ruthenium red in permeabilized rat ventricular myocytes. Biophys J. 2000;79:1273–1284. doi: 10.1016/S0006-3495(00)76381-8. [DOI] [PMC free article] [PubMed] [Google Scholar]
- Marks TN, Jones SW. Calcium currents in the A7r5 smooth muscle-derived cell line. An allosteric model for calcium channel activation and dihydropyridine agonist action. J Gen Physiol. 1992;99:367–390. doi: 10.1085/jgp.99.3.367. [DOI] [PMC free article] [PubMed] [Google Scholar]
- McCall E, Bers DM. BAY K 8644 depresses excitation-contraction coupling in cardiac muscle. Am J Physiol Cell Physiol. 1996;270:C878–C884. doi: 10.1152/ajpcell.1996.270.3.C878. [DOI] [PubMed] [Google Scholar]
- McDonald TF, Pelzer S, Trautwein W, Pelzer DJ. Regulation and modulation of calcium channels in cardiac, skeletal, and smooth muscle cells. Physiol Rev. 1994;74:365–507. doi: 10.1152/physrev.1994.74.2.365. [DOI] [PubMed] [Google Scholar]
- Murphy E, Steenbergen C, Levy LA, Raju B, London RE. Cytosolic free magnesium levels in ischemic rat heart. J Biol Chem. 1989;264:5622–5627. [PubMed] [Google Scholar]
- Pieske B, Maier LS, Bers DM, Hasenfuss G. Ca2+ handling and sarcoplasmic reticulum Ca2+ content in isolated failing and nonfailing human myocardium. Circ Res. 1999;85:38–46. doi: 10.1161/01.res.85.1.38. [DOI] [PubMed] [Google Scholar]
- Rose WC, Balke CW, Wier WG, Marban E. Macroscopic and unitary properties of physiological ion flux through L-type Ca2+ channels in guinea-pig heart cells. J Physiol. 1992;456:267–284. doi: 10.1113/jphysiol.1992.sp019336. [DOI] [PMC free article] [PubMed] [Google Scholar]
- Sah R, Ramirez RJ, Backx PH. Modulation of Ca2+ release in cardiac myocytes by changes in repolarization rate: role of phase-1 action potential repolarization in excitation-contraction coupling. Circ Res. 2002;90:165–173. doi: 10.1161/hh0202.103315. [DOI] [PubMed] [Google Scholar]
- Santana LF, Cheng H, Gomez AM, Cannell MB, Lederer WJ. Relation between the sarcolemmal Ca2+ current and Ca2+ sparks and local control theories for cardiac excitation-contraction coupling. Circ Res. 1996;78:166–171. doi: 10.1161/01.res.78.1.166. [DOI] [PubMed] [Google Scholar]
- Schiefer A, Meissner G, Isenberg G. Ca2+ activation and Ca2+ inactivation of canine reconstituted cardiac sarcoplasmic reticulum Ca2+-release channels. J Physiol. 1995;489:337–348. doi: 10.1113/jphysiol.1995.sp021055. [DOI] [PMC free article] [PubMed] [Google Scholar]
- Sham JS, Song LS, Chen Y, Deng LH, Stern MD, Lakatta EG, Cheng H. Termination of Ca2+ release by a local inactivation of ryanodine receptors in cardiac myocytes. Proc Natl Acad Sci U S A. 1998;95:15096–15101. doi: 10.1073/pnas.95.25.15096. [DOI] [PMC free article] [PubMed] [Google Scholar]
- Shannon TR, Ginsburg KS, Bers DM. Potentiation of fractional sarcoplasmic reticulum calcium release by total and free intra-sarcoplasmic reticulum calcium concentration. Biophys J. 2000;78:334–343. doi: 10.1016/S0006-3495(00)76596-9. [DOI] [PMC free article] [PubMed] [Google Scholar]
- Soeller C, Cannell MB. Numerical simulation of local calcium movements during L-type calcium channel gating in the cardiac diad. Biophys J. 1997;73:97–111. doi: 10.1016/S0006-3495(97)78051-2. [DOI] [PMC free article] [PubMed] [Google Scholar]
- Song LS, Sham JS, Stern MD, Lakatta EG, Cheng H. Direct measurement of SR release flux by tracking ‘Ca2+ spikes’ in rat cardiac myocytes. J Physiol. 1998;512:677–691. doi: 10.1111/j.1469-7793.1998.677bd.x. [DOI] [PMC free article] [PubMed] [Google Scholar]
- Song LS, Wang SQ, Xiao RP, Spurgeon H, Lakatta EG, Cheng H. β-Adrenergic stimulation synchronizes intracellular Ca2+ release during excitation-contraction coupling in cardiac myocytes. Circ Res. 2001;88:794–801. doi: 10.1161/hh0801.090461. [DOI] [PubMed] [Google Scholar]
- Stern MD. Theory of excitation-contraction coupling in cardiac muscle. Biophys J. 1992;63:497–517. doi: 10.1016/S0006-3495(92)81615-6. [DOI] [PMC free article] [PubMed] [Google Scholar]
- Stern MD, Song LS, Cheng H, Sham JS, Yang HT, Boheler KR, Rios E. Local control models of cardiac excitation-contraction coupling. A possible role for allosteric interactions between ryanodine receptors. J Gen Physiol. 1999;113:469–489. doi: 10.1085/jgp.113.3.469. [DOI] [PMC free article] [PubMed] [Google Scholar]
- Sun XH, Protasi F, Takahashi M, Takeshima H, Ferguson DG, Franzini-Armstrong C. Molecular architecture of membranes involved in excitation-contraction coupling of cardiac muscle. J Cell Biol. 1995;129:659–671. doi: 10.1083/jcb.129.3.659. [DOI] [PMC free article] [PubMed] [Google Scholar]
- Valent I, Zahradnikova A, Pavelkova J, Zahradnik I. Spatial and temporal Ca2+, Mg2+, and ATP2− dynamics in cardiac dyads during calcium release. Biochim Biophys Acta. 2007;1768:155–166. doi: 10.1016/j.bbamem.2006.08.020. [DOI] [PubMed] [Google Scholar]
- Valent I, Zahradnikova A, Zahradnik I. An implementation of the VLUGR3 solver for 3D-simulation of the reaction-diffusion processes in the cardiac dyad. In: Capasso V, editor. Mathematical Modelling and Computing in Biology and Medicine. Bologna: Esculapio; 2003. pp. 213–218. [Google Scholar]
- Viatchenko-Karpinski S, Gyorke S. Modulation of the Ca2+-induced Ca2+ release cascade by β-adrenergic stimulation in rat ventricular myocytes. J Physiol. 2001;533:837–848. doi: 10.1111/j.1469-7793.2001.t01-1-00837.x. [DOI] [PMC free article] [PubMed] [Google Scholar]
- Wang SQ, Song LS, Lakatta EG, Cheng H. Ca2+ signalling between single L-type Ca2+ channels and ryanodine receptors in heart cells. Nature. 2001;410:592–596. doi: 10.1038/35069083. [DOI] [PubMed] [Google Scholar]
- Yue DT, Backx PH, Imredy JP. Calcium-sensitive inactivation in the gating of single calcium channels. Science. 1990a;250:1735–1738. doi: 10.1126/science.2176745. [DOI] [PubMed] [Google Scholar]
- Yue DT, Herzig S, Marban E. β-Adrenergic stimulation of calcium channels occurs by potentiation of high-activity gating modes. Proc Natl Acad Sci U S A. 1990b;87:753–757. doi: 10.1073/pnas.87.2.753. [DOI] [PMC free article] [PubMed] [Google Scholar]
- Zahradnik I, Gyorke S, Zahradnikova A. Calcium activation of ryanodine receptor channels – reconciling RyR gating models with tetrameric channel structure. J Gen Physiol. 2005;126:515–527. doi: 10.1085/jgp.200509328. [DOI] [PMC free article] [PubMed] [Google Scholar]
- Zahradnik I, Palade P. Multiple effects of caffeine on calcium current in rat ventricular myocytes. Pflugers Arch. 1993;424:129–136. doi: 10.1007/BF00374603. [DOI] [PubMed] [Google Scholar]
- Zahradnikova A, Dura M, Gyorke I, Escobar AL, Zahradnik I, Gyorke S. Regulation of dynamic behavior of cardiac ryanodine receptor by Mg2+ under simulated physiological conditions. Am J Physiol Cell Physiol. 2003;285:C1059–C1070. doi: 10.1152/ajpcell.00118.2003. [DOI] [PubMed] [Google Scholar]
- Zahradnikova A, Kubalova Z, Pavelkova J, Gyorke S, Zahradnik I. Activation of calcium release assessed by calcium release-induced inactivation of calcium current in rat cardiac myocytes. Am J Physiol Cell Physiol. 2004;286:C330–C341. doi: 10.1152/ajpcell.00272.2003. [DOI] [PubMed] [Google Scholar]
- Zahradnikova A, Maco P, Menhart P, Zahradnik I. A novel dynamic algorithm for stochastic simulation of a group of coupled ionic channels. Biophys J. 1999a;76:A460–A460. [Google Scholar]
- Zahradnikova A, Minarovic I, Zahradnik I. Competitive and cooperative effects of Bay K8644 on the L-type calcium channel current inhibition by calcium channel antagonists. J Pharmacol Exp Ther. 2007b;322:638–645. doi: 10.1124/jpet.107.122176. [DOI] [PubMed] [Google Scholar]
- Zahradnikova A, Jr, Polakova E, Zahradnik I, Zahradnikova A. Kinetics of calcium spikes in rat cardiac myocytes. J Physiol. 2007a;578:677–691. doi: 10.1113/jphysiol.2006.117796. [DOI] [PMC free article] [PubMed] [Google Scholar]
- Zahradnikova A, Zahradnik I. A minimal gating model for the cardiac calcium release channel. Biophys J. 1996;71:2996–3012. doi: 10.1016/S0006-3495(96)79492-4. [DOI] [PMC free article] [PubMed] [Google Scholar]
- Zahradnikova A, Zahradnik I, Gyorke I, Gyorke S. Rapid activation of the cardiac ryanodine receptor by submillisecond calcium stimuli. J Gen Physiol. 1999b;114:787–798. doi: 10.1085/jgp.114.6.787. [DOI] [PMC free article] [PubMed] [Google Scholar]
- Zhou YY, Song LS, Lakatta EG, Xiao RP, Cheng H. Constitutive β2-adrenergic signalling enhances sarcoplasmic reticulum Ca2+ cycling to augment contraction in mouse heart. J Physiol. 1999;521:351–361. doi: 10.1111/j.1469-7793.1999.00351.x. [DOI] [PMC free article] [PubMed] [Google Scholar]
Associated Data
This section collects any data citations, data availability statements, or supplementary materials included in this article.