Base opening or flipping is an important biological event, being involved in DNA repair, bacterial restriction systems and transcription, among others.1,2 These roles have, in part, motivated a large number of experimental studies of base opening via NMR imino proton exchange.3–6 From these experiments lifetimes of Watson-Crick (WC) base paired (i.e. closed) and open states and the equilibrium constant between those states have been determined. This determination is based on a two state model of opening, where the open states are differentiated from the closed states by their ability to undergo imino proton exchange. While this model appears to be robust, an inherent limitation is that for a given base pair the exact conformational change being monitored is not known as imino proton exchange can occur whenever the imino proton is accessible to solvent. This accessibility may be achieved via opening of the base that contains the imino proton (i.e. G or T) or its WC partner, whose opening also exposes the imino proton of its partner.7 In this communication, we apply computational methods to investigate base opening in a GC and an AT base pair for sequences on which imino proton exchange data is available. Results from these calculations indicate that the base opening studies using NMR imino proton exchange are primarily monitoring the opening of the G and A bases in GC and AT base pairs, respectively.
Typically, GC and AT base pair lifetimes in DNA are observed to be approximately 10–50 ms and 1–5 ms, respectively, with the open base lifetime on the order of nanoseconds. The equilibrium constant between the base pair open and closed states is on the order of 10−6–10−7. While these phenomena are primarily dependent on the strength of base pair interaction energies, it has been shown that they are also sequence context dependent.3–6 However, interpretation of the data is complicated by a variety of interactions (e.g. base-base hydrogen bonding and stacking) contributing to the experimental results. To allow for a more detailed structural interpretation of such results a better understanding of the events being monitored is required. This may be achieved via potential of mean force (PMF) calculations based on molecular dynamics (MD) simulations.8–10 While this approach has been applied previously to investigate base opening,11–13 it has not be performed simultaneously on both GC and AT base pairs with the results being directly compared to experimental data. Such a comparison is required to insure the structural events observed in the MD studies are representative of the experimental regimen.
Free energy profiles (i.e. PMFs) corresponding to opening of the underlined A and its WC partner T in CGCGAATTCGCG and the underlined C and its WC partner G in CATGGCGCCATG were determined via umbrella sampling.7,8 These two sequences were chosen due to the availability of experimental data enabling direct comparison with the computed results.3,4 All MD simulations were carried out using the CHARMM program14,15 with the CHARMM27 all atom nucleic acid force field16,17 following a previously published protocol.7,8 Briefly, 72 conformers were generated for each of the base flipping processes. These structures were immersed in a water sphere of radius 35 Å, sodium ions added to maintain electrical neutrality and the solvent molecules equilibrated by a 500-step Steepest Descent minimization followed by a 20 ps NVT simulation with harmonic restraints on the DNA. For the production run, 72 independent 220 ps MD simulations were performed for each of the base flipping profiles with a harmonic umbrella potential based on a center of mass (COM) pseudodihedral angle (x), where x ranges from 0–360° in 5° increments. The pseudodihedral angle was based on the COM of the non-hydrogen atoms in the flipping base, its sugar moiety, the sugar moiety of the adjacent nucleotide on the 3′ side and the adjacent base pair on the 3′ side (Fig. S1 of Supporting Information). All MD simulations were performed at 288 K in accordance with the experimental conditions. The final 160 ps windows were used for the PMF determination. From the MD simulations probability distributions biased due to the umbrella potential were obtained; weighted histogram analysis method (WHAM) was applied to obtain the unbiased probability distributions from which the free energy surfaces were calculated.7,8
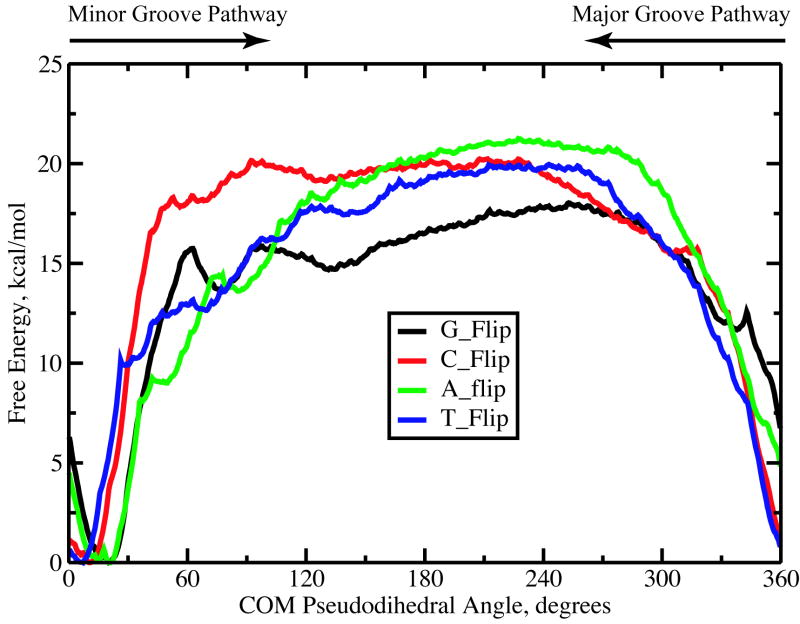
Figure 1 depicts the free energy profiles for opening of the target G, C, A and T bases along the COM pseudodihedral angle reaction coordinate. The positions of the WC base paired state differ slightly for the four bases (x = 30° for G and A, x = 7° for T and x = 10° for C) due to differences in the COM of the base atoms using in the definition of x. The free energies of the fully flipped state (x ~ 195°) for C, A and T are similar, around19.4 – 20.5 kcal/mol, while the G base opened state lies significantly lower at 16.9 kcal/mol. Along the minor groove pathway, the free energies increase more rapidly compared to the major groove pathway, probably due to the steric hindrance experienced by the flipping base due to its WC partner. However, after the bases move out of the duplex from the WC base paired state by 30° or more, the free energies are typically lower compared to those along the major groove pathway. Free energy profiles corresponding to A and T base flipping indicates the presence of two shallow minima during the early stages of flipping along the minor groove pathway. It is noted that free energy barrier for flipping C base is higher than that for the G base, an observation which is different from other studies7,12 and appears to be associated with sequence specific events.
Figure 1.
Free energy profiles corresponding to the target G, C, A and T base flipping processes along the COM pseudodihedral angle coordinate.
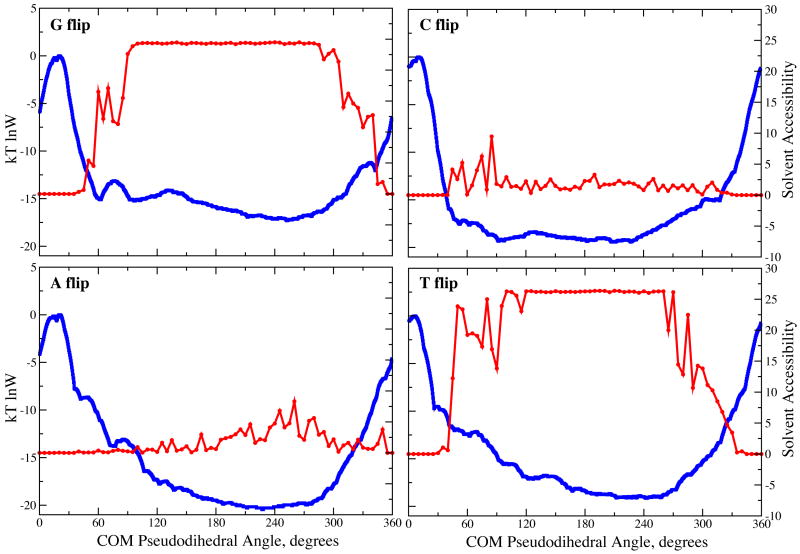
To allow for direct comparison of the calculated PMFs with experimental imino proton exchange data, equilibrium constants for the base open versus closed states were calculated by integrating over the Boltzmann weighted unbiased probability distributions as previously described.7 The portions of the PMFs corresponding to the open and closed states were classified based on the solvent accessible surface area (SASA) of the imino proton and the nitrogen to which it is covalently attached for G (for G and C base flipping) and T (for A and T base flipping), by assuming that regions of the PMFs where the SASA is > 0 correspond to open states (Fig. 2). The SASA for all four bases rapidly increases approximately 45° from the WC base paired state; the smaller change in SASA for the C and A bases is due to the respective G and T bases that contain the imino proton remaining stacked in the DNA helix.
Figure 2.
Solvent accessible surface areas in Å2 (red) and Boltzmann weighted logarithm of probabilities (blue) as a function of the COM pseudodihedral from the PMF. Regions of the probability distributions designated as open states are listed in Table 1.
The resulting calculated and experimental equilibrium constants for the AT and GC base pairs are presented in Table 1. The computed equilibrium constants for GC and AT base pair opening are in excellent agreement with the experimental data, validating the applied computational methodology. To understand the contribution of the individual bases to the equilibrium constants, their individual equilibrium constants between the open and closed states are reported in Table 1. As may be seen, the purine bases dominate the overall base pair opening equilibrium constants, which are calculated as the sum of the individual base equilibrium constants. Based on this observation, it is predicted that imino proton exchange NMR experiments are monitoring the opening of the purine bases and not the pyrimidine bases, whose contribution to the overall equilibrium constant is close to an order of magnitude or more lower than those of the purines. This result is consistent with previous data reported for GC opening in a different DNA sequence, that includes results from the CHARMM, AMBER 4.118 and BMS19 force fields.20 Thus, MD simulation results strongly indicate that NMR imino proton exchange experiments are predominately monitoring opening of the purine bases from DNA duplexes. While this conclusion may be dependant on the DNA sequence, it should facilitate the structural interpretation of the related experimental studies.
Table 1.
Calculated equilibrium constants for the base opening of individual bases and the base pairs, and the observed equilibrium constants for the GC and AT base pair opening. The COM pseudodihedral angle ranges corresponding to the selected open states are also given.
| Base pair | Equilibrium constants | |
|---|---|---|
| Calculated | Experimental | |
| GC | 1.5 × 10⁻⁷ | (4.8±0.7) ×10− 7 |
| AT | 4.1 × 10⁻⁶ | (3.7±0.7) × 10− 6 |
|
| ||
| Individual base contributions
| ||
| COM pseudodihedral angle open range | Equilibrium constant | |
|
| ||
| G | 40–350° | 1.5 × 10− 7 |
| C | 45–325° | 7.4 × 10− 11 |
| A | 60–350° | 3.5 × 10− 6 |
| T | 30–340° | 5.8 × 10− 7 |
Supplementary Material
Figure defining the COM pseudodihedral angle used for base opening. This information is available free of charge via the Internet at http://pubs.acs.org/
Acknowledgments
Appreciation to the NIH (GM51501), the Pittsburgh Supercomputing Center and the NCSA for support, and Dr. Irina Russu for helpful discussion.
References
- 1.Roberts RJ. Cell. 1995;82:9–12. doi: 10.1016/0092-8674(95)90046-2. [DOI] [PubMed] [Google Scholar]
- 2.Roberts RJ, Cheng X. Ann Rev Biochem. 1998;67:181–198. doi: 10.1146/annurev.biochem.67.1.181. [DOI] [PubMed] [Google Scholar]
- 3.Dornberger U, Leijon M, Fritzsche H. J Biol Chem. 1999;274:6957–6962. doi: 10.1074/jbc.274.11.6957. [DOI] [PubMed] [Google Scholar]
- 4.Wärmländer S, Sen A, Leijon M. Biochem. 2000;39:607–615. doi: 10.1021/bi991863b. [DOI] [PubMed] [Google Scholar]
- 5.Gueron M, Leroy JL. Methods Enzymol. 1995;261:383–413. doi: 10.1016/s0076-6879(95)61018-9. [DOI] [PubMed] [Google Scholar]
- 6.Chen CJ, Russu IM. Biophys J. 2004;87:2545–2551. doi: 10.1529/biophysj.104.045179. [DOI] [PMC free article] [PubMed] [Google Scholar]
- 7.Banavali NK, MacKerell AD., Jr J Mol Biol. 2002;319:141–160. doi: 10.1016/S0022-2836(02)00194-8. [DOI] [PubMed] [Google Scholar]
- 8.Huang N, Banavali NK, MacKerell AD., Jr Proc Natl Acad Sci U S A. 2003;100:68–73. doi: 10.1073/pnas.0135427100. [DOI] [PMC free article] [PubMed] [Google Scholar]
- 9.Huang N, MacKerell AD., Jr Phil Trans Royal Soc, London, A. 2004;362:1439–1460. doi: 10.1098/rsta.2004.1383. [DOI] [PubMed] [Google Scholar]
- 10.Huang N, MacKerell AD., Jr J Mol Biol. 2005;345:265–274. doi: 10.1016/j.jmb.2004.10.042. [DOI] [PubMed] [Google Scholar]
- 11.Varnai P, Lavery R. J Am Chem Soc. 2002;124:7272–7273. doi: 10.1021/ja025980x. [DOI] [PubMed] [Google Scholar]
- 12.Giudice E, Varnai P, Lavery R. Nucleic Acids Res. 2003;31:1434–1443. doi: 10.1093/nar/gkg239. [DOI] [PMC free article] [PubMed] [Google Scholar]
- 13.Fuxreiter M, Luo M, Jedlovszky P, Simon I, Osman R. J Mol Biol. 2002;323:823–834. doi: 10.1016/s0022-2836(02)00999-3. [DOI] [PubMed] [Google Scholar]
- 14.MacKerell AD, Jr, Brooks B, Brooks CL, III, Nilsson L, Roux B, Won Y, Karplus M. CHARMM: The Energy Function and Its Paramerization with an Overview of the Program. In: Schleyer PvR, Allinger NL, Clark T, Gasteiger J, Kollman PA, Schaefer HF, III, Schreiner PR., editors. Encyclopedia of Computational Chemistry. Vol. 1. John Wiley & Sons; Chichester: 1998. pp. 271–277. [Google Scholar]
- 15.Brooks BR, Bruccoleri RE, Olafson BD, States DJ, Swaminathan S, Karplus M. J Comput Chem. 1983;4:187–217. [Google Scholar]
- 16.Foloppe N, MacKerell AD., Jr J Comp Chem. 2000;21:86–104. [Google Scholar]
- 17.MacKerell AD, Jr, Banavali NK. J Comp Chem. 2000;21:105–120. [Google Scholar]
- 18.Cornell WD, Cieplak P, Bayly CI, Gould IR, Merz KM, Ferguson DM, Spellmeyer DC, Fox T, Caldwell JW, Kollman PA. J Am Chem Soc. 1995;117:5179–5197. [Google Scholar]
- 19.Langley DR. J Biomol Struct Dyn. 1998;16:487–509. doi: 10.1080/07391102.1998.10508265. [DOI] [PubMed] [Google Scholar]
- 20.Priyakumar UD, MacKerell AD., Jr J Chem Theor Comput. 2005 doi: 10.1021/ct0501957. On line: http://dx.doi.org/10.1021/ct051957. [DOI] [PubMed]
Associated Data
This section collects any data citations, data availability statements, or supplementary materials included in this article.
Supplementary Materials
Figure defining the COM pseudodihedral angle used for base opening. This information is available free of charge via the Internet at http://pubs.acs.org/


