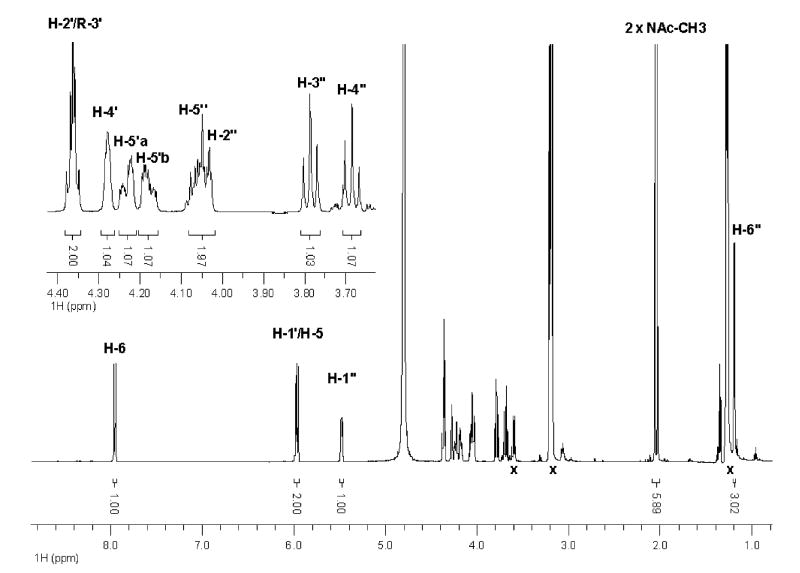
Figure 7.
1H NMR spectrum of enzymatically synthesized UDP-Bac. Proton chemical shift labels follow the scheme represented in Figure 2 and values in Table 2. Peaks designated by ‘x’ indicate signals from impurities and TEAB buffer. Peak surface and integration values are also indicated. Inset enlarges the view of proximally occurring chemical shifts from ribose and pyranose ring moieties.

